Estimated zip code population in 2022: 18,684
Zip code population in 2010: 17,637
Zip code population in 2000: 18,363
Houses and condos: 9,401
Renter-occupied apartments: 4,628
% of renters here:
54%State:
33%
March 2022 cost of living index in zip code 44123: 94.4
(less than average, U.S. average is 100)
Land area: 2.6
sq. mi.
Water area: 0.4
sq. mi.
Population density: 7,252 people per square mile (high).
OSM Map
General Map
Google Map
MSN Map
OSM Map
General Map
Google Map
MSN Map
OSM Map
General Map
Google Map
MSN Map
OSM Map
General Map
Google Map
MSN Map
Please wait while loading the map...
Real estate property taxes paid for housing units in 2022:
This zip code:
2.4% ($2,500)Ohio:
1.3% ($2,639)
Median real estate property taxes paid for housing units with mortgages in 2022: $2,530 (2.3%)
Median real estate property taxes paid for housing units with no mortgage in 2022: $2,474 (2.6%)
Profiles of local businesses
Business Search - 14 Million verified businesses
Males: 8,797 Females: 9,886
For population 25 years and over in 44123:
High school or higher: 88.5%Bachelor's degree or higher: 22.6%Graduate or professional degree: 9.8%Unemployed: 6.3%Mean travel time to work (commute): 24.0 minutes
For population 15 years and over in 44123:
Never married: 55.4%Now married: 25.9%Separated: 1.7%Widowed: 4.0%Divorced: 13.1%
Zip code 44123 compared to state average:
Median house value below state average. Black race population percentage significantly above state average. Hispanic race population percentage significantly below state average. Foreign-born population percentage below state average. Renting percentage above state average. Length of stay since moving in significantly above state average. House age above state average. 12,088 64.7% Black 5,311 28.4% White 925 5.0% Two or more races 224 1.2% Hispanic or Latino 73 0.4% Asian 40 0.2% Some other race 18 0.10% American Indian
Data:
Median household income ($)
Median household income (% change since 2000)
Household income diversity
Ratio of average income to average house value (%)
Ratio of average income to average rent
Median household income ($) - White
Median household income ($) - Black or African American
Median household income ($) - Asian
Median household income ($) - Hispanic or Latino
Median household income ($) - American Indian and Alaska Native
Median household income ($) - Multirace
Median household income ($) - Other Race
Median household income for houses/condos with a mortgage ($)
Median household income for apartments without a mortgage ($)
Races - White alone (%)
Races - White alone (% change since 2000)
Races - Black alone (%)
Races - Black alone (% change since 2000)
Races - American Indian alone (%)
Races - American Indian alone (% change since 2000)
Races - Asian alone (%)
Races - Asian alone (% change since 2000)
Races - Hispanic (%)
Races - Hispanic (% change since 2000)
Races - Native Hawaiian and Other Pacific Islander alone (%)
Races - Native Hawaiian and Other Pacific Islander alone (% change since 2000)
Races - Two or more races (%)
Races - Two or more races (% change since 2000)
Races - Other race alone (%)
Races - Other race alone (% change since 2000)
Racial diversity
Unemployment (%)
Unemployment (% change since 2000)
Unemployment (%) - White
Unemployment (%) - Black or African American
Unemployment (%) - Asian
Unemployment (%) - Hispanic or Latino
Unemployment (%) - American Indian and Alaska Native
Unemployment (%) - Multirace
Unemployment (%) - Other Race
Population density (people per square mile)
Population - Males (%)
Population - Females (%)
Population - Males (%) - White
Population - Males (%) - Black or African American
Population - Males (%) - Asian
Population - Males (%) - Hispanic or Latino
Population - Males (%) - American Indian and Alaska Native
Population - Males (%) - Multirace
Population - Males (%) - Other Race
Population - Females (%) - White
Population - Females (%) - Black or African American
Population - Females (%) - Asian
Population - Females (%) - Hispanic or Latino
Population - Females (%) - American Indian and Alaska Native
Population - Females (%) - Multirace
Population - Females (%) - Other Race
Coronavirus confirmed cases (Apr 27, 2024)
Deaths caused by coronavirus (Apr 27, 2024)
Coronavirus confirmed cases (per 100k population) (Apr 27, 2024)
Deaths caused by coronavirus (per 100k population) (Apr 27, 2024)
Daily increase in number of cases (Apr 27, 2024)
Weekly increase in number of cases (Apr 27, 2024)
Cases doubled (in days) (Apr 27, 2024)
Hospitalized patients (Apr 18, 2022)
Negative test results (Apr 18, 2022)
Total test results (Apr 18, 2022)
COVID Vaccine doses distributed (per 100k population) (Sep 19, 2023)
COVID Vaccine doses administered (per 100k population) (Sep 19, 2023)
COVID Vaccine doses distributed (Sep 19, 2023)
COVID Vaccine doses administered (Sep 19, 2023)
Likely homosexual households (%)
Likely homosexual households (% change since 2000)
Likely homosexual households - Lesbian couples (%)
Likely homosexual households - Lesbian couples (% change since 2000)
Likely homosexual households - Gay men (%)
Likely homosexual households - Gay men (% change since 2000)
Cost of living index
Median gross rent ($)
Median contract rent ($)
Median monthly housing costs ($)
Median house or condo value ($)
Median house or condo value ($ change since 2000)
Mean house or condo value by units in structure - 1, detached ($)
Mean house or condo value by units in structure - 1, attached ($)
Mean house or condo value by units in structure - 2 ($)
Mean house or condo value by units in structure by units in structure - 3 or 4 ($)
Mean house or condo value by units in structure - 5 or more ($)
Mean house or condo value by units in structure - Boat, RV, van, etc. ($)
Mean house or condo value by units in structure - Mobile home ($)
Median house or condo value ($) - White
Median house or condo value ($) - Black or African American
Median house or condo value ($) - Asian
Median house or condo value ($) - Hispanic or Latino
Median house or condo value ($) - American Indian and Alaska Native
Median house or condo value ($) - Multirace
Median house or condo value ($) - Other Race
Median resident age
Resident age diversity
Median resident age - Males
Median resident age - Females
Median resident age - White
Median resident age - Black or African American
Median resident age - Asian
Median resident age - Hispanic or Latino
Median resident age - American Indian and Alaska Native
Median resident age - Multirace
Median resident age - Other Race
Median resident age - Males - White
Median resident age - Males - Black or African American
Median resident age - Males - Asian
Median resident age - Males - Hispanic or Latino
Median resident age - Males - American Indian and Alaska Native
Median resident age - Males - Multirace
Median resident age - Males - Other Race
Median resident age - Females - White
Median resident age - Females - Black or African American
Median resident age - Females - Asian
Median resident age - Females - Hispanic or Latino
Median resident age - Females - American Indian and Alaska Native
Median resident age - Females - Multirace
Median resident age - Females - Other Race
Commute - mean travel time to work (minutes)
Travel time to work - Less than 5 minutes (%)
Travel time to work - Less than 5 minutes (% change since 2000)
Travel time to work - 5 to 9 minutes (%)
Travel time to work - 5 to 9 minutes (% change since 2000)
Travel time to work - 10 to 19 minutes (%)
Travel time to work - 10 to 19 minutes (% change since 2000)
Travel time to work - 20 to 29 minutes (%)
Travel time to work - 20 to 29 minutes (% change since 2000)
Travel time to work - 30 to 39 minutes (%)
Travel time to work - 30 to 39 minutes (% change since 2000)
Travel time to work - 40 to 59 minutes (%)
Travel time to work - 40 to 59 minutes (% change since 2000)
Travel time to work - 60 to 89 minutes (%)
Travel time to work - 60 to 89 minutes (% change since 2000)
Travel time to work - 90 or more minutes (%)
Travel time to work - 90 or more minutes (% change since 2000)
Marital status - Never married (%)
Marital status - Now married (%)
Marital status - Separated (%)
Marital status - Widowed (%)
Marital status - Divorced (%)
Median family income ($)
Median family income (% change since 2000)
Median non-family income ($)
Median non-family income (% change since 2000)
Median per capita income ($)
Median per capita income (% change since 2000)
Median family income ($) - White
Median family income ($) - Black or African American
Median family income ($) - Asian
Median family income ($) - Hispanic or Latino
Median family income ($) - American Indian and Alaska Native
Median family income ($) - Multirace
Median family income ($) - Other Race
Median year house/condo built
Median year apartment built
Year house built - Built 2005 or later (%)
Year house built - Built 2000 to 2004 (%)
Year house built - Built 1990 to 1999 (%)
Year house built - Built 1980 to 1989 (%)
Year house built - Built 1970 to 1979 (%)
Year house built - Built 1960 to 1969 (%)
Year house built - Built 1950 to 1959 (%)
Year house built - Built 1940 to 1949 (%)
Year house built - Built 1939 or earlier (%)
Average household size
Household density (households per square mile)
Average household size - White
Average household size - Black or African American
Average household size - Asian
Average household size - Hispanic or Latino
Average household size - American Indian and Alaska Native
Average household size - Multirace
Average household size - Other Race
Occupied housing units (%)
Vacant housing units (%)
Owner occupied housing units (%)
Renter occupied housing units (%)
Vacancy status - For rent (%)
Vacancy status - For sale only (%)
Vacancy status - Rented or sold, not occupied (%)
Vacancy status - For seasonal, recreational, or occasional use (%)
Vacancy status - For migrant workers (%)
Vacancy status - Other vacant (%)
Residents with income below the poverty level (%)
Residents with income below 50% of the poverty level (%)
Children below poverty level (%)
Poor families by family type - Married-couple family (%)
Poor families by family type - Male, no wife present (%)
Poor families by family type - Female, no husband present (%)
Poverty status for native-born residents (%)
Poverty status for foreign-born residents (%)
Poverty among high school graduates not in families (%)
Poverty among people who did not graduate high school not in families (%)
Residents with income below the poverty level (%) - White
Residents with income below the poverty level (%) - Black or African American
Residents with income below the poverty level (%) - Asian
Residents with income below the poverty level (%) - Hispanic or Latino
Residents with income below the poverty level (%) - American Indian and Alaska Native
Residents with income below the poverty level (%) - Multirace
Residents with income below the poverty level (%) - Other Race
Air pollution - Air Quality Index (AQI)
Air pollution - CO
Air pollution - NO2
Air pollution - SO2
Air pollution - Ozone
Air pollution - PM10
Air pollution - PM25
Air pollution - Pb
Crime - Murders per 100,000 population
Crime - Rapes per 100,000 population
Crime - Robberies per 100,000 population
Crime - Assaults per 100,000 population
Crime - Burglaries per 100,000 population
Crime - Thefts per 100,000 population
Crime - Auto thefts per 100,000 population
Crime - Arson per 100,000 population
Crime - City-data.com crime index
Crime - Violent crime index
Crime - Property crime index
Crime - Murders per 100,000 population (5 year average)
Crime - Rapes per 100,000 population (5 year average)
Crime - Robberies per 100,000 population (5 year average)
Crime - Assaults per 100,000 population (5 year average)
Crime - Burglaries per 100,000 population (5 year average)
Crime - Thefts per 100,000 population (5 year average)
Crime - Auto thefts per 100,000 population (5 year average)
Crime - Arson per 100,000 population (5 year average)
Crime - City-data.com crime index (5 year average)
Crime - Violent crime index (5 year average)
Crime - Property crime index (5 year average)
1996 Presidential Elections Results (%) - Democratic Party (Clinton)
1996 Presidential Elections Results (%) - Republican Party (Dole)
1996 Presidential Elections Results (%) - Other
2000 Presidential Elections Results (%) - Democratic Party (Gore)
2000 Presidential Elections Results (%) - Republican Party (Bush)
2000 Presidential Elections Results (%) - Other
2004 Presidential Elections Results (%) - Democratic Party (Kerry)
2004 Presidential Elections Results (%) - Republican Party (Bush)
2004 Presidential Elections Results (%) - Other
2008 Presidential Elections Results (%) - Democratic Party (Obama)
2008 Presidential Elections Results (%) - Republican Party (McCain)
2008 Presidential Elections Results (%) - Other
2012 Presidential Elections Results (%) - Democratic Party (Obama)
2012 Presidential Elections Results (%) - Republican Party (Romney)
2012 Presidential Elections Results (%) - Other
2016 Presidential Elections Results (%) - Democratic Party (Clinton)
2016 Presidential Elections Results (%) - Republican Party (Trump)
2016 Presidential Elections Results (%) - Other
2020 Presidential Elections Results (%) - Democratic Party (Biden)
2020 Presidential Elections Results (%) - Republican Party (Trump)
2020 Presidential Elections Results (%) - Other
Ancestries Reported - Arab (%)
Ancestries Reported - Czech (%)
Ancestries Reported - Danish (%)
Ancestries Reported - Dutch (%)
Ancestries Reported - English (%)
Ancestries Reported - French (%)
Ancestries Reported - French Canadian (%)
Ancestries Reported - German (%)
Ancestries Reported - Greek (%)
Ancestries Reported - Hungarian (%)
Ancestries Reported - Irish (%)
Ancestries Reported - Italian (%)
Ancestries Reported - Lithuanian (%)
Ancestries Reported - Norwegian (%)
Ancestries Reported - Polish (%)
Ancestries Reported - Portuguese (%)
Ancestries Reported - Russian (%)
Ancestries Reported - Scotch-Irish (%)
Ancestries Reported - Scottish (%)
Ancestries Reported - Slovak (%)
Ancestries Reported - Subsaharan African (%)
Ancestries Reported - Swedish (%)
Ancestries Reported - Swiss (%)
Ancestries Reported - Ukrainian (%)
Ancestries Reported - United States (%)
Ancestries Reported - Welsh (%)
Ancestries Reported - West Indian (%)
Ancestries Reported - Other (%)
Educational Attainment - No schooling completed (%)
Educational Attainment - Less than high school (%)
Educational Attainment - High school or equivalent (%)
Educational Attainment - Less than 1 year of college (%)
Educational Attainment - 1 or more years of college (%)
Educational Attainment - Associate degree (%)
Educational Attainment - Bachelor's degree (%)
Educational Attainment - Master's degree (%)
Educational Attainment - Professional school degree (%)
Educational Attainment - Doctorate degree (%)
School Enrollment - Nursery, preschool (%)
School Enrollment - Kindergarten (%)
School Enrollment - Grade 1 to 4 (%)
School Enrollment - Grade 5 to 8 (%)
School Enrollment - Grade 9 to 12 (%)
School Enrollment - College undergrad (%)
School Enrollment - Graduate or professional (%)
School Enrollment - Not enrolled in school (%)
School enrollment - Public schools (%)
School enrollment - Private schools (%)
School enrollment - Not enrolled (%)
Median number of rooms in houses and condos
Median number of rooms in apartments
Housing units lacking complete plumbing facilities (%)
Housing units lacking complete kitchen facilities (%)
Density of houses
Urban houses (%)
Rural houses (%)
Households with people 60 years and over (%)
Households with people 65 years and over (%)
Households with people 75 years and over (%)
Households with one or more nonrelatives (%)
Households with no nonrelatives (%)
Population in households (%)
Family households (%)
Nonfamily households (%)
Population in families (%)
Family households with own children (%)
Median number of bedrooms in owner occupied houses
Mean number of bedrooms in owner occupied houses
Median number of bedrooms in renter occupied houses
Mean number of bedrooms in renter occupied houses
Median number of vehichles in owner occupied houses
Mean number of vehichles in owner occupied houses
Median number of vehichles in renter occupied houses
Mean number of vehichles in renter occupied houses
Mortgage status - with mortgage (%)
Mortgage status - with second mortgage (%)
Mortgage status - with home equity loan (%)
Mortgage status - with both second mortgage and home equity loan (%)
Mortgage status - without a mortgage (%)
Average family size
Average family size - White
Average family size - Black or African American
Average family size - Asian
Average family size - Hispanic or Latino
Average family size - American Indian and Alaska Native
Average family size - Multirace
Average family size - Other Race
Geographical mobility - Same house 1 year ago (%)
Geographical mobility - Moved within same county (%)
Geographical mobility - Moved from different county within same state (%)
Geographical mobility - Moved from different state (%)
Geographical mobility - Moved from abroad (%)
Place of birth - Born in state of residence (%)
Place of birth - Born in other state (%)
Place of birth - Native, outside of US (%)
Place of birth - Foreign born (%)
Housing units in structures - 1, detached (%)
Housing units in structures - 1, attached (%)
Housing units in structures - 2 (%)
Housing units in structures - 3 or 4 (%)
Housing units in structures - 5 to 9 (%)
Housing units in structures - 10 to 19 (%)
Housing units in structures - 20 to 49 (%)
Housing units in structures - 50 or more (%)
Housing units in structures - Mobile home (%)
Housing units in structures - Boat, RV, van, etc. (%)
House/condo owner moved in on average (years ago)
Renter moved in on average (years ago)
Year householder moved into unit - Moved in 1999 to March 2000 (%)
Year householder moved into unit - Moved in 1995 to 1998 (%)
Year householder moved into unit - Moved in 1990 to 1994 (%)
Year householder moved into unit - Moved in 1980 to 1989 (%)
Year householder moved into unit - Moved in 1970 to 1979 (%)
Year householder moved into unit - Moved in 1969 or earlier (%)
Means of transportation to work - Drove car alone (%)
Means of transportation to work - Carpooled (%)
Means of transportation to work - Public transportation (%)
Means of transportation to work - Bus or trolley bus (%)
Means of transportation to work - Streetcar or trolley car (%)
Means of transportation to work - Subway or elevated (%)
Means of transportation to work - Railroad (%)
Means of transportation to work - Ferryboat (%)
Means of transportation to work - Taxicab (%)
Means of transportation to work - Motorcycle (%)
Means of transportation to work - Bicycle (%)
Means of transportation to work - Walked (%)
Means of transportation to work - Other means (%)
Working at home (%)
Industry diversity
Most Common Industries - Agriculture, forestry, fishing and hunting, and mining (%)
Most Common Industries - Agriculture, forestry, fishing and hunting (%)
Most Common Industries - Mining, quarrying, and oil and gas extraction (%)
Most Common Industries - Construction (%)
Most Common Industries - Manufacturing (%)
Most Common Industries - Wholesale trade (%)
Most Common Industries - Retail trade (%)
Most Common Industries - Transportation and warehousing, and utilities (%)
Most Common Industries - Transportation and warehousing (%)
Most Common Industries - Utilities (%)
Most Common Industries - Information (%)
Most Common Industries - Finance and insurance, and real estate and rental and leasing (%)
Most Common Industries - Finance and insurance (%)
Most Common Industries - Real estate and rental and leasing (%)
Most Common Industries - Professional, scientific, and management, and administrative and waste management services (%)
Most Common Industries - Professional, scientific, and technical services (%)
Most Common Industries - Management of companies and enterprises (%)
Most Common Industries - Administrative and support and waste management services (%)
Most Common Industries - Educational services, and health care and social assistance (%)
Most Common Industries - Educational services (%)
Most Common Industries - Health care and social assistance (%)
Most Common Industries - Arts, entertainment, and recreation, and accommodation and food services (%)
Most Common Industries - Arts, entertainment, and recreation (%)
Most Common Industries - Accommodation and food services (%)
Most Common Industries - Other services, except public administration (%)
Most Common Industries - Public administration (%)
Occupation diversity
Most Common Occupations - Management, business, science, and arts occupations (%)
Most Common Occupations - Management, business, and financial occupations (%)
Most Common Occupations - Management occupations (%)
Most Common Occupations - Business and financial operations occupations (%)
Most Common Occupations - Computer, engineering, and science occupations (%)
Most Common Occupations - Computer and mathematical occupations (%)
Most Common Occupations - Architecture and engineering occupations (%)
Most Common Occupations - Life, physical, and social science occupations (%)
Most Common Occupations - Education, legal, community service, arts, and media occupations (%)
Most Common Occupations - Community and social service occupations (%)
Most Common Occupations - Legal occupations (%)
Most Common Occupations - Education, training, and library occupations (%)
Most Common Occupations - Arts, design, entertainment, sports, and media occupations (%)
Most Common Occupations - Healthcare practitioners and technical occupations (%)
Most Common Occupations - Health diagnosing and treating practitioners and other technical occupations (%)
Most Common Occupations - Health technologists and technicians (%)
Most Common Occupations - Service occupations (%)
Most Common Occupations - Healthcare support occupations (%)
Most Common Occupations - Protective service occupations (%)
Most Common Occupations - Fire fighting and prevention, and other protective service workers including supervisors (%)
Most Common Occupations - Law enforcement workers including supervisors (%)
Most Common Occupations - Food preparation and serving related occupations (%)
Most Common Occupations - Building and grounds cleaning and maintenance occupations (%)
Most Common Occupations - Personal care and service occupations (%)
Most Common Occupations - Sales and office occupations (%)
Most Common Occupations - Sales and related occupations (%)
Most Common Occupations - Office and administrative support occupations (%)
Most Common Occupations - Natural resources, construction, and maintenance occupations (%)
Most Common Occupations - Farming, fishing, and forestry occupations (%)
Most Common Occupations - Construction and extraction occupations (%)
Most Common Occupations - Installation, maintenance, and repair occupations (%)
Most Common Occupations - Production, transportation, and material moving occupations (%)
Most Common Occupations - Production occupations (%)
Most Common Occupations - Transportation occupations (%)
Most Common Occupations - Material moving occupations (%)
People in Group quarters - Institutionalized population (%)
People in Group quarters - Correctional institutions (%)
People in Group quarters - Federal prisons and detention centers (%)
People in Group quarters - Halfway houses (%)
People in Group quarters - Local jails and other confinement facilities (including police lockups) (%)
People in Group quarters - Military disciplinary barracks (%)
People in Group quarters - State prisons (%)
People in Group quarters - Other types of correctional institutions (%)
People in Group quarters - Nursing homes (%)
People in Group quarters - Hospitals/wards, hospices, and schools for the handicapped (%)
People in Group quarters - Hospitals/wards and hospices for chronically ill (%)
People in Group quarters - Hospices or homes for chronically ill (%)
People in Group quarters - Military hospitals or wards for chronically ill (%)
People in Group quarters - Other hospitals or wards for chronically ill (%)
People in Group quarters - Hospitals or wards for drug/alcohol abuse (%)
People in Group quarters - Mental (Psychiatric) hospitals or wards (%)
People in Group quarters - Schools, hospitals, or wards for the mentally retarded (%)
People in Group quarters - Schools, hospitals, or wards for the physically handicapped (%)
People in Group quarters - Institutions for the deaf (%)
People in Group quarters - Institutions for the blind (%)
People in Group quarters - Orthopedic wards and institutions for the physically handicapped (%)
People in Group quarters - Wards in general hospitals for patients who have no usual home elsewhere (%)
People in Group quarters - Wards in military hospitals for patients who have no usual home elsewhere (%)
People in Group quarters - Juvenile institutions (%)
People in Group quarters - Long-term care (%)
People in Group quarters - Homes for abused, dependent, and neglected children (%)
People in Group quarters - Residential treatment centers for emotionally disturbed children (%)
People in Group quarters - Training schools for juvenile delinquents (%)
People in Group quarters - Short-term care, detention or diagnostic centers for delinquent children (%)
People in Group quarters - Type of juvenile institution unknown (%)
People in Group quarters - Noninstitutionalized population (%)
People in Group quarters - College dormitories (includes college quarters off campus) (%)
People in Group quarters - Military quarters (%)
People in Group quarters - On base (%)
People in Group quarters - Barracks, unaccompanied personnel housing (UPH), (Enlisted/Officer), ;and similar group living quarters for military personnel (%)
People in Group quarters - Transient quarters for temporary residents (%)
People in Group quarters - Military ships (%)
People in Group quarters - Group homes (%)
People in Group quarters - Homes or halfway houses for drug/alcohol abuse (%)
People in Group quarters - Homes for the mentally ill (%)
People in Group quarters - Homes for the mentally retarded (%)
People in Group quarters - Homes for the physically handicapped (%)
People in Group quarters - Other group homes (%)
People in Group quarters - Religious group quarters (%)
People in Group quarters - Dormitories (%)
People in Group quarters - Agriculture workers' dormitories on farms (%)
People in Group quarters - Job Corps and vocational training facilities (%)
People in Group quarters - Other workers' dormitories (%)
People in Group quarters - Crews of maritime vessels (%)
People in Group quarters - Other nonhousehold living situations (%)
People in Group quarters - Other noninstitutional group quarters (%)
Residents speaking English at home (%)
Residents speaking English at home - Born in the United States (%)
Residents speaking English at home - Native, born elsewhere (%)
Residents speaking English at home - Foreign born (%)
Residents speaking Spanish at home (%)
Residents speaking Spanish at home - Born in the United States (%)
Residents speaking Spanish at home - Native, born elsewhere (%)
Residents speaking Spanish at home - Foreign born (%)
Residents speaking other language at home (%)
Residents speaking other language at home - Born in the United States (%)
Residents speaking other language at home - Native, born elsewhere (%)
Residents speaking other language at home - Foreign born (%)
Class of Workers - Employee of private company (%)
Class of Workers - Self-employed in own incorporated business (%)
Class of Workers - Private not-for-profit wage and salary workers (%)
Class of Workers - Local government workers (%)
Class of Workers - State government workers (%)
Class of Workers - Federal government workers (%)
Class of Workers - Self-employed workers in own not incorporated business and Unpaid family workers (%)
House heating fuel used in houses and condos - Utility gas (%)
House heating fuel used in houses and condos - Bottled, tank, or LP gas (%)
House heating fuel used in houses and condos - Electricity (%)
House heating fuel used in houses and condos - Fuel oil, kerosene, etc. (%)
House heating fuel used in houses and condos - Coal or coke (%)
House heating fuel used in houses and condos - Wood (%)
House heating fuel used in houses and condos - Solar energy (%)
House heating fuel used in houses and condos - Other fuel (%)
House heating fuel used in houses and condos - No fuel used (%)
House heating fuel used in apartments - Utility gas (%)
House heating fuel used in apartments - Bottled, tank, or LP gas (%)
House heating fuel used in apartments - Electricity (%)
House heating fuel used in apartments - Fuel oil, kerosene, etc. (%)
House heating fuel used in apartments - Coal or coke (%)
House heating fuel used in apartments - Wood (%)
House heating fuel used in apartments - Solar energy (%)
House heating fuel used in apartments - Other fuel (%)
House heating fuel used in apartments - No fuel used (%)
Armed forces status - In Armed Forces (%)
Armed forces status - Civilian (%)
Armed forces status - Civilian - Veteran (%)
Armed forces status - Civilian - Nonveteran (%)
Fatal accidents locations in years 2005-2021
Fatal accidents locations in 2005
Fatal accidents locations in 2006
Fatal accidents locations in 2007
Fatal accidents locations in 2008
Fatal accidents locations in 2009
Fatal accidents locations in 2010
Fatal accidents locations in 2011
Fatal accidents locations in 2012
Fatal accidents locations in 2013
Fatal accidents locations in 2014
Fatal accidents locations in 2015
Fatal accidents locations in 2016
Fatal accidents locations in 2017
Fatal accidents locations in 2018
Fatal accidents locations in 2019
Fatal accidents locations in 2020
Fatal accidents locations in 2021
Alcohol use - People drinking some alcohol every month (%)
Alcohol use - People not drinking at all (%)
Alcohol use - Average days/month drinking alcohol
Alcohol use - Average drinks/week
Alcohol use - Average days/year people drink much
Audiometry - Average condition of hearing (%)
Audiometry - People that can hear a whisper from across a quiet room (%)
Audiometry - People that can hear normal voice from across a quiet room (%)
Audiometry - Ears ringing, roaring, buzzing (%)
Audiometry - Had a job exposure to loud noise (%)
Audiometry - Had off-work exposure to loud noise (%)
Blood Pressure & Cholesterol - Has high blood pressure (%)
Blood Pressure & Cholesterol - Checking blood pressure at home (%)
Blood Pressure & Cholesterol - Frequently checking blood cholesterol (%)
Blood Pressure & Cholesterol - Has high cholesterol level (%)
Consumer Behavior - Money monthly spent on food at supermarket/grocery store
Consumer Behavior - Money monthly spent on food at other stores
Consumer Behavior - Money monthly spent on eating out
Consumer Behavior - Money monthly spent on carryout/delivered foods
Consumer Behavior - Income spent on food at supermarket/grocery store (%)
Consumer Behavior - Income spent on food at other stores (%)
Consumer Behavior - Income spent on eating out (%)
Consumer Behavior - Income spent on carryout/delivered foods (%)
Current Health Status - General health condition (%)
Current Health Status - Blood donors (%)
Current Health Status - Has blood ever tested for HIV virus (%)
Current Health Status - Left-handed people (%)
Dermatology - People using sunscreen (%)
Diabetes - Diabetics (%)
Diabetes - Had a blood test for high blood sugar (%)
Diabetes - People taking insulin (%)
Diet Behavior & Nutrition - Diet health (%)
Diet Behavior & Nutrition - Milk product consumption (# of products/month)
Diet Behavior & Nutrition - Meals not home prepared (#/week)
Diet Behavior & Nutrition - Meals from fast food or pizza place (#/week)
Diet Behavior & Nutrition - Ready-to-eat foods (#/month)
Diet Behavior & Nutrition - Frozen meals/pizza (#/month)
Drug Use - People that ever used marijuana or hashish (%)
Drug Use - Ever used hard drugs (%)
Drug Use - Ever used any form of cocaine (%)
Drug Use - Ever used heroin (%)
Drug Use - Ever used methamphetamine (%)
Health Insurance - People covered by health insurance (%)
Kidney Conditions-Urology - Avg. # of times urinating at night
Medical Conditions - People with asthma (%)
Medical Conditions - People with anemia (%)
Medical Conditions - People with psoriasis (%)
Medical Conditions - People with overweight (%)
Medical Conditions - Elderly people having difficulties in thinking or remembering (%)
Medical Conditions - People who ever received blood transfusion (%)
Medical Conditions - People having trouble seeing even with glass/contacts (%)
Medical Conditions - People with arthritis (%)
Medical Conditions - People with gout (%)
Medical Conditions - People with congestive heart failure (%)
Medical Conditions - People with coronary heart disease (%)
Medical Conditions - People with angina pectoris (%)
Medical Conditions - People who ever had heart attack (%)
Medical Conditions - People who ever had stroke (%)
Medical Conditions - People with emphysema (%)
Medical Conditions - People with thyroid problem (%)
Medical Conditions - People with chronic bronchitis (%)
Medical Conditions - People with any liver condition (%)
Medical Conditions - People who ever had cancer or malignancy (%)
Mental Health - People who have little interest in doing things (%)
Mental Health - People feeling down, depressed, or hopeless (%)
Mental Health - People who have trouble sleeping or sleeping too much (%)
Mental Health - People feeling tired or having little energy (%)
Mental Health - People with poor appetite or overeating (%)
Mental Health - People feeling bad about themself (%)
Mental Health - People who have trouble concentrating on things (%)
Mental Health - People moving or speaking slowly or too fast (%)
Mental Health - People having thoughts they would be better off dead (%)
Oral Health - Average years since last visit a dentist
Oral Health - People embarrassed because of mouth (%)
Oral Health - People with gum disease (%)
Oral Health - General health of teeth and gums (%)
Oral Health - Average days a week using dental floss/device
Oral Health - Average days a week using mouthwash for dental problem
Oral Health - Average number of teeth
Pesticide Use - Households using pesticides to control insects (%)
Pesticide Use - Households using pesticides to kill weeds (%)
Physical Activity - People doing vigorous-intensity work activities (%)
Physical Activity - People doing moderate-intensity work activities (%)
Physical Activity - People walking or bicycling (%)
Physical Activity - People doing vigorous-intensity recreational activities (%)
Physical Activity - People doing moderate-intensity recreational activities (%)
Physical Activity - Average hours a day doing sedentary activities
Physical Activity - Average hours a day watching TV or videos
Physical Activity - Average hours a day using computer
Physical Functioning - People having limitations keeping them from working (%)
Physical Functioning - People limited in amount of work they can do (%)
Physical Functioning - People that need special equipment to walk (%)
Physical Functioning - People experiencing confusion/memory problems (%)
Physical Functioning - People requiring special healthcare equipment (%)
Prescription Medications - Average number of prescription medicines taking
Preventive Aspirin Use - Adults 40+ taking low-dose aspirin (%)
Reproductive Health - Vaginal deliveries (%)
Reproductive Health - Cesarean deliveries (%)
Reproductive Health - Deliveries resulted in a live birth (%)
Reproductive Health - Pregnancies resulted in a delivery (%)
Reproductive Health - Women breastfeeding newborns (%)
Reproductive Health - Women that had a hysterectomy (%)
Reproductive Health - Women that had both ovaries removed (%)
Reproductive Health - Women that have ever taken birth control pills (%)
Reproductive Health - Women taking birth control pills (%)
Reproductive Health - Women that have ever used Depo-Provera or injectables (%)
Reproductive Health - Women that have ever used female hormones (%)
Sexual Behavior - People 18+ that ever had sex (vaginal, anal, or oral) (%)
Sexual Behavior - Males 18+ that ever had vaginal sex with a woman (%)
Sexual Behavior - Males 18+ that ever performed oral sex on a woman (%)
Sexual Behavior - Males 18+ that ever had anal sex with a woman (%)
Sexual Behavior - Males 18+ that ever had any sex with a man (%)
Sexual Behavior - Females 18+ that ever had vaginal sex with a man (%)
Sexual Behavior - Females 18+ that ever performed oral sex on a man (%)
Sexual Behavior - Females 18+ that ever had anal sex with a man (%)
Sexual Behavior - Females 18+ that ever had any kind of sex with a woman (%)
Sexual Behavior - Average age people first had sex
Sexual Behavior - Average number of female sex partners in lifetime (males 18+)
Sexual Behavior - Average number of female vaginal sex partners in lifetime (males 18+)
Sexual Behavior - Average age people first performed oral sex on a woman (18+)
Sexual Behavior - Average number of woman performed oral sex on in lifetime (18+)
Sexual Behavior - Average number of male sex partners in lifetime (males 18+)
Sexual Behavior - Average number of male anal sex partners in lifetime (males 18+)
Sexual Behavior - Average age people first performed oral sex on a man (18+)
Sexual Behavior - Average number of male oral sex partners in lifetime (18+)
Sexual Behavior - People using protection when performing oral sex (%)
Sexual Behavior - Average number of times people have vaginal or anal sex a year
Sexual Behavior - People having sex without condom (%)
Sexual Behavior - Average number of male sex partners in lifetime (females 18+)
Sexual Behavior - Average number of male vaginal sex partners in lifetime (females 18+)
Sexual Behavior - Average number of female sex partners in lifetime (females 18+)
Sexual Behavior - Circumcised males 18+ (%)
Sleep Disorders - Average hours sleeping at night
Sleep Disorders - People that has trouble sleeping (%)
Smoking-Cigarette Use - People smoking cigarettes (%)
Taste & Smell - People 40+ having problems with smell (%)
Taste & Smell - People 40+ having problems with taste (%)
Taste & Smell - People 40+ that ever had wisdom teeth removed (%)
Taste & Smell - People 40+ that ever had tonsils teeth removed (%)
Taste & Smell - People 40+ that ever had a loss of consciousness because of a head injury (%)
Taste & Smell - People 40+ that ever had a broken nose or other serious injury to face or skull (%)
Taste & Smell - People 40+ that ever had two or more sinus infections (%)
Weight - Average height (inches)
Weight - Average weight (pounds)
Weight - Average BMI
Weight - People that are obese (%)
Weight - People that ever were obese (%)
Weight - People trying to lose weight (%)
100%
urban population.
Estimated median house/condo value in 2022: $106,337
44123:
$106,337Ohio:
$204,100
According to our research of Ohio and other state lists, there were 15 registered sex offenders living in 44123 zip code as of April 27, 2024 . The ratio of all residents to sex offenders in zip code 44123 is 1,101 to 1.The ratio of registered sex offenders to all residents in this zip code is lower than the state average.
Median resident age: This zip code:
38.5 yearsOhio median age:
39.9 years
Average household size: This zip code:
2.2 peopleOhio:
2.4 people
Averages for the 2020 tax year for zip code 44123, filed in 2021:
Average Adjusted Gross Income (AGI) in 2020: $39,471 (Individual Income Tax Returns) Here:
$39,471State:
$67,288
Salary/wage: $35,696 (reported on 86.1% of returns )Here:
$35,696State:
$55,628
(% of AGI for various income ranges: 1213.1% for AGIs below $25k , 3747.8% for AGIs $25k-50k , 6734.7% for AGIs $50k-75k , 10282.0% for AGIs $75k-100k , 16520.8% for AGIs $100k-200k ) Taxable interest for individuals: $1,051 (reported on 12.0% of returns )This zip code:
$1,051Ohio:
$1,518
(% of AGI for various income ranges: 6.5% for AGIs below $25k , 10.5% for AGIs $25k-50k , 28.9% for AGIs $50k-75k , 45.3% for AGIs $75k-100k , 84.8% for AGIs $100k-200k ) Ordinary dividends: $2,851 (reported on 8.4% of returns )(% of AGI for various income ranges: 9.2% for AGIs below $25k , 10.8% for AGIs $25k-50k , 37.3% for AGIs $50k-75k , 134.0% for AGIs $75k-100k , 245.2% for AGIs $100k-200k ) Net capital gain/loss in AGI: +$4,185 (reported on 6.6% of returns )Here:
+$4,185State:
+$18,919
(% of AGI for various income ranges: 1.9% for AGIs below $25k , 10.3% for AGIs $25k-50k , 25.8% for AGIs $50k-75k , 113.3% for AGIs $75k-100k , 443.2% for AGIs $100k-200k ) Profit/loss from business: +$3,238 (reported on 13.4% of returns )Here:
+$3,238State:
+$13,744
(% of AGI for various income ranges: 18.6% for AGIs below $25k , 9.7% for AGIs $25k-50k , 55.2% for AGIs $50k-75k , 156.7% for AGIs $75k-100k , 867.2% for AGIs $100k-200k ) Taxable individual retirement arrangement distribution: $13,247 (reported on 5.2% of returns )44123:
$13,247Ohio:
$18,876
(% of AGI for various income ranges: 33.1% for AGIs below $25k , 47.1% for AGIs $25k-50k , 163.1% for AGIs $50k-75k , 292.3% for AGIs $75k-100k , 683.2% for AGIs $100k-200k ) Total itemized deductions: $24,897 (reported on 3.4% of returns )Here:
$24,897State:
$33,869
(% of AGI for various income ranges: 18.5% for AGIs below $25k , 75.8% for AGIs $25k-50k , 249.2% for AGIs $50k-75k , 316.3% for AGIs $75k-100k , 808.8% for AGIs $100k-200k ) Charity contributions: $6,448 (reported on 2.8% of returns )(% of AGI for various income ranges: 19.5% for AGIs $25k-50k , 57.0% for AGIs $50k-75k , 61.0% for AGIs $75k-100k , 162.8% for AGIs $100k-200k ) Taxes paid: $5,867 (reported on 3.3% of returns )(% of AGI for various income ranges: 2.3% for AGIs below $25k , 11.7% for AGIs $25k-50k , 58.8% for AGIs $50k-75k , 98.3% for AGIs $75k-100k , 226.8% for AGIs $100k-200k ) Earned income credit: $2,442 (reported on 26.3% of returns )(% of AGI for various income ranges: 124.9% for AGIs below $25k , 83.9% for AGIs $25k-50k ) Percentage of individuals using paid preparers for their 2020 taxes: 92.6%(% for various income ranges: 92.9% for AGIs below $25k , 93.3% for AGIs $25k-50k , 91.1% for AGIs $50k-75k , 91.5% for AGIs $75k-100k , 88.6% for AGIs $100k-200k , 100.0% for AGIs over 200k )
Averages for the 2012 tax year for zip code 44123, filed in 2013:
Average Adjusted Gross Income (AGI) in 2012: $36,204 (Individual Income Tax Returns) Here:
$36,204State:
$54,926
Salary/wage: $33,769 (reported on 86.1% of returns )Here:
$33,769State:
$45,869
(% of AGI for various income ranges: 76.2% for AGIs below $25k , 85.5% for AGIs $25k-50k , 81.9% for AGIs $50k-75k , 81.5% for AGIs $75k-100k , 77.5% for AGIs $100k-200k , 55.4% for AGIs over 200k ) Taxable interest for individuals: $1,113 (reported on 20.1% of returns )This zip code:
$1,113Ohio:
$1,297
(% of AGI for various income ranges: 0.8% for AGIs below $25k , 0.5% for AGIs $25k-50k , 0.5% for AGIs $50k-75k , 0.3% for AGIs $75k-100k , 0.4% for AGIs $100k-200k , 3.0% for AGIs over 200k ) Ordinary dividends: $2,902 (reported on 11.4% of returns )(% of AGI for various income ranges: 1.0% for AGIs below $25k , 0.5% for AGIs $25k-50k , 1.0% for AGIs $50k-75k , 0.7% for AGIs $75k-100k , 1.4% for AGIs $100k-200k , 2.6% for AGIs over 200k ) Net capital gain/loss in AGI: +$1,160 (reported on 7.0% of returns )Here:
+$1,160State:
+$11,232
(% of AGI for various income ranges: 0.1% for AGIs $25k-50k , 0.1% for AGIs $75k-100k , 0.9% for AGIs $100k-200k , 0.7% for AGIs over 200k ) Profit/loss from business: +$6,804 (reported on 11.2% of returns )Here:
+$6,804State:
+$12,773
(% of AGI for various income ranges: 6.9% for AGIs below $25k , 0.9% for AGIs $25k-50k , 1.0% for AGIs $50k-75k , 1.9% for AGIs $75k-100k , 1.9% for AGIs $100k-200k ) Taxable individual retirement arrangement distribution: $11,413 (reported on 7.8% of returns )44123:
$11,413Ohio:
$14,511
(% of AGI for various income ranges: 2.8% for AGIs below $25k , 1.7% for AGIs $25k-50k , 2.4% for AGIs $50k-75k , 3.0% for AGIs $75k-100k , 4.1% for AGIs $100k-200k ) Total itemized deductions: $15,761 (23% of AGI, reported on 24.2% of returns )Here:
$15,761State:
$21,278
Here:
23.3% of AGIState:
18.8% of AGI
(% of AGI for various income ranges: 6.2% for AGIs below $25k , 8.0% for AGIs $25k-50k , 12.8% for AGIs $50k-75k , 12.7% for AGIs $75k-100k , 14.0% for AGIs $100k-200k , 15.9% for AGIs over 200k ) Charity contributions: $2,418 (reported on 18.6% of returns )(% of AGI for various income ranges: 0.5% for AGIs below $25k , 1.0% for AGIs $25k-50k , 1.7% for AGIs $50k-75k , 1.7% for AGIs $75k-100k , 1.8% for AGIs $100k-200k , 0.8% for AGIs over 200k ) Taxes paid: $6,653 (reported on 24.1% of returns )(% of AGI for various income ranges: 1.5% for AGIs below $25k , 2.8% for AGIs $25k-50k , 5.2% for AGIs $50k-75k , 6.3% for AGIs $75k-100k , 7.7% for AGIs $100k-200k , 7.4% for AGIs over 200k ) Earned income credit: $2,486 (reported on 27.5% of returns )(% of AGI for various income ranges: 9.4% for AGIs below $25k , 1.2% for AGIs $25k-50k ) Percentage of individuals using paid preparers for their 2012 taxes: 43.3%(% for various income ranges: 39.6% for AGIs below $25k , 42.0% for AGIs $25k-50k , 50.0% for AGIs $50k-75k , 56.2% for AGIs $75k-100k , 52.9% for AGIs $100k-200k , 75.0% for AGIs over 200k )
Averages for the 2004 tax year for zip code 44123, filed in 2005:
Average Adjusted Gross Income (AGI) in 2004: $33,484 (Individual Income Tax Returns) Here:
$33,484State:
$44,480
Salary/wage: $32,582 (reported on 86.1% of returns )Here:
$32,582State:
$39,198
(% of AGI for various income ranges: 78.7% for AGIs below $10k , 77.7% for AGIs $10k-25k , 87.9% for AGIs $25k-50k , 86.2% for AGIs $50k-75k , 88.6% for AGIs $75k-100k , 69.1% for AGIs over 100k ) Taxable interest for individuals: $1,575 (reported on 36.1% of returns )This zip code:
$1,575Ohio:
$1,532
(% of AGI for various income ranges: 4.6% for AGIs below $10k , 2.6% for AGIs $10k-25k , 1.3% for AGIs $25k-50k , 1.4% for AGIs $50k-75k , 0.9% for AGIs $75k-100k , 2.7% for AGIs over 100k ) Taxable dividends: $1,829 (reported on 18.3% of returns )(% of AGI for various income ranges: 2.1% for AGIs below $10k , 1.3% for AGIs $10k-25k , 0.7% for AGIs $25k-50k , 0.8% for AGIs $50k-75k , 0.8% for AGIs $75k-100k , 2.2% for AGIs over 100k ) Net capital gain/loss: +$2,504 (reported on 11.7% of returns )Here:
+$2,504State:
+$8,582
(% of AGI for various income ranges: -0.8% for AGIs below $10k , 0.4% for AGIs $10k-25k , 0.3% for AGIs $25k-50k , 0.5% for AGIs $50k-75k , 0.5% for AGIs $75k-100k , 5.0% for AGIs over 100k ) Profit/loss from business: +$5,898 (reported on 8.8% of returns )Here:
+$5,898State:
+$10,813
(% of AGI for various income ranges: 7.5% for AGIs below $10k , 2.9% for AGIs $10k-25k , 0.9% for AGIs $25k-50k , 0.9% for AGIs $50k-75k , 0.4% for AGIs $75k-100k , 3.2% for AGIs over 100k ) IRA payment deduction: $2,562 (reported on 1.7% of returns )(% of AGI for various income ranges: 0.1% for AGIs $10k-25k , 0.2% for AGIs $25k-50k , 0.1% for AGIs $50k-75k , 0.1% for AGIs over 100k ) Total itemized deductions: $12,784 (24% of AGI, reported on 32.4% of returns )Here:
$12,784State:
$17,503
Here:
23.7% of AGIState:
20.8% of AGI
(% of AGI for various income ranges: 8.4% for AGIs below $10k , 7.5% for AGIs $10k-25k , 11.8% for AGIs $25k-50k , 14.9% for AGIs $50k-75k , 14.7% for AGIs $75k-100k , 13.7% for AGIs over 100k ) Charity contributions deductions: $1,908 (3% of AGI, reported on 26.7% of returns )Here:
3.4% of AGIState:
3.4% of AGI
(% of AGI for various income ranges: 0.5% for AGIs below $10k , 0.7% for AGIs $10k-25k , 1.4% for AGIs $25k-50k , 1.9% for AGIs $50k-75k , 1.7% for AGIs $75k-100k , 2.2% for AGIs over 100k ) Total tax: $3,824 (reported on 74.8% of returns )(% of AGI for various income ranges: 2.1% for AGIs below $10k , 3.8% for AGIs $10k-25k , 7.2% for AGIs $25k-50k , 9.6% for AGIs $50k-75k , 10.7% for AGIs $75k-100k , 16.2% for AGIs over 100k ) Earned income credit: $1,662 (reported on 17.4% of returns )Percentage of individuals using paid preparers for their 2004 taxes: 51.1%(% for various income ranges: 45.4% for AGIs below $10k , 54.4% for AGIs $10k-25k , 50.9% for AGIs $25k-50k , 51.4% for AGIs $50k-75k , 52.1% for AGIs $75k-100k , 53.9% for AGIs over 100k )
Estimated median household income in 2022: This zip code:
$48,693Ohio:
$65,720
Nearest zip codes: 44132 ,
44119 ,
44117 ,
44110 ,
44092 ,
44143 .
Euclid Zip Code Map
Percentage of family households: This zip code:
37.2%Ohio:
43.3%
Percentage of households with unmarried partners: This zip code:
4.5%Ohio:
44.6%
Likely homosexual households (counted as self-reported same-sex unmarried-partner households)
Lesbian couples: 0.1% of all households Gay men: 0.3% of all households
Household received Food Stamps/SNAP in the past 12 months: 1,905Household did not receive Food Stamps/SNAP in the past 12 months: 6,706
Women who had a birth in the past 12 months: 337 (96 now married , 234 unmarried) Women who did not have a birth in the past 12 months: 4,325 (962 now married , 3,365 unmarried)
Housing units in zip code 44123 with a mortgage: 2,380 (356
second mortgage , 4
home equity loan , 198
both second mortgage and home equity loan )
Houses without a mortgage: 146
Median monthly owner costs for units with a mortgage: $1,130
Median monthly owner costs for units without a mortgage: $450
Residents with income below the poverty level in 2022:
This zip code:
18.3%Whole state:
13.4%
Residents with income below 50% of the poverty level in 2022:
This zip code:
10.3%Whole state:
7.0%
Median number of rooms in houses and condos: Median number of rooms in apartments: Notable locations in this zip code not listed on our city pages
Click to draw/clear zip code borders Notable locations in zip code 44123: (A) , Parkside Wastewater Treatment Plant (B) , Euclid Police Department (C) , Euclid Fire Department Station 1 (D) , Euclid Hunger Center (E) , Shore Civic Centre (F) , Knuth Community Center (G) , Euclid City Hall (H) , Euclid Public Library (I) . Display/hide their locations on the map
Shopping Centers: (1) , Lake Shore Shopping Center (2) . Display/hide their locations on the map
Churches in zip code 44123 include: (A) , Saint Roberts Catholic Church (B) , Church of the Epiphany (C) , Boulevard Presbyterian Church of Euclid (D) , East Shore United Methodist Church (E) . Display/hide their locations on the map
Parks in zip code 44123 include: (1) , Sims Park (2) , Euclid Park (3) . Display/hide their locations on the map
Year house built (houses)
10 2020 or later0 2010 to 201927 2000 to 2009203 1990 to 1999115 1980 to 19891,102 1970 to 19791,442 1960 to 19692,621 1950 to 19591,482 1940 to 19492,178 1939 or earlier
Zip code 44123 household income distribution in 2022 598 Less than $10,000359 $10,000 to $14,999642 $15,000 to $19,999408 $20,000 to $24,999566 $25,000 to $29,999389 $30,000 to $34,999291 $35,000 to $39,999660 $40,000 to $44,999417 $45,000 to $49,999920 $50,000 to $59,999951 $60,000 to $74,9991,097 $75,000 to $99,999353 $100,000 to $124,999387 $125,000 to $149,999318 $150,000 to $199,999237 $200,000 or moreEstimate of home value of owner-occupied houses/condos in 2022 in zip code 44123 17 Less than $10,00085 $10,000 to $14,9998 $15,000 to $19,99974 $20,000 to $24,999131 $25,000 to $29,99947 $30,000 to $34,99911 $35,000 to $39,999190 $40,000 to $49,999178 $50,000 to $59,999269 $60,000 to $69,999261 $70,000 to $79,999295 $80,000 to $89,999285 $90,000 to $99,999627 $100,000 to $124,999355 $125,000 to $149,999337 $150,000 to $174,99961 $175,000 to $199,99969 $200,000 to $249,99943 $250,000 to $299,99972 $300,000 to $399,99928 $400,000 to $499,9999 $750,000 to $999,9997 $1,000,000 to $1,499,99910 $2,000,000 or moreRent paid by renters in 2022 in zip code 44123 8 Less than $10015 $150 to $1999 $250 to $29927 $300 to $34910 $350 to $39917 $450 to $49916 $500 to $54995 $550 to $599211 $600 to $649416 $650 to $699600 $700 to $749431 $750 to $799795 $800 to $899587 $900 to $9991,042 $1,000 to $1,24967 $1,250 to $1,499116 $1,500 to $1,9998 $2,000 to $2,49985 No cash rent
Median gross rent in 2022: $986.
Median price asked for vacant for-sale houses and condos in 2022: $102,024.
Estimated median house (or condo) value in 2022 for: White Non-Hispanic householders: $106,701Black or African American householders: $104,394Asian householders: $136,562Some other race householders: $130,493Two or more races householders: $104,758Hispanic or Latino householders: $94,804Estimated median house or condo value in 2022: $106,337
44123:
$106,337Ohio:
$204,100
Lower value quartile - upper value quartile: $70,340 - $146,976
Mean price in 2022: Detached houses: $119,054Here:
$119,054State:
$254,366
Townhouses or other attached units: $35,383Here:
$35,383State:
$225,733
In 2-unit structures: $536,575Here:
$536,575State:
$144,384
In 5-or-more-unit structures: $31,384Here:
$31,384State:
$211,593
Mobile homes: $41,514Here:
$41,514State:
$62,719
Housing units in structures:
One, detached: 5,321One, attached: 719Two: 7213 or 4: 2335 to 9: 36810 to 19: 7720 to 49: 14150 or more: 1,852Mobile homes: 60Unemployment : 6.3%
Means of transportation to work in zip code 44123 70.7% 6,576 Drove a car alone8.5% 795 Carpooled6.7% 628 Bus or trolley bus0.4% 38 Bicycle2.2% 204 Walked0.6% 55 Other means8.8% 817 Worked at homeTravel time to work (commute) in zip code 44123 200 Less than 5 minutes643 5 to 9 minutes1,262 10 to 14 minutes907 15 to 19 minutes1,791 20 to 24 minutes729 25 to 29 minutes1,535 30 to 34 minutes188 35 to 39 minutes218 40 to 44 minutes573 45 to 59 minutes226 60 to 89 minutes102 90 or more minutes
Neighborhoods in zip code 44123: Percentage of zip code residents living and working in this county: 80.1%
Household type by relationship:
Households: 18,684
Male householders: 3,378 (1,742 living alone ), Female householders: 5,222 (1,880 living alone )1,774 spouses (1,751 opposite-sex spouses ), 798 unmarried partners , (695 opposite-sex unmarried partners ), 5,474 children (5,173 natural , 60 adopted , 238 stepchildren ), 761 grandchildren , 147 brothers or sisters , 161 parents , 58 foster children , 501 other relatives , 387 non-relatives In group quarters: 32 (-1 institutionalized population )
Size of family households: 1,892 2-persons , 1,123 3-persons , 656 4-persons , 320 5-persons , 159 6-persons , 27 7-or-more-persons
Size of nonfamily households: 3,620 1-person , 709 2-persons , 94 3-persons , 9 4-persons
1,233 married couples with children. single-parent households (124 men , 1,537 women ).
95.4% of residents of 44123 zip code speak English at home. of residents speak Spanish at home (88% very well, 12% well ).of residents speak other Indo-European language at home (60% very well, 25% well, 11% not well, 4% not at all ).of residents speak Asian or Pacific Island language at home (100% very well ).of residents speak other language at home (78% very well, 22% well ).
Foreign born population: 482 (2.6%)
(35.7%
of them are naturalized citizens )
This zip code:
2.6%Whole state:
5.0%
13% Malaysia 11% Sweden 9% Belarus 9% Ukraine 7% Ecuador 6% Liberia 5% Romania 3% German 2% Slovene 2% Irish 2% African 2% American 1% Croatian 1% Jamaican
Year of entry for the foreign-born population
165 2010 or later 57 2000 to 2009 137 1990 to 1999 155 Before 1990
Facilities with environmental interests located in this zip code:
BP AMOCO CO 22386 * (22311 LAKESHORE AVE in EUCLID, OH)
AIR MINOR (AIRS/AFS) STATE MASTER (Ohio general info) - RCRA-OHD987026382, HAZARDOUS WASTE PROGRAM, -18-5541-905-40, EPCRA STATE MASTER (Ohio general info) - AIR MAJOR Conditionally Exempt Small Quantity Generators, less than 100 kg/month of hazardous waste (Resource Conservation and Recovery Act (tracking hazardous waste)) - notification Business SIC classification: GASOLINE SERVICE STATIONSOrganizations: BP OIL CO (CONTACT/OWNER)
, BP OIL COMPANY (CONTACT/OWNER)
Alternative names: BP AMOCO #22386, BP #04701/22386, BP OIL CO 04701 *, BP OIL CO. #04701, BP OIL CO SITE 04701
BENJAMIN FRANKLIN ELEMENTARY (21331 WILMORE AVE in EUCLID, OH)
(National Center for Education Statistics) - STATE ID-124982 STATE MASTER (Ohio general info) - AIR MAJOR Organizations: EUCLID CITY SD (SCHOOL DISTRICT)
Housing units lacking complete plumbing facilities: 1.7%
Housing units lacking complete kitchen facilities: 2.6%
77.5% Utility gas 20.3% Electricity 0.9% No fuel used 0.8% Bottled, tank, or LP gas
Population in 1990: 18,724.
Place of birth for U.S.-born residents:
This state: 15,442Northeast: 524Midwest: 417South: 1,507West: 239
57% of the 44123 zip code residents lived in the same house 5 years ago.
Out of people who lived in different houses, 70% lived in this county.
Out of people who lived in different counties, 50% lived in Ohio.
90% of the 44123 zip code residents lived in the same house 1 year ago.
Out of people who lived in different houses, 77% moved from this county.
Out of people who lived in different houses, 5% moved from different county within same state.
Out of people who lived in different houses, 10% moved from different state.
Out of people who lived in different houses, 3% moved from abroad.
Private vs. public school enrollment:
Students in private schools in grades 1 to 8 (elementary and middle school): 364
Students in private schools in grades 9 to 12 (high school): 298
Students in private undergraduate colleges: 148
Occupation by median earnings in the past 12 months ($)
124,971 Fire fighting and prevention, and other protective service workers including supervisors 94,930 Legal occupations 85,089 Architecture and engineering occupations 77,843 Computer and mathematical occupations 67,233 Installation, maintenance, and repair occupations 65,710 Health diagnosing and treating practitioners and other technical occupations
Companies with federal contracts located in this zip code:
DISCO CO (895 E 222ND ST in CLEVELAND, OH; small business) in 2 contracts in 2005
$40,097 with Defense Commissary Agency for Kitchen Equipment and Appliances. Signed on 2005-06-13. Completion date: 2005-08-11.
, same as above. Signed on 2005-06-13. Completion date: 2005-08-11.
APS METALS INC (136 E 208TH ST in EUCLID, OH; small business)
$5,728 with Navy for Metal Finishing Equipment. Signed on 2006-05-26. Completion date: 2006-06-12.
Top industries in this zip code by the number of employees in 2005:
Management of Companies and Enterprises: Corporate, Subsidiary, and Regional Managing Offices (500-999 employees: 1 establishment, 1-4 employees: 1 establishment)Accommodation and Food Services: Limited-Service Restaurants (20-49: 3, 10-19: 3, 5-9: 2, 1-4: 6)Accommodation and Food Services: Full-Service Restaurants (20-49: 1, 10-19: 3, 5-9: 3, 1-4: 3)Administrative and Support and Waste Management and Remediation Services: Employment Placement Agencies (50-99: 1)Arts, Entertainment, and Recreation: Fitness and Recreational Sports Centers (20-49: 1, 10-19: 1, 5-9: 1)Professional, Scientific, and Technical Services: Tax Preparation Services (20-49: 1, 10-19: 1, 1-4: 2)Other Services (except Public Administration): Religious Organizations (10-19: 1, 5-9: 3, 1-4: 5)
People in group quarters in 2010:
116 people in other noninstitutional facilities
57 people in local jails and other municipal confinement facilities
People in group quarters in 2000:
39 people in local jails and other confinement facilities (including police lockups)
8 people in homes for the mentally retarded
4 people in religious group quarters
Fatal accident statistics in 2013:
Fatal accident count: 1Vehicles involved in fatal accidents: 1Fatal accidents caused by drunken drivers: 0Fatalities: 1Persons involved in fatal accidents: 1Pedestrians involved in fatal accidents: 1
Fatal accident statistics in 2011:
Fatal accident count: 2Vehicles involved in fatal accidents: 3Fatal accidents caused by drunken drivers: 1Fatalities: 2Persons involved in fatal accidents: 5Pedestrians involved in fatal accidents: 1
Home Mortgage Disclosure Act Aggregated Statistics For Year 2009(Based on 4 full and 8 partial tracts) A) FHA, FSA/RHS & VA B) Conventional C) Refinancings D) Home Improvement Loans E) Loans on Dwellings For 5+ Families F) Non-occupant Loans on Number Average Value Number Average Value Number Average Value Number Average Value Number Average Value Number Average Value
LOANS ORIGINATED 154 $80,140 45 $69,845 219 $96,296 31 $13,629 2 $4,099,180 43 $48,663 APPLICATIONS APPROVED, NOT ACCEPTED 12 $81,329 2 $58,600 22 $100,472 8 $10,614 1 $201,590 4 $59,735 APPLICATIONS DENIED 19 $69,705 20 $51,240 171 $95,667 62 $17,166 0 $0 22 $59,785 APPLICATIONS WITHDRAWN 19 $64,718 8 $43,989 70 $88,555 6 $14,425 0 $0 10 $55,729 FILES CLOSED FOR INCOMPLETENESS 5 $122,034 0 $0 30 $97,035 4 $8,965 0 $0 4 $86,228
Aggregated Statistics For Year 2008(Based on 4 full and 8 partial tracts) A) FHA, FSA/RHS & VA B) Conventional C) Refinancings D) Home Improvement Loans E) Loans on Dwellings For 5+ Families F) Non-occupant Loans on G) Loans On Manufactured Number Average Value Number Average Value Number Average Value Number Average Value Number Average Value Number Average Value Number Average Value
LOANS ORIGINATED 153 $91,110 109 $81,764 159 $98,571 45 $22,920 0 $0 73 $76,782 1 $11,710 APPLICATIONS APPROVED, NOT ACCEPTED 4 $65,358 15 $76,254 25 $108,308 14 $29,041 0 $0 12 $92,364 0 $0 APPLICATIONS DENIED 28 $83,041 43 $69,008 273 $103,229 116 $21,264 0 $0 25 $78,976 3 $8,353 APPLICATIONS WITHDRAWN 16 $88,491 16 $48,461 63 $99,742 5 $85,788 2 $4,199,160 11 $67,360 0 $0 FILES CLOSED FOR INCOMPLETENESS 3 $93,533 8 $77,010 13 $98,355 7 $58,911 0 $0 9 $65,239 0 $0
Aggregated Statistics For Year 2007(Based on 4 full and 8 partial tracts) A) FHA, FSA/RHS & VA B) Conventional C) Refinancings D) Home Improvement Loans E) Loans on Dwellings For 5+ Families F) Non-occupant Loans on G) Loans On Manufactured Number Average Value Number Average Value Number Average Value Number Average Value Number Average Value Number Average Value Number Average Value
LOANS ORIGINATED 69 $113,641 363 $84,544 294 $89,276 82 $21,031 6 $1,248,783 194 $75,253 0 $0 APPLICATIONS APPROVED, NOT ACCEPTED 2 $118,190 89 $71,948 61 $91,093 15 $14,551 0 $0 62 $68,367 0 $0 APPLICATIONS DENIED 44 $104,572 213 $89,715 490 $105,572 164 $38,105 0 $0 127 $81,477 4 $61,705 APPLICATIONS WITHDRAWN 12 $98,267 55 $76,453 107 $106,956 10 $15,290 0 $0 36 $72,531 0 $0 FILES CLOSED FOR INCOMPLETENESS 4 $80,945 12 $95,025 32 $114,002 2 $82,850 0 $0 12 $85,832 0 $0
Aggregated Statistics For Year 2006(Based on 4 full and 8 partial tracts) A) FHA, FSA/RHS & VA B) Conventional C) Refinancings D) Home Improvement Loans E) Loans on Dwellings For 5+ Families F) Non-occupant Loans on G) Loans On Manufactured Number Average Value Number Average Value Number Average Value Number Average Value Number Average Value Number Average Value Number Average Value
LOANS ORIGINATED 52 $104,148 559 $82,647 459 $87,062 99 $27,512 7 $6,787,534 205 $74,276 1 $6,700 APPLICATIONS APPROVED, NOT ACCEPTED 0 $0 96 $92,249 116 $95,656 13 $40,642 0 $0 22 $85,040 0 $0 APPLICATIONS DENIED 11 $99,863 263 $84,388 440 $95,580 152 $28,303 0 $0 100 $79,092 2 $19,395 APPLICATIONS WITHDRAWN 6 $91,983 128 $80,580 196 $102,080 21 $63,265 0 $0 39 $65,384 0 $0 FILES CLOSED FOR INCOMPLETENESS 0 $0 9 $87,346 73 $105,501 2 $37,725 0 $0 7 $69,329 0 $0
Aggregated Statistics For Year 2005(Based on 4 full and 8 partial tracts) A) FHA, FSA/RHS & VA B) Conventional C) Refinancings D) Home Improvement Loans E) Loans on Dwellings For 5+ Families F) Non-occupant Loans on G) Loans On Manufactured Number Average Value Number Average Value Number Average Value Number Average Value Number Average Value Number Average Value Number Average Value
LOANS ORIGINATED 99 $105,165 599 $92,797 645 $95,750 75 $44,222 5 $841,702 183 $85,304 0 $0 APPLICATIONS APPROVED, NOT ACCEPTED 4 $112,928 110 $88,136 144 $91,652 17 $35,982 0 $0 24 $85,396 0 $0 APPLICATIONS DENIED 4 $130,162 221 $98,109 580 $98,550 133 $31,629 0 $0 60 $86,906 5 $25,420 APPLICATIONS WITHDRAWN 7 $112,090 80 $94,607 314 $104,792 38 $114,314 0 $0 43 $88,971 0 $0 FILES CLOSED FOR INCOMPLETENESS 0 $0 32 $84,412 55 $95,987 0 $0 0 $0 8 $76,982 0 $0
Aggregated Statistics For Year 2004(Based on 4 full and 8 partial tracts) A) FHA, FSA/RHS & VA B) Conventional C) Refinancings D) Home Improvement Loans E) Loans on Dwellings For 5+ Families F) Non-occupant Loans on G) Loans On Manufactured Number Average Value Number Average Value Number Average Value Number Average Value Number Average Value Number Average Value Number Average Value
LOANS ORIGINATED 121 $105,303 518 $89,683 672 $94,248 75 $38,889 0 $0 141 $83,712 0 $0 APPLICATIONS APPROVED, NOT ACCEPTED 3 $135,730 115 $81,356 190 $94,000 26 $47,552 0 $0 38 $81,841 0 $0 APPLICATIONS DENIED 13 $119,749 130 $87,266 596 $94,421 124 $31,323 1 $431,800 53 $77,573 2 $8,940 APPLICATIONS WITHDRAWN 7 $101,406 51 $83,441 339 $95,394 21 $39,302 0 $0 33 $94,301 0 $0 FILES CLOSED FOR INCOMPLETENESS 2 $54,625 8 $60,915 104 $102,640 5 $69,452 0 $0 4 $75,502 0 $0
Aggregated Statistics For Year 2003(Based on 4 full and 8 partial tracts) A) FHA, FSA/RHS & VA B) Conventional C) Refinancings D) Home Improvement Loans E) Loans on Dwellings For 5+ Families F) Non-occupant Loans on Number Average Value Number Average Value Number Average Value Number Average Value Number Average Value Number Average Value
LOANS ORIGINATED 162 $101,897 467 $92,560 1,219 $87,472 63 $15,557 2 $22,995,400 160 $75,023 APPLICATIONS APPROVED, NOT ACCEPTED 1 $77,410 60 $91,384 197 $89,336 15 $12,171 0 $0 21 $79,234 APPLICATIONS DENIED 23 $98,375 94 $88,039 502 $93,890 116 $16,544 0 $0 36 $81,481 APPLICATIONS WITHDRAWN 15 $92,761 51 $88,083 305 $89,577 4 $18,598 0 $0 21 $78,398 FILES CLOSED FOR INCOMPLETENESS 3 $117,997 16 $90,927 90 $98,550 2 $14,900 0 $0 6 $70,063
Aggregated Statistics For Year 2002(Based on 4 full and 8 partial tracts) A) FHA, FSA/RHS & VA B) Conventional C) Refinancings D) Home Improvement Loans F) Non-occupant Loans on Number Average Value Number Average Value Number Average Value Number Average Value Number Average Value
LOANS ORIGINATED 200 $98,184 410 $86,131 823 $87,370 103 $12,467 108 $79,161 APPLICATIONS APPROVED, NOT ACCEPTED 3 $102,983 47 $74,011 189 $87,737 15 $8,495 16 $81,748 APPLICATIONS DENIED 14 $104,126 116 $81,586 495 $87,489 145 $7,924 37 $79,638 APPLICATIONS WITHDRAWN 19 $92,288 26 $101,180 274 $90,056 13 $10,472 7 $81,253 FILES CLOSED FOR INCOMPLETENESS 4 $123,375 18 $93,521 80 $91,336 11 $52,458 4 $94,918
Aggregated Statistics For Year 2001(Based on 4 full and 8 partial tracts) A) FHA, FSA/RHS & VA B) Conventional C) Refinancings D) Home Improvement Loans E) Loans on Dwellings For 5+ Families F) Non-occupant Loans on Number Average Value Number Average Value Number Average Value Number Average Value Number Average Value Number Average Value
LOANS ORIGINATED 193 $91,621 367 $84,816 850 $82,035 92 $13,693 2 $2,699,460 64 $79,278 APPLICATIONS APPROVED, NOT ACCEPTED 2 $60,585 32 $68,957 157 $76,886 26 $23,227 0 $0 8 $62,572 APPLICATIONS DENIED 15 $98,553 75 $67,855 523 $79,870 133 $9,459 0 $0 9 $81,457 APPLICATIONS WITHDRAWN 15 $92,584 34 $84,857 254 $85,765 17 $11,541 0 $0 8 $55,231 FILES CLOSED FOR INCOMPLETENESS 4 $75,128 14 $68,089 59 $90,474 2 $10,145 0 $0 2 $75,860
Aggregated Statistics For Year 2000(Based on 4 full and 8 partial tracts) A) FHA, FSA/RHS & VA B) Conventional C) Refinancings D) Home Improvement Loans E) Loans on Dwellings For 5+ Families F) Non-occupant Loans on Number Average Value Number Average Value Number Average Value Number Average Value Number Average Value Number Average Value
LOANS ORIGINATED 250 $88,608 315 $80,144 268 $69,548 127 $12,724 0 $0 26 $72,941 APPLICATIONS APPROVED, NOT ACCEPTED 7 $81,956 40 $68,900 109 $69,032 38 $16,928 0 $0 4 $51,325 APPLICATIONS DENIED 9 $88,291 95 $70,486 397 $65,764 146 $12,283 0 $0 11 $59,364 APPLICATIONS WITHDRAWN 9 $96,853 38 $75,505 155 $76,038 21 $21,668 2 $1,199,785 4 $57,485 FILES CLOSED FOR INCOMPLETENESS 2 $53,635 17 $68,858 22 $62,302 3 $7,777 0 $0 2 $69,145
Aggregated Statistics For Year 1999(Based on 1 full and 5 partial tracts) A) FHA, FSA/RHS & VA B) Conventional C) Refinancings D) Home Improvement Loans E) Loans on Dwellings For 5+ Families F) Non-occupant Loans on Number Average Value Number Average Value Number Average Value Number Average Value Number Average Value Number Average Value
LOANS ORIGINATED 108 $84,548 140 $75,290 238 $66,554 74 $11,946 1 $104,300 24 $73,430 APPLICATIONS APPROVED, NOT ACCEPTED 1 $56,400 19 $75,343 66 $71,782 19 $8,487 0 $0 4 $29,638 APPLICATIONS DENIED 6 $89,577 33 $68,726 153 $71,180 56 $11,170 0 $0 16 $59,915 APPLICATIONS WITHDRAWN 6 $83,425 20 $87,771 78 $66,439 7 $39,607 0 $0 5 $79,576 FILES CLOSED FOR INCOMPLETENESS 0 $0 6 $81,970 45 $71,931 0 $0 0 $0 3 $66,110
Private Mortgage Insurance Companies Aggregated Statistics For Year 2009(Based on 4 full and 8 partial tracts) A) Conventional B) Refinancings C) Non-occupant Loans on Number Average Value Number Average Value Number Average Value
LOANS ORIGINATED 8 $118,355 2 $98,295 0 $0 APPLICATIONS APPROVED, NOT ACCEPTED 3 $44,400 5 $98,508 1 $67,650 APPLICATIONS DENIED 1 $53,000 1 $37,660 0 $0 APPLICATIONS WITHDRAWN 0 $0 0 $0 0 $0 FILES CLOSED FOR INCOMPLETENESS 0 $0 0 $0 0 $0
Aggregated Statistics For Year 2008(Based on 4 full and 8 partial tracts) A) Conventional B) Refinancings C) Non-occupant Loans on Number Average Value Number Average Value Number Average Value
LOANS ORIGINATED 50 $86,680 13 $121,715 27 $83,647 APPLICATIONS APPROVED, NOT ACCEPTED 31 $82,409 17 $125,088 13 $63,628 APPLICATIONS DENIED 9 $90,806 5 $95,974 12 $97,587 APPLICATIONS WITHDRAWN 0 $0 0 $0 0 $0 FILES CLOSED FOR INCOMPLETENESS 7 $114,004 1 $91,790 4 $127,008
Aggregated Statistics For Year 2007(Based on 4 full and 8 partial tracts) A) Conventional B) Refinancings C) Non-occupant Loans on Number Average Value Number Average Value Number Average Value
LOANS ORIGINATED 138 $104,234 39 $108,515 25 $85,173 APPLICATIONS APPROVED, NOT ACCEPTED 14 $128,504 10 $118,154 4 $132,272 APPLICATIONS DENIED 7 $108,780 14 $121,491 11 $113,905 APPLICATIONS WITHDRAWN 6 $123,670 1 $85,080 2 $133,845 FILES CLOSED FOR INCOMPLETENESS 1 $72,360 0 $0 0 $0
Aggregated Statistics For Year 2006(Based on 4 full and 8 partial tracts) A) Conventional B) Refinancings C) Non-occupant Loans on Number Average Value Number Average Value Number Average Value
LOANS ORIGINATED 121 $100,405 29 $106,731 13 $91,919 APPLICATIONS APPROVED, NOT ACCEPTED 9 $109,801 11 $113,085 3 $51,310 APPLICATIONS DENIED 1 $115,910 0 $0 1 $43,550 APPLICATIONS WITHDRAWN 6 $79,312 2 $105,980 0 $0 FILES CLOSED FOR INCOMPLETENESS 0 $0 0 $0 0 $0
Aggregated Statistics For Year 2005(Based on 4 full and 8 partial tracts) A) Conventional B) Refinancings C) Non-occupant Loans on Number Average Value Number Average Value Number Average Value
LOANS ORIGINATED 121 $103,475 56 $110,998 28 $86,726 APPLICATIONS APPROVED, NOT ACCEPTED 18 $103,082 12 $128,607 3 $124,337 APPLICATIONS DENIED 2 $57,485 6 $65,487 4 $73,460 APPLICATIONS WITHDRAWN 1 $154,770 9 $138,203 1 $188,300 FILES CLOSED FOR INCOMPLETENESS 2 $49,660 0 $0 0 $0
Aggregated Statistics For Year 2004(Based on 4 full and 8 partial tracts) A) Conventional B) Refinancings C) Non-occupant Loans on Number Average Value Number Average Value Number Average Value
LOANS ORIGINATED 145 $93,787 89 $109,055 34 $82,806 APPLICATIONS APPROVED, NOT ACCEPTED 21 $111,127 39 $111,128 5 $94,008 APPLICATIONS DENIED 7 $114,157 2 $137,080 2 $98,325 APPLICATIONS WITHDRAWN 7 $60,360 15 $142,547 5 $64,694 FILES CLOSED FOR INCOMPLETENESS 2 $92,370 1 $88,570 0 $0
Aggregated Statistics For Year 2003(Based on 4 full and 8 partial tracts) A) Conventional B) Refinancings C) Non-occupant Loans on Number Average Value Number Average Value Number Average Value
LOANS ORIGINATED 139 $99,230 140 $100,561 47 $83,340 APPLICATIONS APPROVED, NOT ACCEPTED 15 $111,953 56 $112,165 2 $145,005 APPLICATIONS DENIED 2 $89,390 2 $112,230 2 $89,390 APPLICATIONS WITHDRAWN 5 $144,142 6 $95,918 1 $67,000 FILES CLOSED FOR INCOMPLETENESS 1 $79,060 2 $109,900 0 $0
Aggregated Statistics For Year 2002(Based on 4 full and 8 partial tracts) A) Conventional B) Refinancings C) Non-occupant Loans on Number Average Value Number Average Value Number Average Value
LOANS ORIGINATED 145 $89,571 117 $105,969 23 $87,240 APPLICATIONS APPROVED, NOT ACCEPTED 14 $82,603 44 $97,205 1 $46,730 APPLICATIONS DENIED 5 $70,600 1 $27,200 2 $102,835 APPLICATIONS WITHDRAWN 6 $102,392 16 $103,844 5 $128,680 FILES CLOSED FOR INCOMPLETENESS 3 $73,837 2 $106,270 0 $0
Aggregated Statistics For Year 2001(Based on 4 full and 8 partial tracts) A) Conventional B) Refinancings C) Non-occupant Loans on Number Average Value Number Average Value Number Average Value
LOANS ORIGINATED 137 $86,004 101 $96,152 20 $82,134 APPLICATIONS APPROVED, NOT ACCEPTED 19 $98,841 23 $94,760 5 $99,060 APPLICATIONS DENIED 3 $87,980 7 $172,910 3 $87,980 APPLICATIONS WITHDRAWN 3 $59,910 4 $103,275 0 $0 FILES CLOSED FOR INCOMPLETENESS 0 $0 3 $88,397 0 $0
Aggregated Statistics For Year 2000(Based on 4 full and 8 partial tracts) A) Conventional B) Refinancings C) Non-occupant Loans on Number Average Value Number Average Value Number Average Value
LOANS ORIGINATED 122 $87,190 24 $92,149 12 $74,546 APPLICATIONS APPROVED, NOT ACCEPTED 9 $84,738 11 $86,881 0 $0 APPLICATIONS DENIED 7 $89,361 3 $95,970 1 $54,270 APPLICATIONS WITHDRAWN 2 $94,360 3 $92,533 0 $0 FILES CLOSED FOR INCOMPLETENESS 0 $0 0 $0 0 $0
Aggregated Statistics For Year 1999(Based on 1 full and 5 partial tracts) A) Conventional B) Refinancings C) Non-occupant Loans on Number Average Value Number Average Value Number Average Value
LOANS ORIGINATED 52 $81,896 23 $86,280 6 $67,392 APPLICATIONS APPROVED, NOT ACCEPTED 3 $70,333 4 $81,275 2 $81,515 APPLICATIONS DENIED 3 $44,887 1 $69,810 3 $44,887 APPLICATIONS WITHDRAWN 1 $80,800 1 $67,030 0 $0 FILES CLOSED FOR INCOMPLETENESS 1 $63,070 0 $0 0 $0
2002 - 2018 National Fire Incident Reporting System (NFIRS) incidents See full 2006 National Fire Incident Reporting System statistics for zip code 44123, Ohio
Most common first names in zip code 44123 among deceased individuals Name Count Lived (average)
John 355 75.4 years Mary 341 80.9 years Joseph 234 75.4 years Frank 193 76.4 years William 171 74.9 years Anna 134 81.8 years Helen 123 78.5 years Margaret 120 76.1 years Edward 120 73.8 years James 111 72.7 years
Most common last names in zip code 44123 among deceased individuals Last name Count Lived (average)
Smith 46 76.6 years Miller 41 76.3 years Johnson 23 74.7 years Anderson 22 77.9 years Jones 22 74.1 years Williams 21 73.7 years Thomas 19 75.7 years Young 18 68.1 years Taylor 17 79.1 years Schultz 16 79.2 years
Businesses in zip code 44123
Name Count Name Count
Blockbuster 1 Little Caesars Pizza 1 Burger King 1 Nike 1 CVS 1 Payless 1 Curves 1 Pizza Hut 1 Dunkin Donuts 1 RadioShack 1 FedEx 1 T-Mobile 1 H&R Block 1 Walgreens 1 KFC 1 YMCA 1
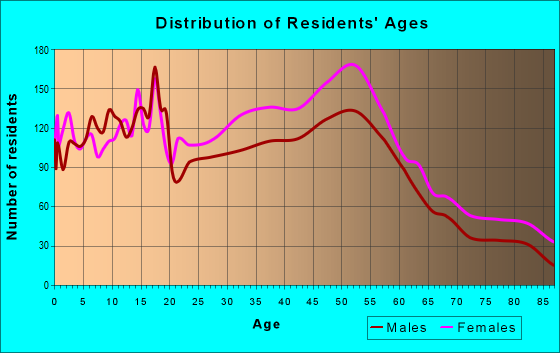
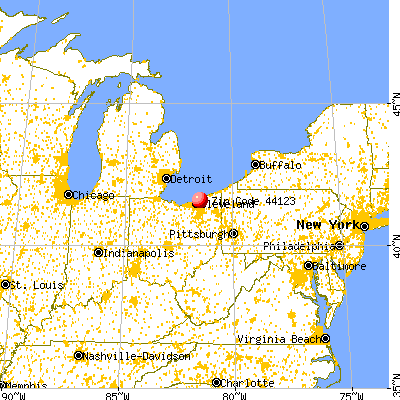


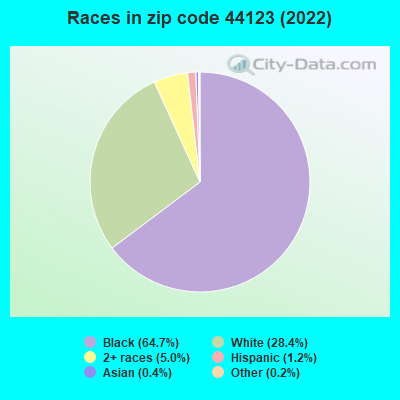


 Nearest zip codes: 44132, 44119, 44117, 44110, 44092, 44143.
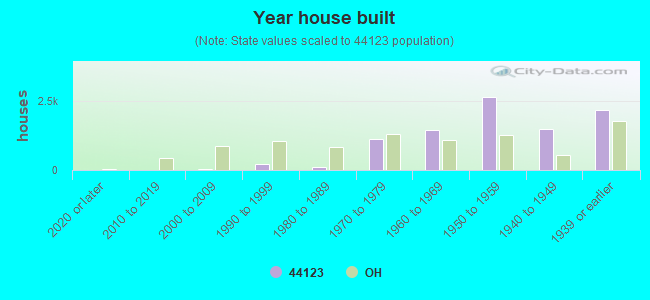
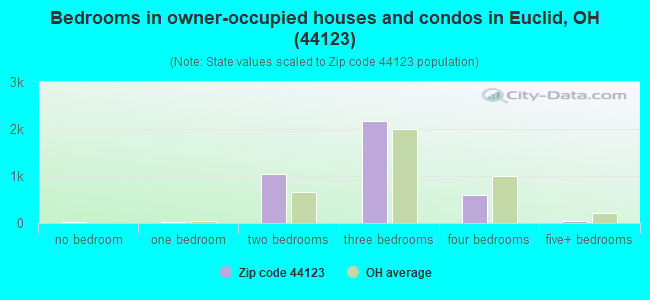
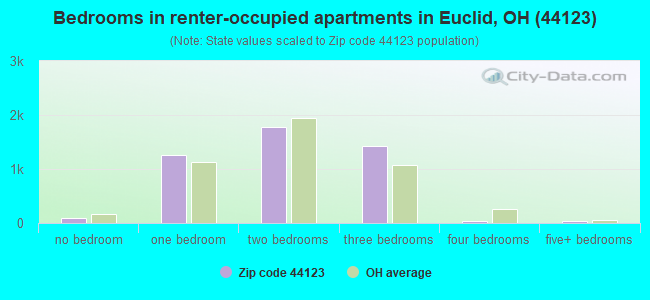
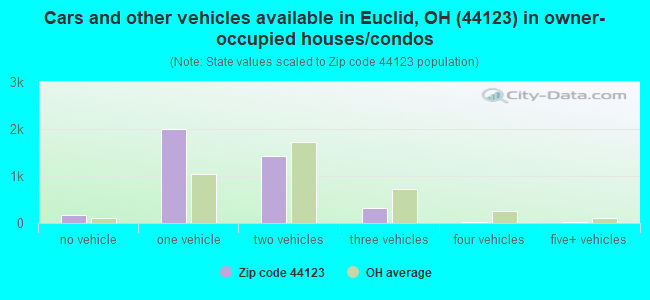
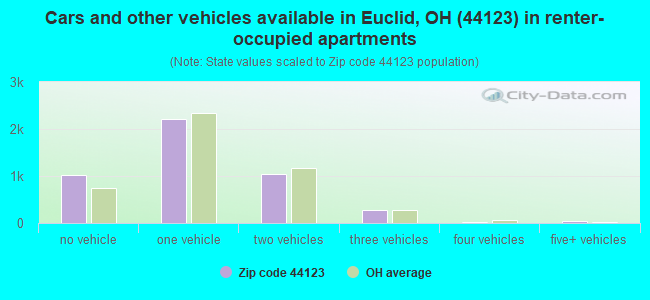


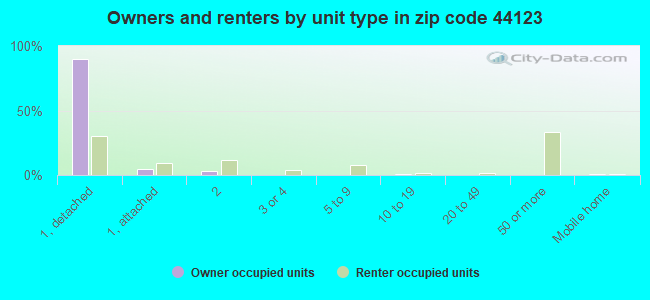
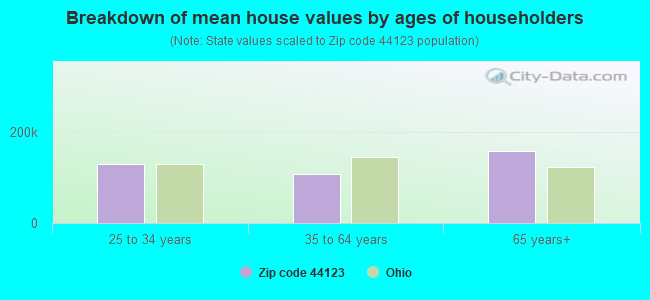


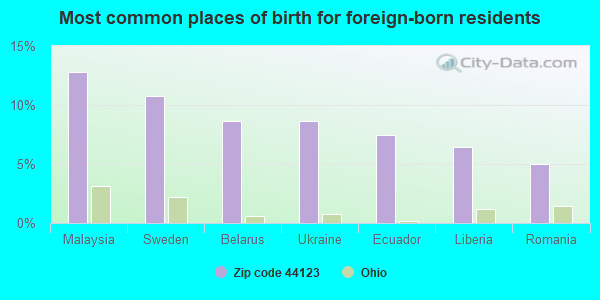
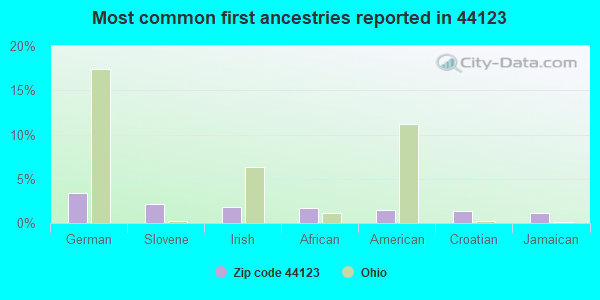
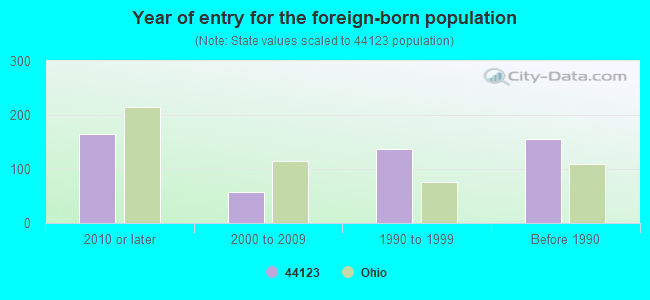
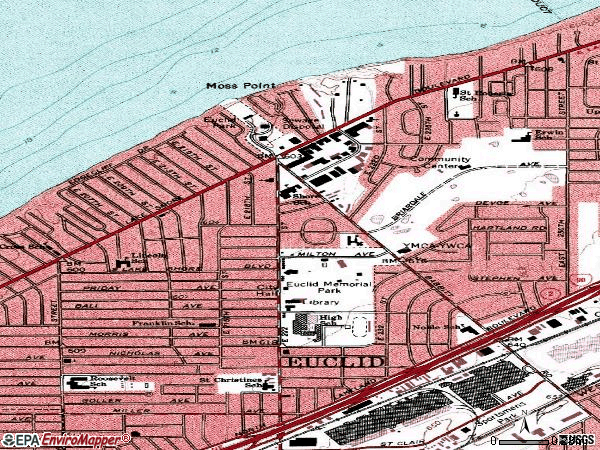

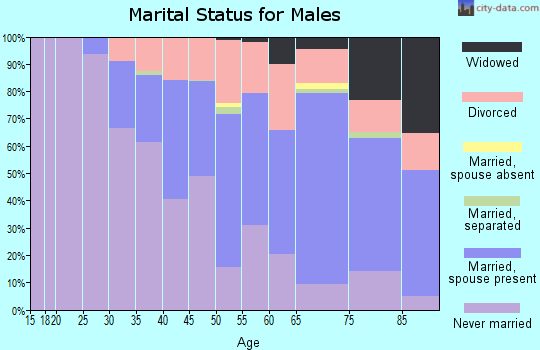
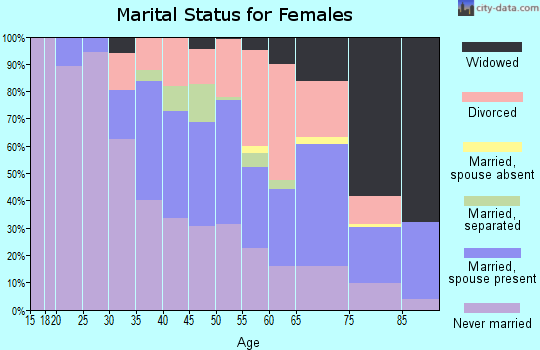
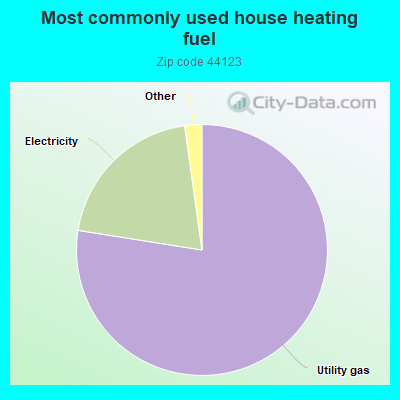
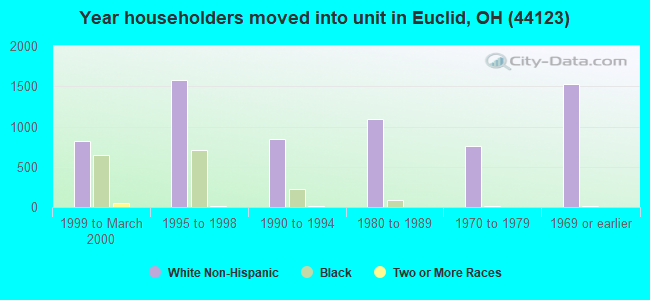
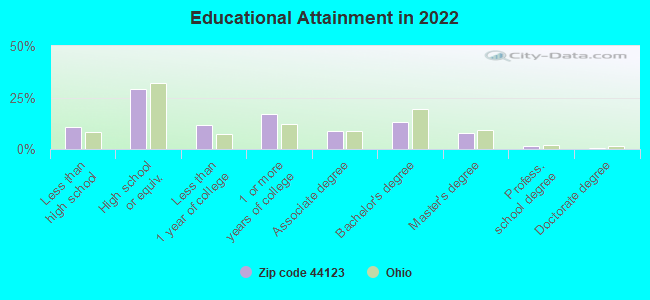
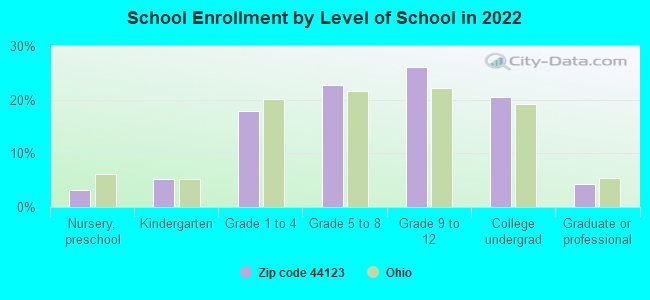
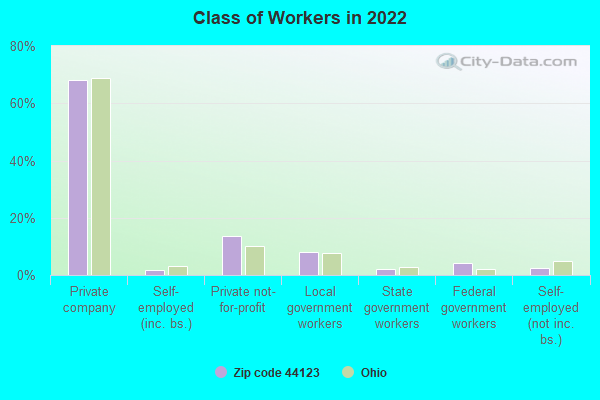
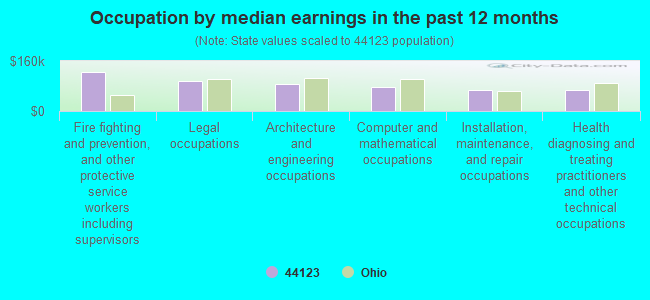
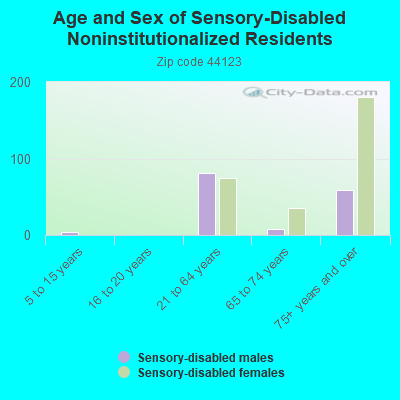
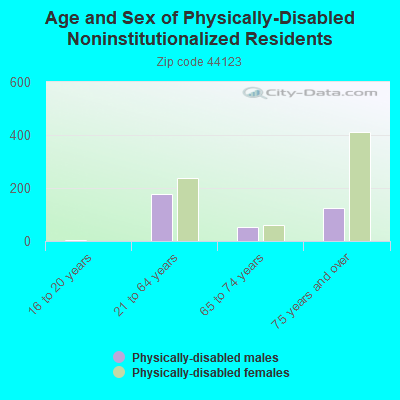
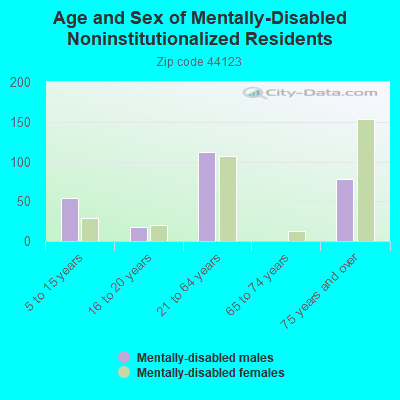
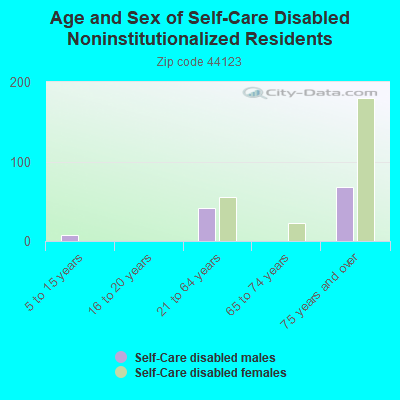
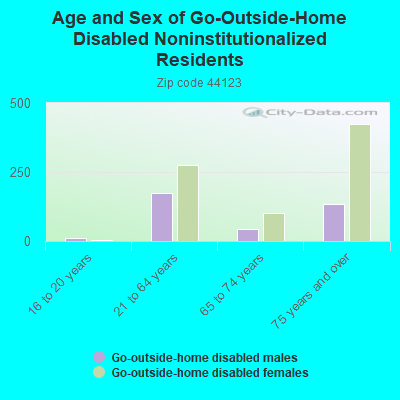
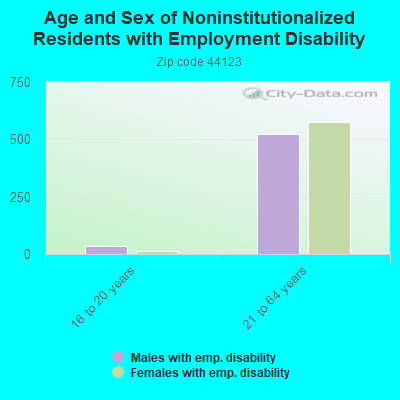
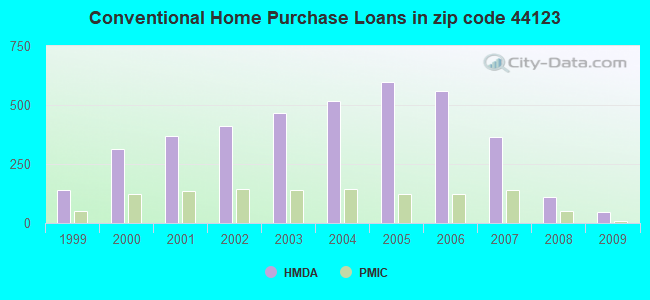
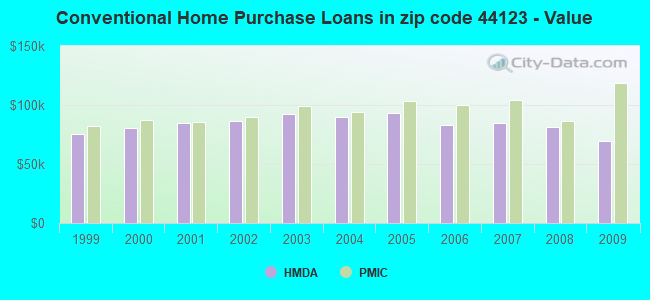
 Based on the data from the years 2002 - 2018 the average number of fire incidents per year is 74. The highest number of reported fires - 116 took place in 2007, and the least - 53 in 2002. The data has a growing trend.
 When looking into fire subcategories, the most reports belonged to: Structure Fires (43.2%), and Outside Fires (30.5%).