Estimated zip code population in 2022: 14,393 Zip code population in 2010: 14,071 Zip code population in 2000: 15,322
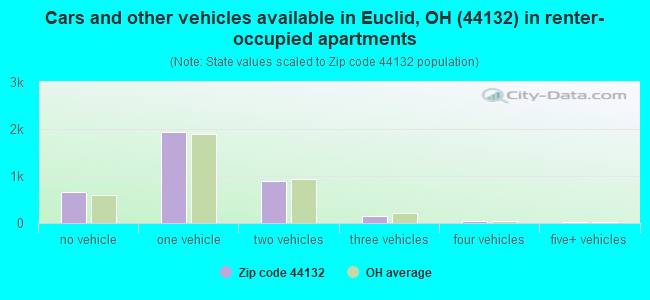
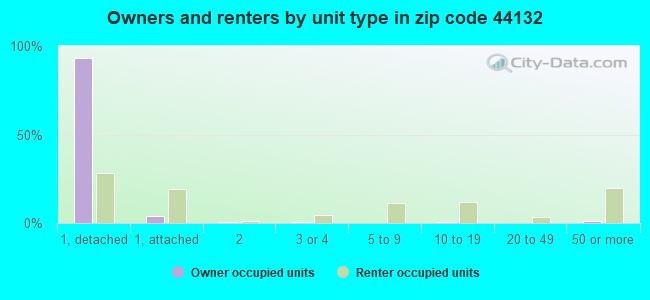
Houses and condos: 7,696 Renter-occupied apartments: 3,710
% of renters here:
56%
State:
33%
March 2022 cost of living index in zip code 44132: 94.7 (less than average, U.S. average is 100)
Land area: 3.1 sq. mi. Water area: 0.3 sq. mi.
Population density: 4,606 people per square mile
(average).
OSM Map
General Map
Google Map
MSN Map
OSM Map
General Map
Google Map
MSN Map
OSM Map
General Map
Google Map
MSN Map
OSM Map
General Map
Google Map
MSN Map
Please wait while loading the map...
Real estate property taxes paid for housing units in 2022:
This zip code:
2.4% ($2,595)
Ohio:
1.3% ($2,639)
Median real estate property taxes paid for housing units with mortgages in 2022: $2,599 (2.0%) Median real estate property taxes paid for housing units with no mortgage in 2022: $2,601 (2.7%)
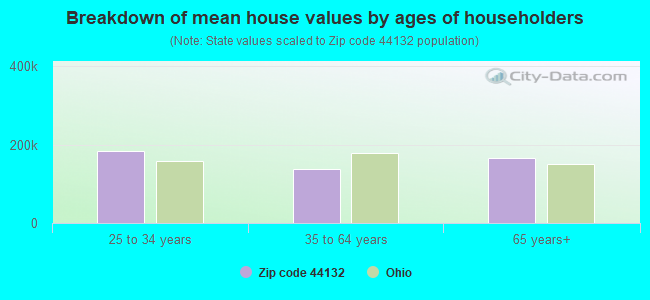
Estimated median house/condo value in 2022: $109,789
44132:
$109,789
Ohio:
$204,100
According to our research of Ohio and other state lists, there were 15 registered sex offenders living in 44132 zip code as of April 27, 2024. The ratio of all residents to sex offenders in zip code 44132 is 1,016 to 1. The ratio of registered sex offenders to all residents in this zip code is lower than the state average.
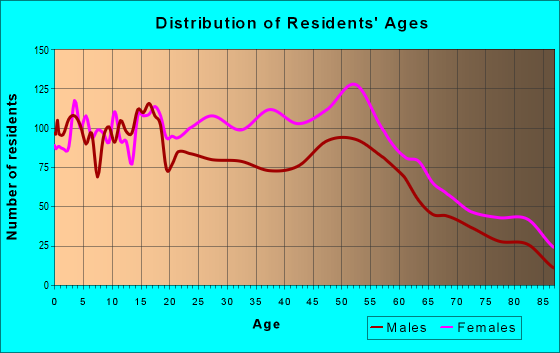
Median resident age:
This zip code:
36.9 years
Ohio median age:
39.9 years
Average household size:
This zip code:
2.2 people
Ohio:
2.4 people
Averages for the 2020 tax year for zip code 44132, filed in 2021:
Average Adjusted Gross Income (AGI) in 2020: $38,014 (Individual Income Tax Returns)
Here:
$38,014
State:
$67,288
Salary/wage: $34,216 (reported on 84.5% of returns)
Here:
$34,216
State:
$55,628
(% of AGI for various income ranges: 1163.1% for AGIs below $25k, 3590.3% for AGIs $25k-50k, 6679.5% for AGIs $50k-75k, 9919.6% for AGIs $75k-100k, 16023.9% for AGIs $100k-200k)
Taxable interest for individuals: $718 (reported on 12.7% of returns)
This zip code:
$718
Ohio:
$1,518
(% of AGI for various income ranges: 5.9% for AGIs below $25k, 7.5% for AGIs $25k-50k, 14.1% for AGIs $50k-75k, 35.2% for AGIs $75k-100k, 80.6% for AGIs $100k-200k)
Ordinary dividends: $4,741 (reported on 8.0% of returns)
Here:
$4,741
State:
$7,167
(% of AGI for various income ranges: 10.4% for AGIs below $25k, 12.3% for AGIs $25k-50k, 32.2% for AGIs $50k-75k, 90.0% for AGIs $75k-100k, 205.0% for AGIs $100k-200k)
Net capital gain/loss in AGI: +$4,855 (reported on 6.7% of returns)
Here:
+$4,855
State:
+$18,919
(% of AGI for various income ranges: 3.1% for AGIs below $25k, 13.3% for AGIs $25k-50k, 20.8% for AGIs $50k-75k, 137.6% for AGIs $75k-100k, 355.0% for AGIs $100k-200k)
Profit/loss from business: +$3,495 (reported on 13.5% of returns)
Here:
+$3,495
State:
+$13,744
(% of AGI for various income ranges: 50.5% for AGIs below $25k, 23.3% for AGIs $25k-50k, 102.7% for AGIs $50k-75k, 62.0% for AGIs $75k-100k, 448.9% for AGIs $100k-200k)
Taxable individual retirement arrangement distribution: $12,939 (reported on 6.0% of returns)
44132:
$12,939
Ohio:
$18,876
(% of AGI for various income ranges: 45.0% for AGIs below $25k, 49.7% for AGIs $25k-50k, 159.7% for AGIs $50k-75k, 399.6% for AGIs $75k-100k, 761.1% for AGIs $100k-200k)
Total itemized deductions: $24,976 (reported on 3.4% of returns)
Here:
$24,976
State:
$33,869
(% of AGI for various income ranges: 14.1% for AGIs below $25k, 64.5% for AGIs $25k-50k, 237.8% for AGIs $50k-75k, 315.6% for AGIs $75k-100k, 1125.6% for AGIs $100k-200k)
Charity contributions: $7,727 (reported on 3.0% of returns)
Here:
$7,727
State:
$14,577
(% of AGI for various income ranges: 17.3% for AGIs $25k-50k, 52.7% for AGIs $50k-75k, 102.0% for AGIs $75k-100k, 389.4% for AGIs $100k-200k)
Taxes paid: $5,804 (reported on 3.4% of returns)
44132:
$5,804
State:
$7,681
(% of AGI for various income ranges: 2.7% for AGIs below $25k, 12.8% for AGIs $25k-50k, 57.5% for AGIs $50k-75k, 103.6% for AGIs $75k-100k, 242.8% for AGIs $100k-200k)
Earned income credit: $2,641 (reported on 28.8% of returns)
Here:
$2,641
State:
$2,304
(% of AGI for various income ranges: 153.9% for AGIs below $25k, 84.2% for AGIs $25k-50k)
Percentage of individuals using paid preparers for their 2020 taxes: 92.5%
Here:
93%
State:
94%
(% for various income ranges: 93.1% for AGIs below $25k, 94.1% for AGIs $25k-50k, 90.1% for AGIs $50k-75k, 86.8% for AGIs $75k-100k, 90.0% for AGIs $100k-200k, 75.0% for AGIs over 200k)
Averages for the 2012 tax year for zip code 44132, filed in 2013:
Average Adjusted Gross Income (AGI) in 2012: $34,657 (Individual Income Tax Returns)
Here:
$34,657
State:
$54,926
Salary/wage: $32,081 (reported on 84.8% of returns)
Here:
$32,081
State:
$45,869
(% of AGI for various income ranges: 77.2% for AGIs below $25k, 83.6% for AGIs $25k-50k, 78.7% for AGIs $50k-75k, 77.1% for AGIs $75k-100k, 72.6% for AGIs $100k-200k, 59.5% for AGIs over 200k)
Taxable interest for individuals: $855 (reported on 19.8% of returns)
This zip code:
$855
Ohio:
$1,297
(% of AGI for various income ranges: 0.6% for AGIs below $25k, 0.5% for AGIs $25k-50k, 0.5% for AGIs $50k-75k, 0.5% for AGIs $75k-100k, 0.4% for AGIs $100k-200k, 0.7% for AGIs over 200k)
Ordinary dividends: $3,221 (reported on 11.3% of returns)
Here:
$3,221
State:
$5,821
(% of AGI for various income ranges: 0.9% for AGIs below $25k, 0.5% for AGIs $25k-50k, 0.9% for AGIs $50k-75k, 1.3% for AGIs $75k-100k, 2.4% for AGIs $100k-200k, 3.0% for AGIs over 200k)
Net capital gain/loss in AGI: +$1,945 (reported on 6.8% of returns)
Here:
+$1,945
State:
+$11,232
(% of AGI for various income ranges: 0.4% for AGIs $50k-75k, 0.5% for AGIs $75k-100k, 2.3% for AGIs $100k-200k)
Profit/loss from business: +$6,767 (reported on 11.7% of returns)
Here:
+$6,767
State:
+$12,773
(% of AGI for various income ranges: 6.9% for AGIs below $25k, 0.7% for AGIs $25k-50k, 1.2% for AGIs $50k-75k, 1.1% for AGIs $75k-100k, 4.0% for AGIs $100k-200k)
Taxable individual retirement arrangement distribution: $10,195 (reported on 8.5% of returns)
44132:
$10,195
Ohio:
$14,511
(% of AGI for various income ranges: 2.7% for AGIs below $25k, 1.9% for AGIs $25k-50k, 2.4% for AGIs $50k-75k, 3.0% for AGIs $75k-100k, 4.6% for AGIs $100k-200k)
Total itemized deductions: $14,438 (23% of AGI, reported on 22.2% of returns)
Here:
$14,438
State:
$21,278
Here:
23.2% of AGI
State:
18.8% of AGI
(% of AGI for various income ranges: 4.9% for AGIs below $25k, 7.3% for AGIs $25k-50k, 11.8% for AGIs $50k-75k, 11.5% for AGIs $75k-100k, 14.0% for AGIs $100k-200k, 10.9% for AGIs over 200k)
Charity contributions: $2,633 (reported on 17.2% of returns)
Here:
$2,633
State:
$3,943
(% of AGI for various income ranges: 0.5% for AGIs below $25k, 1.0% for AGIs $25k-50k, 1.6% for AGIs $50k-75k, 1.9% for AGIs $75k-100k, 2.8% for AGIs $100k-200k)
Taxes paid: $6,323 (reported on 22.1% of returns)
44132:
$6,323
State:
$9,568
(% of AGI for various income ranges: 1.5% for AGIs below $25k, 2.7% for AGIs $25k-50k, 4.8% for AGIs $50k-75k, 5.5% for AGIs $75k-100k, 7.9% for AGIs $100k-200k, 6.7% for AGIs over 200k)
Earned income credit: $2,685 (reported on 29.2% of returns)
Here:
$2,685
State:
$2,285
(% of AGI for various income ranges: 10.4% for AGIs below $25k, 1.2% for AGIs $25k-50k)
Percentage of individuals using paid preparers for their 2012 taxes: 42.3%
Here:
42%
State:
51%
(% for various income ranges: 39.8% for AGIs below $25k, 40.1% for AGIs $25k-50k, 49.5% for AGIs $50k-75k, 51.4% for AGIs $75k-100k, 66.7% for AGIs $100k-200k, 0.0% for AGIs over 200k)
Averages for the 2004 tax year for zip code 44132, filed in 2005:
Average Adjusted Gross Income (AGI) in 2004: $32,581 (Individual Income Tax Returns)
Here:
$32,581
State:
$44,480
Salary/wage: $31,359 (reported on 84.5% of returns)
Here:
$31,359
State:
$39,198
(% of AGI for various income ranges: 79.4% for AGIs below $10k, 74.6% for AGIs $10k-25k, 87.5% for AGIs $25k-50k, 83.3% for AGIs $50k-75k, 82.7% for AGIs $75k-100k, 62.8% for AGIs over 100k)
Taxable interest for individuals: $1,275 (reported on 36.1% of returns)
This zip code:
$1,275
Ohio:
$1,532
(% of AGI for various income ranges: 4.7% for AGIs below $10k, 2.3% for AGIs $10k-25k, 0.8% for AGIs $25k-50k, 1.2% for AGIs $50k-75k, 1.4% for AGIs $75k-100k, 1.9% for AGIs over 100k)
Taxable dividends: $2,251 (reported on 18.8% of returns)
Here:
$2,251
State:
$3,496
(% of AGI for various income ranges: 2.7% for AGIs below $10k, 1.6% for AGIs $10k-25k, 0.6% for AGIs $25k-50k, 1.3% for AGIs $50k-75k, 1.5% for AGIs $75k-100k, 2.8% for AGIs over 100k)
Net capital gain/loss: +$3,233 (reported on 11.6% of returns)
Here:
+$3,233
State:
+$8,582
(% of AGI for various income ranges: -1.6% for AGIs below $10k, 0.2% for AGIs $10k-25k, 0.4% for AGIs $25k-50k, 0.6% for AGIs $50k-75k, 1.0% for AGIs $75k-100k, 7.6% for AGIs over 100k)
Profit/loss from business: +$6,477 (reported on 9.0% of returns)
Here:
+$6,477
State:
+$10,813
(% of AGI for various income ranges: 9.5% for AGIs below $10k, 2.4% for AGIs $10k-25k, 1.1% for AGIs $25k-50k, 1.1% for AGIs $50k-75k, 0.5% for AGIs $75k-100k, 4.6% for AGIs over 100k)
IRA payment deduction: $2,713 (reported on 1.8% of returns)
44132:
$2,713
Ohio:
$2,794
(% of AGI for various income ranges: 0.2% for AGIs $10k-25k, 0.2% for AGIs $25k-50k, 0.1% for AGIs $50k-75k, 0.1% for AGIs $75k-100k, 0.2% for AGIs over 100k)
Self-employed pension: $4,250 (reported on 0.2% of returns)
Here:
$4,250
Ohio:
$13,981
Total itemized deductions: $12,718 (24% of AGI, reported on 30.4% of returns)
Here:
$12,718
State:
$17,503
Here:
24.1% of AGI
State:
20.8% of AGI
(% of AGI for various income ranges: 10.6% for AGIs below $10k, 6.2% for AGIs $10k-25k, 11.1% for AGIs $25k-50k, 14.6% for AGIs $50k-75k, 14.9% for AGIs $75k-100k, 14.4% for AGIs over 100k)
Charity contributions deductions: $1,954 (4% of AGI, reported on 25.0% of returns)
Here:
$1,954
State:
$3,087
Here:
3.5% of AGI
State:
3.4% of AGI
(% of AGI for various income ranges: 0.7% for AGIs below $10k, 0.9% for AGIs $10k-25k, 1.3% for AGIs $25k-50k, 1.9% for AGIs $50k-75k, 2.1% for AGIs $75k-100k, 1.9% for AGIs over 100k)
Total tax: $3,769 (reported on 72.1% of returns)
44132:
$3,769
State:
$6,781
(% of AGI for various income ranges: 2.8% for AGIs below $10k, 3.6% for AGIs $10k-25k, 7.1% for AGIs $25k-50k, 9.5% for AGIs $50k-75k, 10.8% for AGIs $75k-100k, 16.2% for AGIs over 100k)
Earned income credit: $1,828 (reported on 20.6% of returns)
Here:
$1,828
State:
$1,696
Percentage of individuals using paid preparers for their 2004 taxes: 53.1%
Here:
53%
State:
55%
(% for various income ranges: 46.1% for AGIs below $10k, 58.6% for AGIs $10k-25k, 51.9% for AGIs $25k-50k, 52.1% for AGIs $50k-75k, 52.2% for AGIs $75k-100k, 62.1% for AGIs over 100k)
Likely homosexual households (counted as self-reported same-sex unmarried-partner households)
Lesbian couples: 0.1% of all households
Gay men: 0.0% of all households
Household received Food Stamps/SNAP in the past 12 months: 1,332 Household did not receive Food Stamps/SNAP in the past 12 months: 5,302
Women who had a birth in the past 12 months: 393 (139 now married, 247 unmarried) Women who did not have a birth in the past 12 months: 3,595 (936 now married, 2,660 unmarried)
Housing units in zip code 44132 with a mortgage: 1,727 (79 second mortgage, 40 both second mortgage and home equity loan) Houses without a mortgage: 69
Median monthly owner costs for units with a mortgage: $1,083 Median monthly owner costs for units without a mortgage: $473
Residents with income below the poverty level in 2022:
This zip code:
22.6%
Whole state:
13.4%
Residents with income below 50% of the poverty level in 2022:
This zip code:
10.3%
Whole state:
7.0%
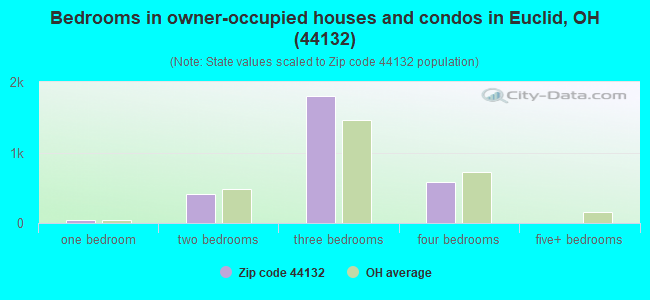
Median number of rooms in houses and condos:
Here:
6.3
State:
6.7
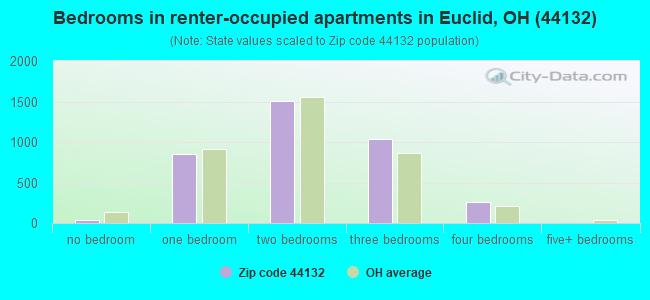
Median number of rooms in apartments:
Here:
4.6
State:
4.4
Notable locations in this zip code not listed on our city pages
Notable locations in zip code 44132: Hillcrest Ambulance Service (A), Euclid Fire Department Station 3 (B), Euclid Fire Station Number 3 (C), Bonneville Tower (D). Display/hide their locations on the map
Churches in zip code 44132 include: Saint Williams Catholic Church (A), Saint Stephens Byzantine Catholic Church (B), Lake Shore Church (C), Ambassadors For Christ (D), Euclid Lutheran Church (E), New Freedom Ministries (F), New Wave Church of God in Christ (G), Lake Shore Christian Church (H), The Masters United Methodist Church (I). Display/hide their locations on the map
In group quarters: 10 (-1 institutionalized population)
Size of family households: 1,926 2-persons, 964 3-persons, 485 4-persons, 261 5-persons, 54 6-persons, 17 7-or-more-persons
Size of nonfamily households: 2,722 1-person, 156 2-persons, 39 3-persons
1,076 married couples with children.
1,841 single-parent households (163 men, 1,678 women).
92.3% of residents of 44132 zip code speak English at home.
2.8% of residents speak Spanish at home (94% very well, 3% well, 3% not well).
1.8% of residents speak other Indo-European language at home (66% very well, 34% well).
0.9% of residents speak Asian or Pacific Island language at home (73% very well, 27% well).
1.8% of residents speak other language at home (82% very well, 6% well, 7% not well, 5% not at all).
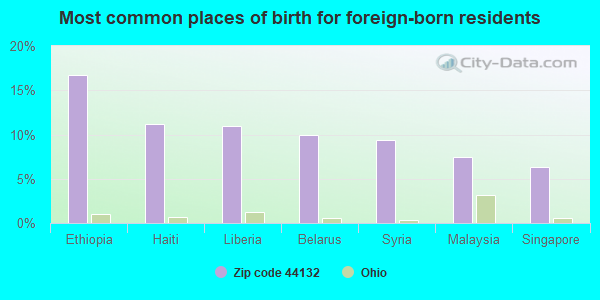
Foreign born population: 520 (3.6%) (59.1% of them are naturalized citizens)
This zip code:
3.6%
Whole state:
5.0%
17%Ethiopia
11%Haiti
11%Liberia
10%Belarus
9%Syria
8%Malaysia
6%Singapore
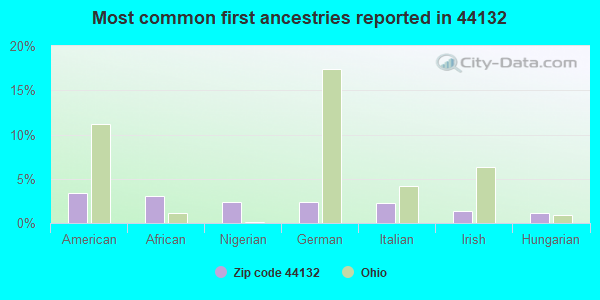
3%American
3%African
2%Nigerian
2%German
2%Italian
1%Irish
1%Hungarian
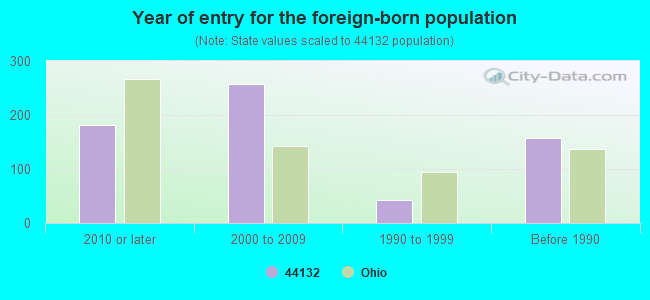
Year of entry for the foreign-born population
1822010 or later
2582000 to 2009
431990 to 1999
158Before 1990
Facilities with environmental interests located in this zip code:
AM MULTIGRAPHICS * (1200 BABBITT ROAD in EUCLID, OH)
STATE MASTER (Ohio general info) - RCRA-OHD095472288, HAZARDOUS WASTE PROGRAM (Resource Conservation and Recovery Act (tracking hazardous waste)) Organizations: AM INTERNATIONAL (CONTACT/OWNER)
Alternative names: AM INTERNATIONAL MULTIGRAPHICS DIV
ALBERT M. HIGLEY CO (24320 LAKELAND BLVD in EUCLID, OH)
STATE MASTER (Ohio general info) - RCRA-OHR000041871, HAZARDOUS WASTE PROGRAM Conditionally Exempt Small Quantity Generators, less than 100 kg/month of hazardous waste (Resource Conservation and Recovery Act (tracking hazardous waste)) - notification Organizations: BRUCE HIGLEY (CONTACT/OWNER)
Alternative names: ALBERT M HIGHLEY CO THE
CEI EUCLID SERVICE CENTER * (1422 BABBITT RD in EUCLID, OH)
STATE MASTER (Ohio general info) - RCRA-OHD987023546, HAZARDOUS WASTE PROGRAM Conditionally Exempt Small Quantity Generators, less than 100 kg/month of hazardous waste (Resource Conservation and Recovery Act (tracking hazardous waste)) - notification Organizations: CENTERIOR ENERGY CORPORATION (CONTACT/OWNER)
ADVANCED EQUIPMENT SYSTEMS INC (22800 LAKELAND BLVD in CLEVELAND, OH)
(Resource Conservation and Recovery Act (tracking hazardous waste)) Organizations: DAVID HEIDENREICH (CONTACT/OWNER)
BP OIL CO SITE 04696 (26021 EUCLID AVE in EUCLID, OH)
(Resource Conservation and Recovery Act (tracking hazardous waste)) Organizations: BP OIL COMPANY (CONTACT/OWNER)
BP OIL CO SITE 04703 (940 E 260TH ST in EUCLID, OH)
(Resource Conservation and Recovery Act (tracking hazardous waste)) Organizations: BP OIL COMPANY (CONTACT/OWNER)
24800 LAKELAND INC (24800 LAKELAND BLVD in EUCLID, OH)
Small Quantity Generators, between 100 kg and 1000 kg of hazardous waste/month (Resource Conservation and Recovery Act (tracking hazardous waste)) - notification
BIC MANUFACTURING AD DIVISION (26420 CENTURY CORNERS PARKWAY in EUCLID, OH)
Small Quantity Generators, between 100 kg and 1000 kg of hazardous waste/month (Resource Conservation and Recovery Act (tracking hazardous waste))
BP BABBITT -- AQUAEAST (FORMERLY BP OIL (24310 LAKELAND BOULEVARD in EUCLID, OH)
AIR MINOR (AIRS/AFS) Business SIC classification: GASOLINE SERVICE STATIONS Alternative names: BP NO. 04691 DBA JACKIE'S BP
Housing units lacking complete plumbing facilities: 1.1% Housing units lacking complete kitchen facilities: 1.7%
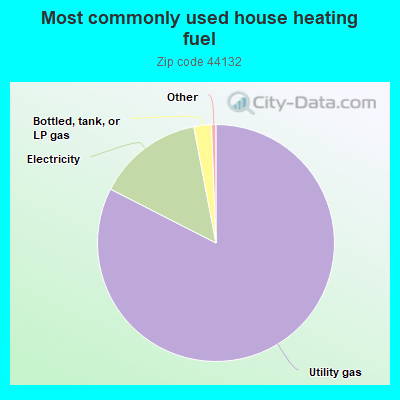
82.6%Utility gas
14.5%Electricity
2.4%Bottled, tank, or LP gas
Population in 1990: 16,398.
Place of birth for U.S.-born residents:
This state: 12,061
Northeast: 498
Midwest: 255
South: 763
West: 157
56% of the 44132 zip code residents lived in the same house 5 years ago. Out of people who lived in different houses, 77% lived in this county. Out of people who lived in different counties, 50% lived in Ohio.
89% of the 44132 zip code residents lived in the same house 1 year ago. Out of people who lived in different houses, 65% moved from this county. Out of people who lived in different houses, 21% moved from different county within same state. Out of people who lived in different houses, 11% moved from different state.
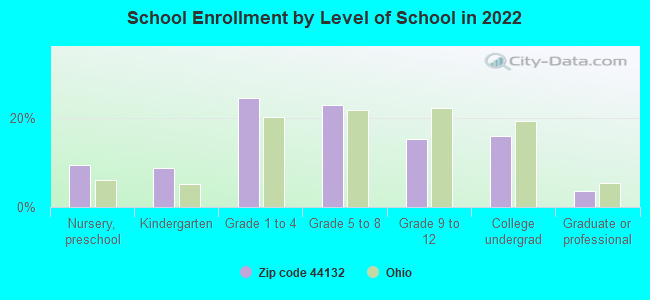
Private vs. public school enrollment:
Students in private schools in grades 1 to 8 (elementary and middle school): 311
Here:
19.9%
Ohio:
16.0%
Students in private schools in grades 9 to 12 (high school): 194
Here:
38.1%
Ohio:
13.1%
Students in private undergraduate colleges: 65
Here:
12.4%
Ohio:
22.3%
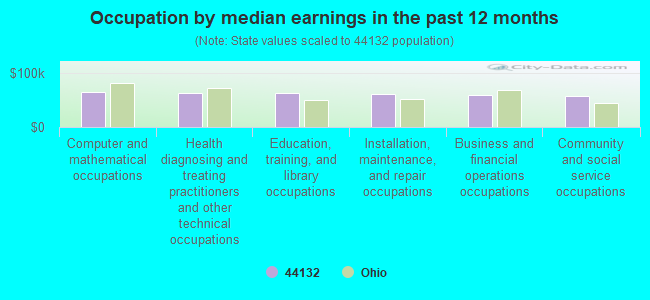
Occupation by median earnings in the past 12 months ($)
64,847Computer and mathematical occupations
62,922Health diagnosing and treating practitioners and other technical occupations
62,559Education, training, and library occupations
61,606Installation, maintenance, and repair occupations
59,309Business and financial operations occupations
58,249Community and social service occupations
Companies with federal contracts located in this zip code:
THE PAQUIN COMPANY (26981 LAKELAND BLVD in CLEVELAND, OH; small business) : $166,387 in 20 contractsfrom 2004 to 2006
Contracts for Valves, Nonpowered, Switches, Valves, Powered, O-Ring by Defense Logistics Agency Signed by year:2000: $0; 2001: $0; 2002: $0; 2003: $0; 2004: $5,915; 2005: $75,472; 2006: $85,000.
Biggest contracts:
$53,326 with Defense Logistics Agency for Valves, Nonpowered. Signed on 2006-05-13. Completion date: 2006-07-01.
$12,337, same as above.Signed on 2005-05-25. Completion date: 2005-07-17.
$9,633 with Defense Logistics Agency for Switches. Signed on 2006-04-26. Completion date: 2006-06-26.
$9,174 with Defense Logistics Agency for Valves, Nonpowered. Signed on 2005-02-07. Completion date: 2005-05-09.
HANLON INDUSTRIES INC (1280 E 286TH ST in CLEVELAND, OH; small business) : $147,731 in 8 contractsfrom 2001 to 2006
Contracts for Armament Training Devices, Glass Fabricated Materials, Plastics Fabricated Materials, Training Aids, and moreby Army, Defense Logistics Agency Signed by year:2000: $0; 2001: $37,659; 2002: $75,347; 2003: $0; 2004: $14,832; 2005: $3,662; 2006: $16,231.
Biggest contracts:
$79,505 with Army for Armament Training Devices. Taking place in WI. Signed on 2002-09-28. Completion date: 2002-11-08.
$37,659 with Army for Glass Fabricated Materials. Signed on 2001-09-06. Completion date: 2001-11-20.
$16,231 with Army for Plastics Fabricated Materials. Signed on 2006-05-03. Completion date: 2006-08-09.
$7,872 with Army for Training Aids. Signed on 2004-01-30. Completion date: 2004-02-27.
NORTHEAST BLUEPRINT & SUPPLY C (1230 E 286TH ST in CLEVELAND, OH; small business) : $10,049 in 10 contractsfrom 2004 to 2006
Contracts for Reproduction Services, Printing, Duplicating, and Bookbinding Equipment, Chemicals by U.S. Army Corps of Engineers - civil program financing only, Army Signed by year:2000: $0; 2001: $0; 2002: $0; 2003: $0; 2004: $550; 2005: $9,413; 2006: $86.
Biggest contracts:
$3,385 with U.S. Army Corps of Engineers - civil program financing only for Reproduction Services. Taking place in MD. Signed on 2005-08-18. Completion date: 2005-09-30.
$3,385 with Army for Reproduction Services. Taking place in MD. Signed on 2005-08-18. Completion date: 2005-09-30.
$1,645 with Army for Printing, Duplicating, and Bookbinding Equipment. Signed on 2005-05-02. Completion date: 2005-05-04.
$380 with Army for Reproduction Services. Taking place in MD. Signed on 2005-06-21. Completion date: 2005-09-30.
Top industries in this zip code by the number of employees in 2005:
2002 - 2018 National Fire Incident Reporting System (NFIRS) incidents
Based on the data from the years 2002 - 2018 the average number of fires per year is 57. The highest number of reported fires - 83 took place in 2002, and the least - 39 in 2013. The data has a declining trend.
When looking into fire subcategories, the most reports belonged to: Structure Fires (38.7%), and Outside Fires (29.3%).
Fire incident types reported to NFIRS in Zip Code 44132


 Nearest zip codes: 44123, 44092, 44117, 44119, 44143, 44095.
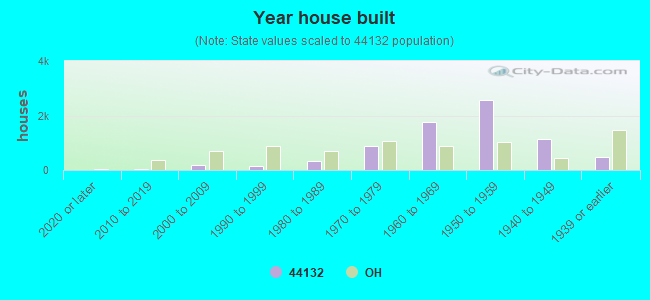


 Based on the data from the years 2002 - 2018 the average number of fires per year is 57. The highest number of reported fires - 83 took place in 2002, and the least - 39 in 2013. The data has a declining trend.
 When looking into fire subcategories, the most reports belonged to: Structure Fires (38.7%), and Outside Fires (29.3%).