Estimated zip code population in 2022: 24,194 Zip code population in 2010: 24,499 Zip code population in 2000: 23,730
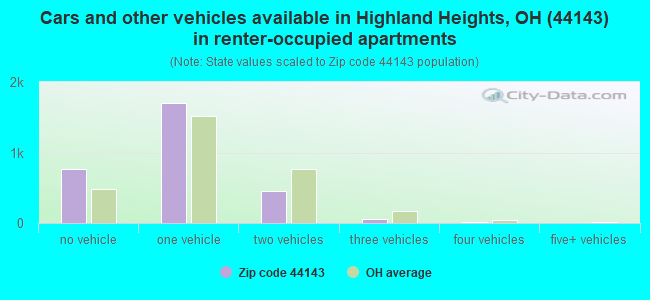
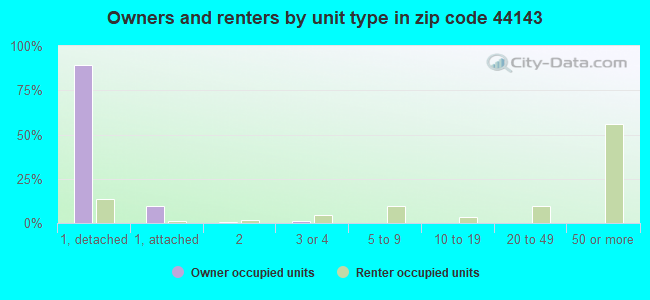
Houses and condos: 11,832 Renter-occupied apartments: 2,977
% of renters here:
27%
State:
33%
March 2022 cost of living index in zip code 44143: 95.5 (near average, U.S. average is 100)
Land area: 14.1 sq. mi. Water area: 0.0 sq. mi.
Population density: 1,720 people per square mile
(low).
OSM Map
General Map
Google Map
MSN Map
OSM Map
General Map
Google Map
MSN Map
OSM Map
General Map
Google Map
MSN Map
OSM Map
General Map
Google Map
MSN Map
Please wait while loading the map...
Real estate property taxes paid for housing units in 2022:
This zip code:
2.1% ($5,457)
Ohio:
1.3% ($2,639)
Median real estate property taxes paid for housing units with mortgages in 2022: $5,446 (2.0%) Median real estate property taxes paid for housing units with no mortgage in 2022: $5,501 (2.3%)
Estimated median house/condo value in 2022: $263,894
44143:
$263,894
Ohio:
$204,100
According to our research of Ohio and other state lists, there were 8 registered sex offenders living in 44143 zip code as of April 27, 2024. The ratio of all residents to sex offenders in zip code 44143 is 3,096 to 1. The ratio of registered sex offenders to all residents in this zip code is much lower than the state average.
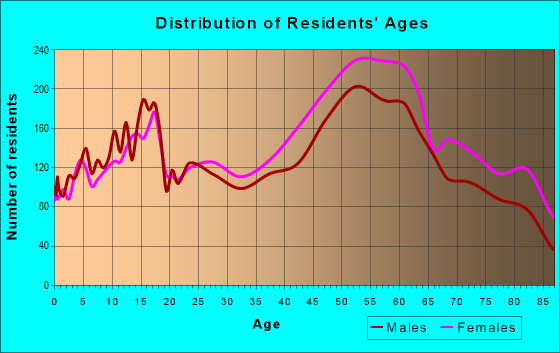
Median resident age:
This zip code:
48.9 years
Ohio median age:
39.9 years
Average household size:
This zip code:
2.1 people
Ohio:
2.4 people
Averages for the 2020 tax year for zip code 44143, filed in 2021:
Average Adjusted Gross Income (AGI) in 2020: $82,929 (Individual Income Tax Returns)
Here:
$82,929
State:
$67,288
Salary/wage: $68,565 (reported on 78.0% of returns)
Here:
$68,565
State:
$55,628
(% of AGI for various income ranges: 1164.9% for AGIs below $25k, 3703.2% for AGIs $25k-50k, 6736.2% for AGIs $50k-75k, 9832.9% for AGIs $75k-100k, 18501.0% for AGIs $100k-200k, 83192.6% for AGIs over 200k)
Taxable interest for individuals: $2,162 (reported on 35.9% of returns)
This zip code:
$2,162
Ohio:
$1,518
(% of AGI for various income ranges: 27.2% for AGIs below $25k, 39.9% for AGIs $25k-50k, 82.0% for AGIs $50k-75k, 144.6% for AGIs $75k-100k, 274.3% for AGIs $100k-200k, 1270.4% for AGIs over 200k)
Ordinary dividends: $7,908 (reported on 29.4% of returns)
Here:
$7,908
State:
$7,167
(% of AGI for various income ranges: 52.7% for AGIs below $25k, 76.3% for AGIs $25k-50k, 173.6% for AGIs $50k-75k, 333.9% for AGIs $75k-100k, 655.3% for AGIs $100k-200k, 5759.6% for AGIs over 200k)
Net capital gain/loss in AGI: +$18,524 (reported on 25.4% of returns)
Here:
+$18,524
State:
+$18,919
(% of AGI for various income ranges: 16.0% for AGIs below $25k, 67.5% for AGIs $25k-50k, 129.5% for AGIs $50k-75k, 344.7% for AGIs $75k-100k, 837.0% for AGIs $100k-200k, 17223.3% for AGIs over 200k)
Profit/loss from business: +$13,056 (reported on 16.6% of returns)
Here:
+$13,056
State:
+$13,744
(% of AGI for various income ranges: 42.6% for AGIs below $25k, 93.8% for AGIs $25k-50k, 182.4% for AGIs $50k-75k, 254.3% for AGIs $75k-100k, 749.1% for AGIs $100k-200k, 4736.3% for AGIs over 200k)
Taxable individual retirement arrangement distribution: $23,045 (reported on 13.5% of returns)
44143:
$23,045
Ohio:
$18,876
(% of AGI for various income ranges: 80.3% for AGIs below $25k, 176.2% for AGIs $25k-50k, 371.7% for AGIs $50k-75k, 799.1% for AGIs $75k-100k, 1218.3% for AGIs $100k-200k, 3826.7% for AGIs over 200k)
Self-employed (Keogh) retirement plans: $24,264 (reported on 0.8% of returns)
44143:
$24,264
Ohio:
$24,898
(% of AGI for various income ranges: 54.8% for AGIs $100k-200k, 753.0% for AGIs over 200k)
Total itemized deductions: $28,612 (reported on 11.6% of returns)
Here:
$28,612
State:
$33,869
(% of AGI for various income ranges: 91.6% for AGIs below $25k, 193.1% for AGIs $25k-50k, 523.0% for AGIs $50k-75k, 882.8% for AGIs $75k-100k, 1002.2% for AGIs $100k-200k, 4582.6% for AGIs over 200k)
Charity contributions: $9,174 (reported on 9.8% of returns)
Here:
$9,174
State:
$14,577
(% of AGI for various income ranges: 6.4% for AGIs below $25k, 20.2% for AGIs $25k-50k, 97.2% for AGIs $50k-75k, 192.3% for AGIs $75k-100k, 246.9% for AGIs $100k-200k, 2107.0% for AGIs over 200k)
Taxes paid: $8,283 (reported on 11.5% of returns)
44143:
$8,283
State:
$7,681
(% of AGI for various income ranges: 17.3% for AGIs below $25k, 45.6% for AGIs $25k-50k, 164.8% for AGIs $50k-75k, 313.4% for AGIs $75k-100k, 346.0% for AGIs $100k-200k, 981.1% for AGIs over 200k)
Earned income credit: $2,025 (reported on 9.6% of returns)
Here:
$2,025
State:
$2,304
(% of AGI for various income ranges: 69.0% for AGIs below $25k, 45.6% for AGIs $25k-50k)
Percentage of individuals using paid preparers for their 2020 taxes: 90.6%
Here:
91%
State:
94%
(% for various income ranges: 89.8% for AGIs below $25k, 91.1% for AGIs $25k-50k, 90.5% for AGIs $50k-75k, 90.1% for AGIs $75k-100k, 91.3% for AGIs $100k-200k, 91.3% for AGIs over 200k)
Averages for the 2012 tax year for zip code 44143, filed in 2013:
Average Adjusted Gross Income (AGI) in 2012: $69,052 (Individual Income Tax Returns)
Here:
$69,052
State:
$54,926
Salary/wage: $58,896 (reported on 79.6% of returns)
Here:
$58,896
State:
$45,869
(% of AGI for various income ranges: 67.5% for AGIs below $25k, 71.3% for AGIs $25k-50k, 69.9% for AGIs $50k-75k, 68.5% for AGIs $75k-100k, 73.0% for AGIs $100k-200k, 61.2% for AGIs over 200k)
Taxable interest for individuals: $2,131 (reported on 43.3% of returns)
This zip code:
$2,131
Ohio:
$1,297
(% of AGI for various income ranges: 2.6% for AGIs below $25k, 1.3% for AGIs $25k-50k, 1.1% for AGIs $50k-75k, 0.9% for AGIs $75k-100k, 1.0% for AGIs $100k-200k, 1.7% for AGIs over 200k)
Ordinary dividends: $6,744 (reported on 31.9% of returns)
Here:
$6,744
State:
$5,821
(% of AGI for various income ranges: 3.7% for AGIs below $25k, 2.6% for AGIs $25k-50k, 2.0% for AGIs $50k-75k, 2.2% for AGIs $75k-100k, 2.6% for AGIs $100k-200k, 4.5% for AGIs over 200k)
Net capital gain/loss in AGI: +$5,614 (reported on 24.4% of returns)
Here:
+$5,614
State:
+$11,232
(% of AGI for various income ranges: 0.1% for AGIs $25k-50k, 0.4% for AGIs $50k-75k, 0.8% for AGIs $75k-100k, 1.3% for AGIs $100k-200k, 4.9% for AGIs over 200k)
Profit/loss from business: +$15,640 (reported on 15.0% of returns)
Here:
+$15,640
State:
+$12,773
(% of AGI for various income ranges: 6.7% for AGIs below $25k, 3.1% for AGIs $25k-50k, 2.7% for AGIs $50k-75k, 3.1% for AGIs $75k-100k, 3.0% for AGIs $100k-200k, 3.8% for AGIs over 200k)
Taxable individual retirement arrangement distribution: $16,092 (reported on 15.9% of returns)
44143:
$16,092
Ohio:
$14,511
(% of AGI for various income ranges: 6.0% for AGIs below $25k, 4.4% for AGIs $25k-50k, 4.2% for AGIs $50k-75k, 4.9% for AGIs $75k-100k, 4.3% for AGIs $100k-200k, 1.8% for AGIs over 200k)
Self-employment retirement plans: $19,108 (reported on 0.9% of returns)
44143:
$19,108
Ohio:
$20,257
(% of AGI for various income ranges: 0.2% for AGIs $50k-75k, 0.2% for AGIs $100k-200k, 0.6% for AGIs over 200k)
Total itemized deductions: $23,377 (20% of AGI, reported on 44.8% of returns)
Here:
$23,377
State:
$21,278
Here:
19.8% of AGI
State:
18.8% of AGI
(% of AGI for various income ranges: 14.0% for AGIs below $25k, 14.6% for AGIs $25k-50k, 15.9% for AGIs $50k-75k, 16.8% for AGIs $75k-100k, 17.1% for AGIs $100k-200k, 13.1% for AGIs over 200k)
Charity contributions: $3,732 (reported on 38.3% of returns)
Here:
$3,732
State:
$3,943
(% of AGI for various income ranges: 1.0% for AGIs below $25k, 1.7% for AGIs $25k-50k, 2.0% for AGIs $50k-75k, 2.2% for AGIs $75k-100k, 2.4% for AGIs $100k-200k, 2.2% for AGIs over 200k)
Taxes paid: $11,906 (reported on 44.7% of returns)
44143:
$11,906
State:
$9,568
(% of AGI for various income ranges: 4.2% for AGIs below $25k, 5.1% for AGIs $25k-50k, 6.7% for AGIs $50k-75k, 7.9% for AGIs $75k-100k, 9.2% for AGIs $100k-200k, 8.5% for AGIs over 200k)
Earned income credit: $2,020 (reported on 11.0% of returns)
Here:
$2,020
State:
$2,285
(% of AGI for various income ranges: 4.5% for AGIs below $25k, 0.6% for AGIs $25k-50k)
Percentage of individuals using paid preparers for their 2012 taxes: 54.3%
Here:
54%
State:
51%
(% for various income ranges: 47.3% for AGIs below $25k, 54.3% for AGIs $25k-50k, 59.0% for AGIs $50k-75k, 59.5% for AGIs $75k-100k, 56.1% for AGIs $100k-200k, 74.2% for AGIs over 200k)
Averages for the 2004 tax year for zip code 44143, filed in 2005:
Average Adjusted Gross Income (AGI) in 2004: $58,081 (Individual Income Tax Returns)
Here:
$58,081
State:
$44,480
Salary/wage: $50,744 (reported on 79.9% of returns)
Here:
$50,744
State:
$39,198
(% of AGI for various income ranges: 103.0% for AGIs below $10k, 65.1% for AGIs $10k-25k, 74.0% for AGIs $25k-50k, 74.3% for AGIs $50k-75k, 76.4% for AGIs $75k-100k, 64.9% for AGIs over 100k)
Taxable interest for individuals: $2,378 (reported on 59.5% of returns)
This zip code:
$2,378
Ohio:
$1,532
(% of AGI for various income ranges: 10.5% for AGIs below $10k, 4.8% for AGIs $10k-25k, 2.8% for AGIs $25k-50k, 2.2% for AGIs $50k-75k, 2.1% for AGIs $75k-100k, 2.1% for AGIs over 100k)
Taxable dividends: $3,181 (reported on 39.8% of returns)
Here:
$3,181
State:
$3,496
(% of AGI for various income ranges: 8.7% for AGIs below $10k, 3.1% for AGIs $10k-25k, 2.1% for AGIs $25k-50k, 2.0% for AGIs $50k-75k, 1.8% for AGIs $75k-100k, 2.1% for AGIs over 100k)
Net capital gain/loss: +$6,894 (reported on 31.3% of returns)
Here:
+$6,894
State:
+$8,582
(% of AGI for various income ranges: -4.7% for AGIs below $10k, 0.4% for AGIs $10k-25k, 0.7% for AGIs $25k-50k, 1.3% for AGIs $50k-75k, 0.8% for AGIs $75k-100k, 6.9% for AGIs over 100k)
Profit/loss from business: +$15,956 (reported on 14.3% of returns)
Here:
+$15,956
State:
+$10,813
(% of AGI for various income ranges: 8.6% for AGIs below $10k, 5.7% for AGIs $10k-25k, 3.5% for AGIs $25k-50k, 3.4% for AGIs $50k-75k, 3.8% for AGIs $75k-100k, 4.0% for AGIs over 100k)
IRA payment deduction: $3,397 (reported on 3.7% of returns)
44143:
$3,397
Ohio:
$2,794
(% of AGI for various income ranges: 0.4% for AGIs below $10k, 0.3% for AGIs $10k-25k, 0.4% for AGIs $25k-50k, 0.3% for AGIs $50k-75k, 0.2% for AGIs $75k-100k, 0.1% for AGIs over 100k)
Self-employed pension: $15,295 (reported on 1.4% of returns)
Here:
$15,295
Ohio:
$13,981
(% of AGI for various income ranges: 0.2% for AGIs $25k-50k, 0.2% for AGIs $50k-75k, 0.2% for AGIs $75k-100k, 0.6% for AGIs over 100k)
Total itemized deductions: $20,246 (21% of AGI, reported on 47.0% of returns)
Here:
$20,246
State:
$17,503
Here:
20.6% of AGI
State:
20.8% of AGI
(% of AGI for various income ranges: 19.7% for AGIs below $10k, 14.8% for AGIs $10k-25k, 15.7% for AGIs $25k-50k, 19.4% for AGIs $50k-75k, 19.3% for AGIs $75k-100k, 14.8% for AGIs over 100k)
Charity contributions deductions: $3,329 (3% of AGI, reported on 42.2% of returns)
Here:
$3,329
State:
$3,087
Here:
3.2% of AGI
State:
3.4% of AGI
(% of AGI for various income ranges: 1.4% for AGIs below $10k, 1.4% for AGIs $10k-25k, 1.7% for AGIs $25k-50k, 2.4% for AGIs $50k-75k, 2.5% for AGIs $75k-100k, 2.7% for AGIs over 100k)
Total tax: $10,116 (reported on 78.9% of returns)
44143:
$10,116
State:
$6,781
(% of AGI for various income ranges: 3.2% for AGIs below $10k, 4.3% for AGIs $10k-25k, 7.6% for AGIs $25k-50k, 9.6% for AGIs $50k-75k, 10.9% for AGIs $75k-100k, 19.1% for AGIs over 100k)
Earned income credit: $1,534 (reported on 7.4% of returns)
Here:
$1,534
State:
$1,696
Percentage of individuals using paid preparers for their 2004 taxes: 55.8%
Here:
56%
State:
55%
(% for various income ranges: 49.3% for AGIs below $10k, 56.3% for AGIs $10k-25k, 55.4% for AGIs $25k-50k, 59.0% for AGIs $50k-75k, 57.7% for AGIs $75k-100k, 60.7% for AGIs over 100k)
Likely homosexual households (counted as self-reported same-sex unmarried-partner households)
Lesbian couples: 0.2% of all households
Gay men: 0.1% of all households
Household received Food Stamps/SNAP in the past 12 months: 1,126 Household did not receive Food Stamps/SNAP in the past 12 months: 10,031
Women who had a birth in the past 12 months: 358 (128 now married, 223 unmarried) Women who did not have a birth in the past 12 months: 4,266 (1,710 now married, 2,555 unmarried)
Housing units in zip code 44143 with a mortgage: 4,913 (665 second mortgage, 9 home equity loan, 621 both second mortgage and home equity loan) Houses without a mortgage: 366
Median monthly owner costs for units with a mortgage: $1,789 Median monthly owner costs for units without a mortgage: $807
Residents with income below the poverty level in 2022:
This zip code:
7.1%
Whole state:
13.4%
Residents with income below 50% of the poverty level in 2022:
This zip code:
2.9%
Whole state:
7.0%
Median number of rooms in houses and condos:
Here:
7.3
State:
6.7
Median number of rooms in apartments:
Here:
3.7
State:
4.4
Notable locations in this zip code not listed on our city pages
Notable locations in zip code 44143: Kelley Picnic Area (A), Rear Quarry Picnic Area (B), Forest Picnic Area (C), North Chagrin Nature Center (D), Richmond Heights Fire Department (E), City of Highland Heights Fire Department (F), Mayfield Village Fire Department (G), Highland Heights City Hall (H), Mayfield Town Hall (I), Richmond Heights City Hall (J). Display/hide their locations on the map
Streams, rivers, and creeks: Claribel Creek (A), East Branch of Euclid Creek (B), Redstone Run (C), Stevenson Brook (D), Verbsky Creek (E). Display/hide their locations on the map
In group quarters: 435 (-1 institutionalized population)
Size of family households: 3,217 2-persons, 1,774 3-persons, 854 4-persons, 440 5-persons, 47 6-persons, 43 7-or-more-persons
Size of nonfamily households: 4,436 1-person, 345 2-persons, 9 4-persons
2,790 married couples with children.
1,070 single-parent households (516 men, 554 women).
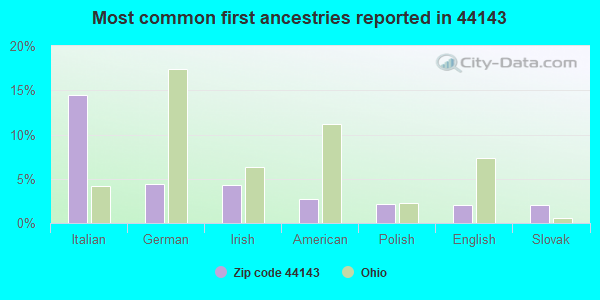
86.3% of residents of 44143 zip code speak English at home.
2.4% of residents speak Spanish at home (90% very well, 2% well, 8% not well).
7.5% of residents speak other Indo-European language at home (69% very well, 19% well, 12% not well).
1.3% of residents speak Asian or Pacific Island language at home (93% very well, 5% well, 3% not well).
3.5% of residents speak other language at home (83% very well, 11% well, 6% not well).
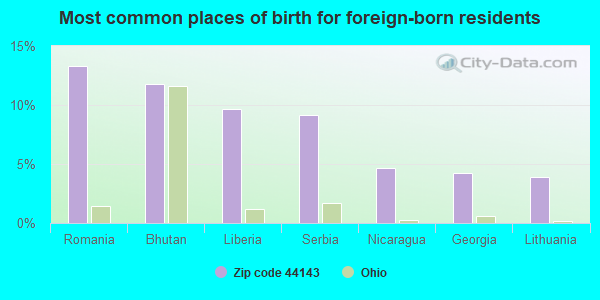
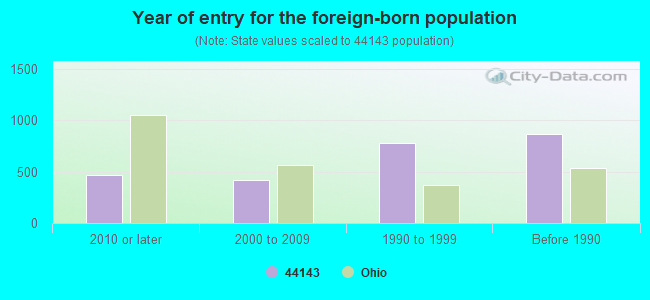
Foreign born population: 2,365 (9.8%) (78.2% of them are naturalized citizens)
Facilities with environmental interests located in this zip code:
BP AMOCO CO 29251 * (6267 WILSON MILLS RD in HIGHLAND HEIGHTS, OH)
AIR MINOR (AIRS/AFS) STATE MASTER (Ohio general info) - AIR MAJOR STATE MASTER (Ohio general info) - -18-5541-905-39, EPCRA, RCRA-OHD987026663, HAZARDOUS WASTE PROGRAM Conditionally Exempt Small Quantity Generators, less than 100 kg/month of hazardous waste (Resource Conservation and Recovery Act (tracking hazardous waste)) - notification Business SIC classification: GASOLINE SERVICE STATIONS Organizations: BP OIL CO (CONTACT/OWNER)
, BP OIL COMPANY (CONTACT/OWNER)
Alternative names: BP AMOCO #04744/#29251, BP OIL CO NO 04744, BP OIL CO SITE 04744, SOHIO OIL CO 04744
BP AMOCO CO 22417 (775 RICHMOND RD in RICHMOND HEIGHTS, OH)
AIR MINOR (AIRS/AFS) STATE MASTER (Ohio general info) - -18-5541-905-25, EPCRA STATE MASTER (Ohio general info) - RCRA-OHD987015138, HAZARDOUS WASTE PROGRAM, AIR MAJOR Conditionally Exempt Small Quantity Generators, less than 100 kg/month of hazardous waste (Resource Conservation and Recovery Act (tracking hazardous waste)) - notification Business SIC classification: GASOLINE SERVICE STATIONS Organizations: BP OIL CO (CONTACT/OWNER)
, BP OIL COMPANY (CONTACT/OWNER)
Alternative names: BP AMOCO # 22417 WAS #04887, BP OIL CO, BP OIL CO NO 04887
AMOCO FASTCHECK * (5567 WILSON MILLS RD in HIGHLAND HEIGHTS, OH)
STATE MASTER (Ohio general info) - RCRA-OHR000030965, HAZARDOUS WASTE PROGRAM, AIR MAJOR STATE MASTER (Ohio general info) - -18-5541-943-7, EPCRA Conditionally Exempt Small Quantity Generators, less than 100 kg/month of hazardous waste (Resource Conservation and Recovery Act (tracking hazardous waste)) - notification Organizations: THE LYDEN CO (CONTACT/OWNER)
, LYDEN COMPANY (CONTACT/OWNER)
Alternative names: HIGHLAND HEIGHT FAST CHECK
CEI MAYFIELD SERVICE CENTER * (681 BETA DR in MAYFIELD VILLAGE, OH)
STATE MASTER (Ohio general info) - RCRA-OHD987023553, HAZARDOUS WASTE PROGRAM STATE MASTER (Ohio general info) - -18-4911-895-2, EPCRA Conditionally Exempt Small Quantity Generators, less than 100 kg/month of hazardous waste (Resource Conservation and Recovery Act (tracking hazardous waste)) - notification Organizations: CENTERIOR ENERGY CORPORATION (CONTACT/OWNER)
BODYCOTE SHORE (5475 AVION PARK DR. in HIGHLAND HEIGHTS, OH)
STATE MASTER (Ohio general info) - EPCRA, TRIS-44143BDCTS5475A, TRI REPORTER Small Quantity Generators, between 100 kg and 1000 kg of hazardous waste/month (Resource Conservation and Recovery Act (tracking hazardous waste)) - notification TRI REPORTER (Tracking of toxic chemicals releasing facilities) Business SIC classification: METAL HEAT TREATING Organizations: BODYCOTE NORTH AMERICA INC (CONTACT/OWNER)
Alternative names: BODYCOTE THERMAL PROCESSING HIGHLAND HEIGHTS
ALLEN-BADLEY CO INC (747 ALPHA DRIVE in CLEVELAND, OH)
STATE MASTER (Ohio general info) - AIR MAJOR Small Quantity Generators, between 100 kg and 1000 kg of hazardous waste/month (Resource Conservation and Recovery Act (tracking hazardous waste)) - notification Alternative names: ALLEN BRADLEY CO
B & B MARATHON (26005 CHARDON RD in RICHMOND HEIGHTS, OH)
AIR MINOR (AIRS/AFS) STATE MASTER (Ohio general info) - AIR MAJOR, -18-5541-076-3, EPCRA, RCRA-OHD000815571, HAZARDOUS WASTE PROGRAM Business SIC classification: GASOLINE SERVICE STATIONS
CENTERIOR ENERGY BETA LABORATORY (6670 BETA DR in MAYFIELD VILLAGE, OH)
STATE MASTER (Ohio general info) - RCRA-OHD987045556, HAZARDOUS WASTE PROGRAM Conditionally Exempt Small Quantity Generators, less than 100 kg/month of hazardous waste (Resource Conservation and Recovery Act (tracking hazardous waste)) - notification Organizations: CENTERIOR ENERGY CORPORATION (CONTACT/OWNER)
ACME CLEVELAND DEVELOPMENT CO (625 ALPHA DR in HIGHLAND HEIGHTS, OH)
(Resource Conservation and Recovery Act (tracking hazardous waste))
BODYCOTE THERMAL PROCESSING HIGHLAND HTS. (5475 AVION PARK DR. in HIGHLAND HEIGHTS, OH)
CRITERIA AND HAZARDOUS AIR POLLUTANT INVENTORY (Inventory of air pollution sources) Business SIC classification: METAL HEAT TREATING
Housing units lacking complete plumbing facilities: 0.9% Housing units lacking complete kitchen facilities: 2.0%
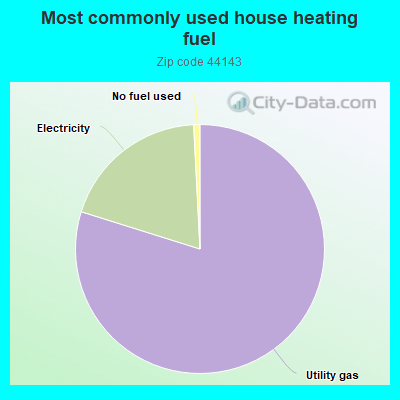
79.2%Utility gas
19.2%Electricity
0.8%No fuel used
Population in 1990: 21,114. Population change in the 1990s: +2,616 (+12.4%).
Place of birth for U.S.-born residents:
This state: 18,001
Northeast: 1,198
Midwest: 557
South: 1,359
West: 465
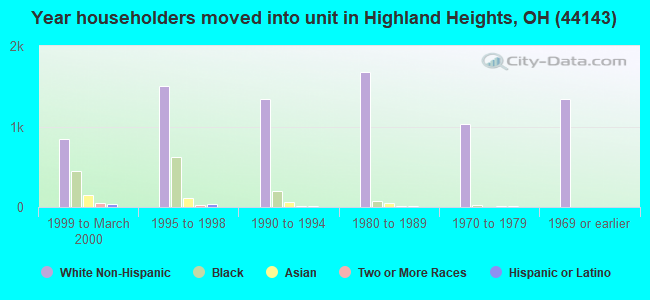
66% of the 44143 zip code residents lived in the same house 5 years ago. Out of people who lived in different houses, 71% lived in this county. Out of people who lived in different counties, 50% lived in Ohio.
92% of the 44143 zip code residents lived in the same house 1 year ago. Out of people who lived in different houses, 66% moved from this county. Out of people who lived in different houses, 26% moved from different county within same state. Out of people who lived in different houses, 2% moved from different state. Out of people who lived in different houses, 5% moved from abroad.
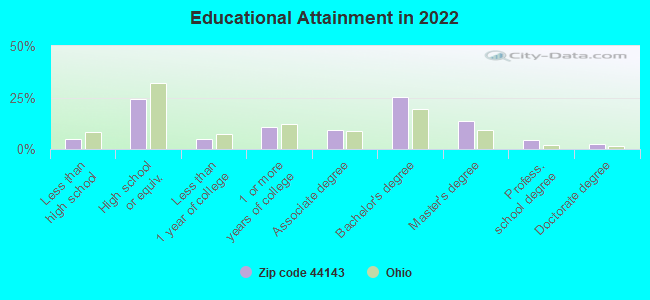
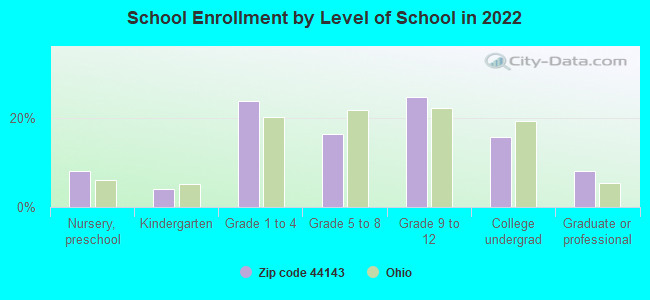
Private vs. public school enrollment:
Students in private schools in grades 1 to 8 (elementary and middle school): 517
Here:
25.7%
Ohio:
16.0%
Students in private schools in grades 9 to 12 (high school): 272
Here:
22.3%
Ohio:
13.1%
Students in private undergraduate colleges: 230
Here:
29.8%
Ohio:
22.3%
Occupation by median earnings in the past 12 months ($)
120,890Legal occupations
110,088Health diagnosing and treating practitioners and other technical occupations
96,198Architecture and engineering occupations
96,079Computer and mathematical occupations
91,228Management occupations
78,598Life, physical, and social science occupations
Companies with biggest federal contracts located in this zip code:
TRANSDIGM INC (26380 CURTISS WRIGHT PKWY in CLEVELAND, OH) : $22,574,279 in 390 contractsfrom 1999 to 2006
Contracts for Miscellaneous Vehicular Components, Miscellaneous Engine Accessories, Aircraft, Miscellaneous Aircraft Accessories and Components, Valves, Powered, and moreby Army, Defense Logistics Agency, Navy, Air Force, and others Signed by year:2000: $4,124,698; 2001: $3,534,643; 2002: $3,391,395; 2003: $1,009,038; 2004: $5,691,708; 2005: $3,746,667; 2006: $527,483.
Biggest contracts:
$1,068,059 with Army for Miscellaneous Vehicular Components. Signed on 2004-04-06. Completion date: 2005-11-28.
$441,882 with Defense Logistics Agency for Miscellaneous Engine Accessories, Aircraft. Signed on 2002-09-16. Completion date: 2003-02-10.
$335,956 with Defense Logistics Agency for Miscellaneous Aircraft Accessories and Components. Signed on 2000-02-29. Completion date: 2000-06-28.
$329,425 with Army for Valves, Powered. Signed on 2000-01-21. Completion date: 2000-05-31.
PHILIPS MEDICAL SYSTEMS (595 MINER ROAD in HIGHLAND HEIGH, OH) : $5,061,684 in 51 contractsfrom 1999 to 2005
Contracts for X-Ray Equipment and Supplies: Medical, Dental, Veterinary, Maintenance, Repair and Rebuilding of Equipment -- Medical, Dental, and Veterinary Equipment and Supplies, Maintenance, Repair or Alteration of Real Property -- Other Non-Building Facilities, Medical and Surgical Instruments, Equipment, and Supplies, and moreby Defense Logistics Agency, Navy, Army Signed by year:2000: $99,040; 2001: $143,183; 2002: $399,110; 2003: $230,209; 2004: $3,842,880; 2005: $9,667; 2006: $0.
Biggest contracts:
$820,863 with Defense Logistics Agency for X-Ray Equipment and Supplies: Medical, Dental, Veterinary. Signed on 2004-03-18. Completion date: 2004-03-28.
$456,035, same as above.Signed on 2004-09-02. Completion date: 2004-09-16.
$364,828, same as above.Signed on 2004-07-10. Completion date: 2004-08-11.
$352,456, same as above.Signed on 2004-08-11. Completion date: 2004-10-09.
HEALTH CARE PRODUCTS, A DIVISI (595 MINER ROAD in HIGHLAND HEIGH, OH; small business) : $1,428,158 in 22 contractsfrom 2000 to 2006
Contracts for X-Ray Equipment and Supplies: Medical, Dental, Veterinary, Maintenance, Repair and Rebuilding of Equipment -- Instruments and Laboratory Equipment, Maintenance, Repair and Rebuilding of Equipment -- Medical, Dental, and Veterinary Equipment and Supplies, Hospital Furniture, Equipment, Utensils, and Supplies, and moreby Navy, Air Force, Army, Department of Veterans Affairs, and others Signed by year:2000: $847,942; 2001: $263,039; 2002: $266,530; 2003: $50,919; 2004: $0; 2005: $0; 2006: -$272.
Biggest contracts:
$369,900 with Navy for X-Ray Equipment and Supplies: Medical, Dental, Veterinary. Taking place in NC. Signed on 2000-02-08. Completion date: 2000-09-30.
$184,950, same as above.Signed on 2000-10-01. Completion date: 2001-03-31.
$154,125, same as above.Signed on 2001-04-04. Completion date: 2001-04-30.
$136,260 with Air Force for Maintenance, Repair and Rebuilding of Equipment -- Instruments and Laboratory Equipment. Taking place in TX. Signed on 2000-10-12. Completion date: 2001-09-30.
INERTIAL AIRLINE SERVICES, INC (375 ALPHA PARK in HIGHLAND HEIGH, OH; small business) : $531,250 in 5 contractsfrom 2000 to 2001
Contracts for Miscellaneous Aircraft Accessories and Components by Navy Signed by year:2000: $137,500; 2001: $393,750; 2002: $0; 2003: $0; 2004: $0; 2005: $0; 2006: $0.
Biggest contracts:
$231,250 with Navy for Miscellaneous Aircraft Accessories and Components. Signed on 2001-04-11. Completion date: 2002-04-11.
$93,750, same as above.Signed on 2001-10-17. Completion date: 2002-10-16.
$68,750, same as above.Signed on 2000-12-04. Completion date: 2001-04-05.
$68,750, same as above.Signed on 2001-03-01. Completion date: 2001-09-01.
CLEVELAND CRYSTALS INC (676 ALPHA DR in CLEVELAND, OH; small business) : $203,602 in 10 contractsfrom 2001 to 2005
Contracts for Engineering and Technical Services, Optical Instruments, Test Equipment, Components and Accessories, , Crystal and Glass Industries Machinery, and moreby Army, National Institute of Standards and Technology, Navy, NASA, and others Signed by year:2000: $0; 2001: $57,000; 2002: $0; 2003: $97,170; 2004: $43,720; 2005: $5,712; 2006: $0.
Biggest contracts:
$97,170 with Army for Engineering and Technical Services. Signed on 2003-06-30. Completion date: 2003-12-31.
$57,000 with National Institute of Standards and Technology for Optical Instruments, Test Equipment, Components and Accessories. Signed on 2001-09-15. Completion date: 2002-01-15.
$14,756 with Navy for Optical Instruments, Test Equipment, Components and Accessories. Signed on 2004-05-12. Completion date: 2004-07-09.
$7,196, same as above.Signed on 2004-09-21. Completion date: 2004-11-17.
PHILIPS MEDICAL SYSTEMS CLEVEL (595 MINER RD in CLEVELAND, OH) : $169,775 in 2 contractsfrom 2000 to 2004
$144,000 with Department of Veterans Affairs for X-Ray Equipment and Supplies: Medical, Dental, Veterinary. Taking place in CA. Signed on 2000-09-15. Completion date: 2000-10-15.
$25,775 with Defense Logistics Agency for X-Ray Equipment and Supplies: Medical, Dental, Veterinary. Signed on 2004-04-24. Completion date: 2004-05-08.
EIGHTH DAY SOUND SYSTEMS INC (5450 AVION PARK DRIVE in HIGHLAND HEIGH, OH) : $162,385 in 3 contractsfrom 2000 to 2003
$91,000 with EXECUTIVE OFFICE OF THE PRESIDENT for Audio/Visual Services. Signed on 2003-09-15. Completion date: 2003-09-15.
$42,085 with Army for Lease or Rental of Equipment -- Weapons. Signed on 2003-09-09. Completion date: 2003-09-12.
$29,300 with Air Force for Patent and Trademark Services. Taking place in DC. Signed on 2000-07-15. Completion date: 2000-09-02.
NATIONAL TESTING LABORATORIES, (6555 WILSON MILLS RD , SUI in CLEVELAND, OH; small business) : $101,974 in 2 contractsfrom 2000 to 2002
$52,630 with Army for Laboratory Testing Services. Taking place in MD. Signed on 2002-03-27. Completion date: 2003-03-31.
$49,344, same as above.Signed on 2000-05-26. Completion date: 2001-05-31.
MERRILL COMMUNICATIONS LLC (739 BETA BUSINESS MALL in CLEVELAND, OH; small business) : $96,695 in 3 contractsfrom 2002 to 2004
$36,089 with Air Force for Other ADP and Telecommunications Services (includes data storage on tapes, compact disks, etc.). Signed on 2002-03-12. Completion date: 2002-12-31.
$34,632 with Air Force for ADPE System Configuration. Signed on 2003-02-24. Completion date: 2004-02-18.
$25,974 with Air Force for ADP Software. Signed on 2004-01-12. Completion date: 2004-12-31.
INERTIAL AIRLINE SERVICES, INC (26180 CURTISS WRIGHT PKWY in CLEVELAND, OH; small business)
$68,750 with Navy for Miscellaneous Aircraft Accessories and Components. Taking place in KY. Signed on 1999-11-29. Completion date: 2000-02-28.
Top industries in this zip code by the number of employees in 2005:
2002 - 2018 National Fire Incident Reporting System (NFIRS) incidents
Based on the data from the years 2002 - 2018 the average number of fires per year is 95. The highest number of fire incidents - 135 took place in 2012, and the least - 56 in 2010. The data has a rising trend.
When looking into fire subcategories, the most reports belonged to: Structure Fires (59.3%), and Outside Fires (25.1%).
Fire incident types reported to NFIRS in Zip Code 44143
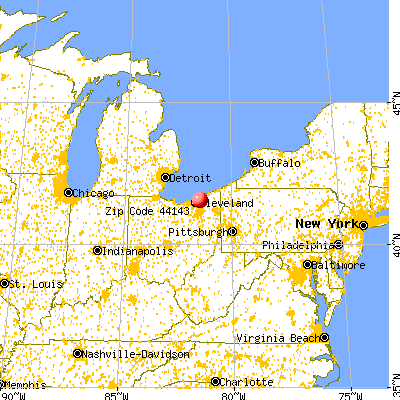


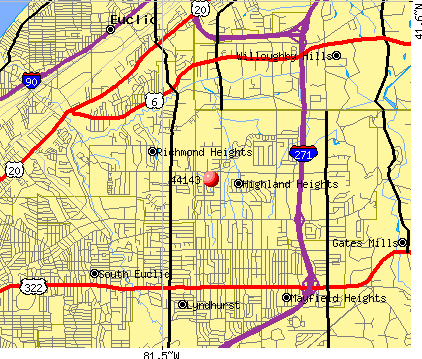 Nearest zip codes: 44092, 44117, 44132, 44124, 44121, 44040.


 Based on the data from the years 2002 - 2018 the average number of fires per year is 95. The highest number of fire incidents - 135 took place in 2012, and the least - 56 in 2010. The data has a rising trend.
 When looking into fire subcategories, the most reports belonged to: Structure Fires (59.3%), and Outside Fires (25.1%).