South Euclid, Ohio Submit your own pictures of this city and show them to the world
OSM Map
General Map
Google Map
MSN Map
OSM Map
General Map
Google Map
MSN Map
OSM Map
General Map
Google Map
MSN Map
OSM Map
General Map
Google Map
MSN Map
Please wait while loading the map...
Population in 2022: 21,395 (100% urban, 0% rural). Population change since 2000: -9.1%Males: 10,832 Females: 10,563
March 2022 cost of living index in South Euclid: 95.2 (less than average, U.S. average is 100) Percentage of residents living in poverty in 2022: 8.9%for White Non-Hispanic residents , 8.7% for Black residents , 10.0% for Hispanic or Latino residents , 36.7% for American Indian residents , 32.8% for other race residents , 4.1% for two or more races residents )
Profiles of local businesses
Business Search - 14 Million verified businesses
Data:
Median household income ($)
Median household income (% change since 2000)
Household income diversity
Ratio of average income to average house value (%)
Ratio of average income to average rent
Median household income ($) - White
Median household income ($) - Black or African American
Median household income ($) - Asian
Median household income ($) - Hispanic or Latino
Median household income ($) - American Indian and Alaska Native
Median household income ($) - Multirace
Median household income ($) - Other Race
Median household income for houses/condos with a mortgage ($)
Median household income for apartments without a mortgage ($)
Races - White alone (%)
Races - White alone (% change since 2000)
Races - Black alone (%)
Races - Black alone (% change since 2000)
Races - American Indian alone (%)
Races - American Indian alone (% change since 2000)
Races - Asian alone (%)
Races - Asian alone (% change since 2000)
Races - Hispanic (%)
Races - Hispanic (% change since 2000)
Races - Native Hawaiian and Other Pacific Islander alone (%)
Races - Native Hawaiian and Other Pacific Islander alone (% change since 2000)
Races - Two or more races (%)
Races - Two or more races (% change since 2000)
Races - Other race alone (%)
Races - Other race alone (% change since 2000)
Racial diversity
Unemployment (%)
Unemployment (% change since 2000)
Unemployment (%) - White
Unemployment (%) - Black or African American
Unemployment (%) - Asian
Unemployment (%) - Hispanic or Latino
Unemployment (%) - American Indian and Alaska Native
Unemployment (%) - Multirace
Unemployment (%) - Other Race
Population density (people per square mile)
Population - Males (%)
Population - Females (%)
Population - Males (%) - White
Population - Males (%) - Black or African American
Population - Males (%) - Asian
Population - Males (%) - Hispanic or Latino
Population - Males (%) - American Indian and Alaska Native
Population - Males (%) - Multirace
Population - Males (%) - Other Race
Population - Females (%) - White
Population - Females (%) - Black or African American
Population - Females (%) - Asian
Population - Females (%) - Hispanic or Latino
Population - Females (%) - American Indian and Alaska Native
Population - Females (%) - Multirace
Population - Females (%) - Other Race
Coronavirus confirmed cases (Apr 27, 2024)
Deaths caused by coronavirus (Apr 27, 2024)
Coronavirus confirmed cases (per 100k population) (Apr 27, 2024)
Deaths caused by coronavirus (per 100k population) (Apr 27, 2024)
Daily increase in number of cases (Apr 27, 2024)
Weekly increase in number of cases (Apr 27, 2024)
Cases doubled (in days) (Apr 27, 2024)
Hospitalized patients (Apr 18, 2022)
Negative test results (Apr 18, 2022)
Total test results (Apr 18, 2022)
COVID Vaccine doses distributed (per 100k population) (Sep 19, 2023)
COVID Vaccine doses administered (per 100k population) (Sep 19, 2023)
COVID Vaccine doses distributed (Sep 19, 2023)
COVID Vaccine doses administered (Sep 19, 2023)
Likely homosexual households (%)
Likely homosexual households (% change since 2000)
Likely homosexual households - Lesbian couples (%)
Likely homosexual households - Lesbian couples (% change since 2000)
Likely homosexual households - Gay men (%)
Likely homosexual households - Gay men (% change since 2000)
Cost of living index
Median gross rent ($)
Median contract rent ($)
Median monthly housing costs ($)
Median house or condo value ($)
Median house or condo value ($ change since 2000)
Mean house or condo value by units in structure - 1, detached ($)
Mean house or condo value by units in structure - 1, attached ($)
Mean house or condo value by units in structure - 2 ($)
Mean house or condo value by units in structure by units in structure - 3 or 4 ($)
Mean house or condo value by units in structure - 5 or more ($)
Mean house or condo value by units in structure - Boat, RV, van, etc. ($)
Mean house or condo value by units in structure - Mobile home ($)
Median house or condo value ($) - White
Median house or condo value ($) - Black or African American
Median house or condo value ($) - Asian
Median house or condo value ($) - Hispanic or Latino
Median house or condo value ($) - American Indian and Alaska Native
Median house or condo value ($) - Multirace
Median house or condo value ($) - Other Race
Median resident age
Resident age diversity
Median resident age - Males
Median resident age - Females
Median resident age - White
Median resident age - Black or African American
Median resident age - Asian
Median resident age - Hispanic or Latino
Median resident age - American Indian and Alaska Native
Median resident age - Multirace
Median resident age - Other Race
Median resident age - Males - White
Median resident age - Males - Black or African American
Median resident age - Males - Asian
Median resident age - Males - Hispanic or Latino
Median resident age - Males - American Indian and Alaska Native
Median resident age - Males - Multirace
Median resident age - Males - Other Race
Median resident age - Females - White
Median resident age - Females - Black or African American
Median resident age - Females - Asian
Median resident age - Females - Hispanic or Latino
Median resident age - Females - American Indian and Alaska Native
Median resident age - Females - Multirace
Median resident age - Females - Other Race
Commute - mean travel time to work (minutes)
Travel time to work - Less than 5 minutes (%)
Travel time to work - Less than 5 minutes (% change since 2000)
Travel time to work - 5 to 9 minutes (%)
Travel time to work - 5 to 9 minutes (% change since 2000)
Travel time to work - 10 to 19 minutes (%)
Travel time to work - 10 to 19 minutes (% change since 2000)
Travel time to work - 20 to 29 minutes (%)
Travel time to work - 20 to 29 minutes (% change since 2000)
Travel time to work - 30 to 39 minutes (%)
Travel time to work - 30 to 39 minutes (% change since 2000)
Travel time to work - 40 to 59 minutes (%)
Travel time to work - 40 to 59 minutes (% change since 2000)
Travel time to work - 60 to 89 minutes (%)
Travel time to work - 60 to 89 minutes (% change since 2000)
Travel time to work - 90 or more minutes (%)
Travel time to work - 90 or more minutes (% change since 2000)
Marital status - Never married (%)
Marital status - Now married (%)
Marital status - Separated (%)
Marital status - Widowed (%)
Marital status - Divorced (%)
Median family income ($)
Median family income (% change since 2000)
Median non-family income ($)
Median non-family income (% change since 2000)
Median per capita income ($)
Median per capita income (% change since 2000)
Median family income ($) - White
Median family income ($) - Black or African American
Median family income ($) - Asian
Median family income ($) - Hispanic or Latino
Median family income ($) - American Indian and Alaska Native
Median family income ($) - Multirace
Median family income ($) - Other Race
Median year house/condo built
Median year apartment built
Year house built - Built 2005 or later (%)
Year house built - Built 2000 to 2004 (%)
Year house built - Built 1990 to 1999 (%)
Year house built - Built 1980 to 1989 (%)
Year house built - Built 1970 to 1979 (%)
Year house built - Built 1960 to 1969 (%)
Year house built - Built 1950 to 1959 (%)
Year house built - Built 1940 to 1949 (%)
Year house built - Built 1939 or earlier (%)
Average household size
Household density (households per square mile)
Average household size - White
Average household size - Black or African American
Average household size - Asian
Average household size - Hispanic or Latino
Average household size - American Indian and Alaska Native
Average household size - Multirace
Average household size - Other Race
Occupied housing units (%)
Vacant housing units (%)
Owner occupied housing units (%)
Renter occupied housing units (%)
Vacancy status - For rent (%)
Vacancy status - For sale only (%)
Vacancy status - Rented or sold, not occupied (%)
Vacancy status - For seasonal, recreational, or occasional use (%)
Vacancy status - For migrant workers (%)
Vacancy status - Other vacant (%)
Residents with income below the poverty level (%)
Residents with income below 50% of the poverty level (%)
Children below poverty level (%)
Poor families by family type - Married-couple family (%)
Poor families by family type - Male, no wife present (%)
Poor families by family type - Female, no husband present (%)
Poverty status for native-born residents (%)
Poverty status for foreign-born residents (%)
Poverty among high school graduates not in families (%)
Poverty among people who did not graduate high school not in families (%)
Residents with income below the poverty level (%) - White
Residents with income below the poverty level (%) - Black or African American
Residents with income below the poverty level (%) - Asian
Residents with income below the poverty level (%) - Hispanic or Latino
Residents with income below the poverty level (%) - American Indian and Alaska Native
Residents with income below the poverty level (%) - Multirace
Residents with income below the poverty level (%) - Other Race
Air pollution - Air Quality Index (AQI)
Air pollution - CO
Air pollution - NO2
Air pollution - SO2
Air pollution - Ozone
Air pollution - PM10
Air pollution - PM25
Air pollution - Pb
Crime - Murders per 100,000 population
Crime - Rapes per 100,000 population
Crime - Robberies per 100,000 population
Crime - Assaults per 100,000 population
Crime - Burglaries per 100,000 population
Crime - Thefts per 100,000 population
Crime - Auto thefts per 100,000 population
Crime - Arson per 100,000 population
Crime - City-data.com crime index
Crime - Violent crime index
Crime - Property crime index
Crime - Murders per 100,000 population (5 year average)
Crime - Rapes per 100,000 population (5 year average)
Crime - Robberies per 100,000 population (5 year average)
Crime - Assaults per 100,000 population (5 year average)
Crime - Burglaries per 100,000 population (5 year average)
Crime - Thefts per 100,000 population (5 year average)
Crime - Auto thefts per 100,000 population (5 year average)
Crime - Arson per 100,000 population (5 year average)
Crime - City-data.com crime index (5 year average)
Crime - Violent crime index (5 year average)
Crime - Property crime index (5 year average)
1996 Presidential Elections Results (%) - Democratic Party (Clinton)
1996 Presidential Elections Results (%) - Republican Party (Dole)
1996 Presidential Elections Results (%) - Other
2000 Presidential Elections Results (%) - Democratic Party (Gore)
2000 Presidential Elections Results (%) - Republican Party (Bush)
2000 Presidential Elections Results (%) - Other
2004 Presidential Elections Results (%) - Democratic Party (Kerry)
2004 Presidential Elections Results (%) - Republican Party (Bush)
2004 Presidential Elections Results (%) - Other
2008 Presidential Elections Results (%) - Democratic Party (Obama)
2008 Presidential Elections Results (%) - Republican Party (McCain)
2008 Presidential Elections Results (%) - Other
2012 Presidential Elections Results (%) - Democratic Party (Obama)
2012 Presidential Elections Results (%) - Republican Party (Romney)
2012 Presidential Elections Results (%) - Other
2016 Presidential Elections Results (%) - Democratic Party (Clinton)
2016 Presidential Elections Results (%) - Republican Party (Trump)
2016 Presidential Elections Results (%) - Other
2020 Presidential Elections Results (%) - Democratic Party (Biden)
2020 Presidential Elections Results (%) - Republican Party (Trump)
2020 Presidential Elections Results (%) - Other
Ancestries Reported - Arab (%)
Ancestries Reported - Czech (%)
Ancestries Reported - Danish (%)
Ancestries Reported - Dutch (%)
Ancestries Reported - English (%)
Ancestries Reported - French (%)
Ancestries Reported - French Canadian (%)
Ancestries Reported - German (%)
Ancestries Reported - Greek (%)
Ancestries Reported - Hungarian (%)
Ancestries Reported - Irish (%)
Ancestries Reported - Italian (%)
Ancestries Reported - Lithuanian (%)
Ancestries Reported - Norwegian (%)
Ancestries Reported - Polish (%)
Ancestries Reported - Portuguese (%)
Ancestries Reported - Russian (%)
Ancestries Reported - Scotch-Irish (%)
Ancestries Reported - Scottish (%)
Ancestries Reported - Slovak (%)
Ancestries Reported - Subsaharan African (%)
Ancestries Reported - Swedish (%)
Ancestries Reported - Swiss (%)
Ancestries Reported - Ukrainian (%)
Ancestries Reported - United States (%)
Ancestries Reported - Welsh (%)
Ancestries Reported - West Indian (%)
Ancestries Reported - Other (%)
Educational Attainment - No schooling completed (%)
Educational Attainment - Less than high school (%)
Educational Attainment - High school or equivalent (%)
Educational Attainment - Less than 1 year of college (%)
Educational Attainment - 1 or more years of college (%)
Educational Attainment - Associate degree (%)
Educational Attainment - Bachelor's degree (%)
Educational Attainment - Master's degree (%)
Educational Attainment - Professional school degree (%)
Educational Attainment - Doctorate degree (%)
School Enrollment - Nursery, preschool (%)
School Enrollment - Kindergarten (%)
School Enrollment - Grade 1 to 4 (%)
School Enrollment - Grade 5 to 8 (%)
School Enrollment - Grade 9 to 12 (%)
School Enrollment - College undergrad (%)
School Enrollment - Graduate or professional (%)
School Enrollment - Not enrolled in school (%)
School enrollment - Public schools (%)
School enrollment - Private schools (%)
School enrollment - Not enrolled (%)
Median number of rooms in houses and condos
Median number of rooms in apartments
Housing units lacking complete plumbing facilities (%)
Housing units lacking complete kitchen facilities (%)
Density of houses
Urban houses (%)
Rural houses (%)
Households with people 60 years and over (%)
Households with people 65 years and over (%)
Households with people 75 years and over (%)
Households with one or more nonrelatives (%)
Households with no nonrelatives (%)
Population in households (%)
Family households (%)
Nonfamily households (%)
Population in families (%)
Family households with own children (%)
Median number of bedrooms in owner occupied houses
Mean number of bedrooms in owner occupied houses
Median number of bedrooms in renter occupied houses
Mean number of bedrooms in renter occupied houses
Median number of vehichles in owner occupied houses
Mean number of vehichles in owner occupied houses
Median number of vehichles in renter occupied houses
Mean number of vehichles in renter occupied houses
Mortgage status - with mortgage (%)
Mortgage status - with second mortgage (%)
Mortgage status - with home equity loan (%)
Mortgage status - with both second mortgage and home equity loan (%)
Mortgage status - without a mortgage (%)
Average family size
Average family size - White
Average family size - Black or African American
Average family size - Asian
Average family size - Hispanic or Latino
Average family size - American Indian and Alaska Native
Average family size - Multirace
Average family size - Other Race
Geographical mobility - Same house 1 year ago (%)
Geographical mobility - Moved within same county (%)
Geographical mobility - Moved from different county within same state (%)
Geographical mobility - Moved from different state (%)
Geographical mobility - Moved from abroad (%)
Place of birth - Born in state of residence (%)
Place of birth - Born in other state (%)
Place of birth - Native, outside of US (%)
Place of birth - Foreign born (%)
Housing units in structures - 1, detached (%)
Housing units in structures - 1, attached (%)
Housing units in structures - 2 (%)
Housing units in structures - 3 or 4 (%)
Housing units in structures - 5 to 9 (%)
Housing units in structures - 10 to 19 (%)
Housing units in structures - 20 to 49 (%)
Housing units in structures - 50 or more (%)
Housing units in structures - Mobile home (%)
Housing units in structures - Boat, RV, van, etc. (%)
House/condo owner moved in on average (years ago)
Renter moved in on average (years ago)
Year householder moved into unit - Moved in 1999 to March 2000 (%)
Year householder moved into unit - Moved in 1995 to 1998 (%)
Year householder moved into unit - Moved in 1990 to 1994 (%)
Year householder moved into unit - Moved in 1980 to 1989 (%)
Year householder moved into unit - Moved in 1970 to 1979 (%)
Year householder moved into unit - Moved in 1969 or earlier (%)
Means of transportation to work - Drove car alone (%)
Means of transportation to work - Carpooled (%)
Means of transportation to work - Public transportation (%)
Means of transportation to work - Bus or trolley bus (%)
Means of transportation to work - Streetcar or trolley car (%)
Means of transportation to work - Subway or elevated (%)
Means of transportation to work - Railroad (%)
Means of transportation to work - Ferryboat (%)
Means of transportation to work - Taxicab (%)
Means of transportation to work - Motorcycle (%)
Means of transportation to work - Bicycle (%)
Means of transportation to work - Walked (%)
Means of transportation to work - Other means (%)
Working at home (%)
Industry diversity
Most Common Industries - Agriculture, forestry, fishing and hunting, and mining (%)
Most Common Industries - Agriculture, forestry, fishing and hunting (%)
Most Common Industries - Mining, quarrying, and oil and gas extraction (%)
Most Common Industries - Construction (%)
Most Common Industries - Manufacturing (%)
Most Common Industries - Wholesale trade (%)
Most Common Industries - Retail trade (%)
Most Common Industries - Transportation and warehousing, and utilities (%)
Most Common Industries - Transportation and warehousing (%)
Most Common Industries - Utilities (%)
Most Common Industries - Information (%)
Most Common Industries - Finance and insurance, and real estate and rental and leasing (%)
Most Common Industries - Finance and insurance (%)
Most Common Industries - Real estate and rental and leasing (%)
Most Common Industries - Professional, scientific, and management, and administrative and waste management services (%)
Most Common Industries - Professional, scientific, and technical services (%)
Most Common Industries - Management of companies and enterprises (%)
Most Common Industries - Administrative and support and waste management services (%)
Most Common Industries - Educational services, and health care and social assistance (%)
Most Common Industries - Educational services (%)
Most Common Industries - Health care and social assistance (%)
Most Common Industries - Arts, entertainment, and recreation, and accommodation and food services (%)
Most Common Industries - Arts, entertainment, and recreation (%)
Most Common Industries - Accommodation and food services (%)
Most Common Industries - Other services, except public administration (%)
Most Common Industries - Public administration (%)
Occupation diversity
Most Common Occupations - Management, business, science, and arts occupations (%)
Most Common Occupations - Management, business, and financial occupations (%)
Most Common Occupations - Management occupations (%)
Most Common Occupations - Business and financial operations occupations (%)
Most Common Occupations - Computer, engineering, and science occupations (%)
Most Common Occupations - Computer and mathematical occupations (%)
Most Common Occupations - Architecture and engineering occupations (%)
Most Common Occupations - Life, physical, and social science occupations (%)
Most Common Occupations - Education, legal, community service, arts, and media occupations (%)
Most Common Occupations - Community and social service occupations (%)
Most Common Occupations - Legal occupations (%)
Most Common Occupations - Education, training, and library occupations (%)
Most Common Occupations - Arts, design, entertainment, sports, and media occupations (%)
Most Common Occupations - Healthcare practitioners and technical occupations (%)
Most Common Occupations - Health diagnosing and treating practitioners and other technical occupations (%)
Most Common Occupations - Health technologists and technicians (%)
Most Common Occupations - Service occupations (%)
Most Common Occupations - Healthcare support occupations (%)
Most Common Occupations - Protective service occupations (%)
Most Common Occupations - Fire fighting and prevention, and other protective service workers including supervisors (%)
Most Common Occupations - Law enforcement workers including supervisors (%)
Most Common Occupations - Food preparation and serving related occupations (%)
Most Common Occupations - Building and grounds cleaning and maintenance occupations (%)
Most Common Occupations - Personal care and service occupations (%)
Most Common Occupations - Sales and office occupations (%)
Most Common Occupations - Sales and related occupations (%)
Most Common Occupations - Office and administrative support occupations (%)
Most Common Occupations - Natural resources, construction, and maintenance occupations (%)
Most Common Occupations - Farming, fishing, and forestry occupations (%)
Most Common Occupations - Construction and extraction occupations (%)
Most Common Occupations - Installation, maintenance, and repair occupations (%)
Most Common Occupations - Production, transportation, and material moving occupations (%)
Most Common Occupations - Production occupations (%)
Most Common Occupations - Transportation occupations (%)
Most Common Occupations - Material moving occupations (%)
People in Group quarters - Institutionalized population (%)
People in Group quarters - Correctional institutions (%)
People in Group quarters - Federal prisons and detention centers (%)
People in Group quarters - Halfway houses (%)
People in Group quarters - Local jails and other confinement facilities (including police lockups) (%)
People in Group quarters - Military disciplinary barracks (%)
People in Group quarters - State prisons (%)
People in Group quarters - Other types of correctional institutions (%)
People in Group quarters - Nursing homes (%)
People in Group quarters - Hospitals/wards, hospices, and schools for the handicapped (%)
People in Group quarters - Hospitals/wards and hospices for chronically ill (%)
People in Group quarters - Hospices or homes for chronically ill (%)
People in Group quarters - Military hospitals or wards for chronically ill (%)
People in Group quarters - Other hospitals or wards for chronically ill (%)
People in Group quarters - Hospitals or wards for drug/alcohol abuse (%)
People in Group quarters - Mental (Psychiatric) hospitals or wards (%)
People in Group quarters - Schools, hospitals, or wards for the mentally retarded (%)
People in Group quarters - Schools, hospitals, or wards for the physically handicapped (%)
People in Group quarters - Institutions for the deaf (%)
People in Group quarters - Institutions for the blind (%)
People in Group quarters - Orthopedic wards and institutions for the physically handicapped (%)
People in Group quarters - Wards in general hospitals for patients who have no usual home elsewhere (%)
People in Group quarters - Wards in military hospitals for patients who have no usual home elsewhere (%)
People in Group quarters - Juvenile institutions (%)
People in Group quarters - Long-term care (%)
People in Group quarters - Homes for abused, dependent, and neglected children (%)
People in Group quarters - Residential treatment centers for emotionally disturbed children (%)
People in Group quarters - Training schools for juvenile delinquents (%)
People in Group quarters - Short-term care, detention or diagnostic centers for delinquent children (%)
People in Group quarters - Type of juvenile institution unknown (%)
People in Group quarters - Noninstitutionalized population (%)
People in Group quarters - College dormitories (includes college quarters off campus) (%)
People in Group quarters - Military quarters (%)
People in Group quarters - On base (%)
People in Group quarters - Barracks, unaccompanied personnel housing (UPH), (Enlisted/Officer), ;and similar group living quarters for military personnel (%)
People in Group quarters - Transient quarters for temporary residents (%)
People in Group quarters - Military ships (%)
People in Group quarters - Group homes (%)
People in Group quarters - Homes or halfway houses for drug/alcohol abuse (%)
People in Group quarters - Homes for the mentally ill (%)
People in Group quarters - Homes for the mentally retarded (%)
People in Group quarters - Homes for the physically handicapped (%)
People in Group quarters - Other group homes (%)
People in Group quarters - Religious group quarters (%)
People in Group quarters - Dormitories (%)
People in Group quarters - Agriculture workers' dormitories on farms (%)
People in Group quarters - Job Corps and vocational training facilities (%)
People in Group quarters - Other workers' dormitories (%)
People in Group quarters - Crews of maritime vessels (%)
People in Group quarters - Other nonhousehold living situations (%)
People in Group quarters - Other noninstitutional group quarters (%)
Residents speaking English at home (%)
Residents speaking English at home - Born in the United States (%)
Residents speaking English at home - Native, born elsewhere (%)
Residents speaking English at home - Foreign born (%)
Residents speaking Spanish at home (%)
Residents speaking Spanish at home - Born in the United States (%)
Residents speaking Spanish at home - Native, born elsewhere (%)
Residents speaking Spanish at home - Foreign born (%)
Residents speaking other language at home (%)
Residents speaking other language at home - Born in the United States (%)
Residents speaking other language at home - Native, born elsewhere (%)
Residents speaking other language at home - Foreign born (%)
Class of Workers - Employee of private company (%)
Class of Workers - Self-employed in own incorporated business (%)
Class of Workers - Private not-for-profit wage and salary workers (%)
Class of Workers - Local government workers (%)
Class of Workers - State government workers (%)
Class of Workers - Federal government workers (%)
Class of Workers - Self-employed workers in own not incorporated business and Unpaid family workers (%)
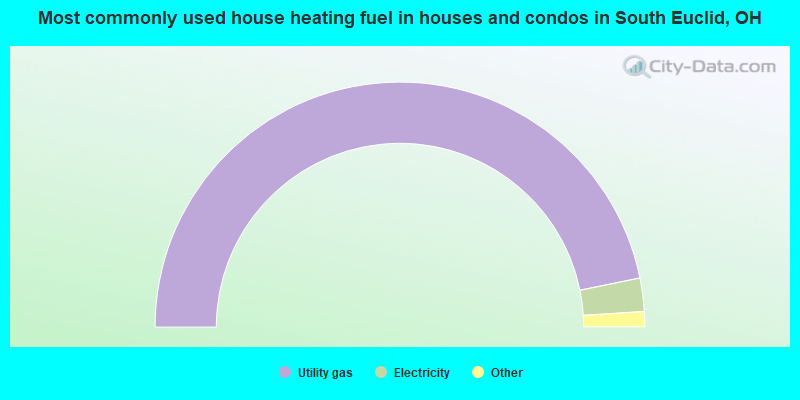
House heating fuel used in houses and condos - Utility gas (%)
House heating fuel used in houses and condos - Bottled, tank, or LP gas (%)
House heating fuel used in houses and condos - Electricity (%)
House heating fuel used in houses and condos - Fuel oil, kerosene, etc. (%)
House heating fuel used in houses and condos - Coal or coke (%)
House heating fuel used in houses and condos - Wood (%)
House heating fuel used in houses and condos - Solar energy (%)
House heating fuel used in houses and condos - Other fuel (%)
House heating fuel used in houses and condos - No fuel used (%)
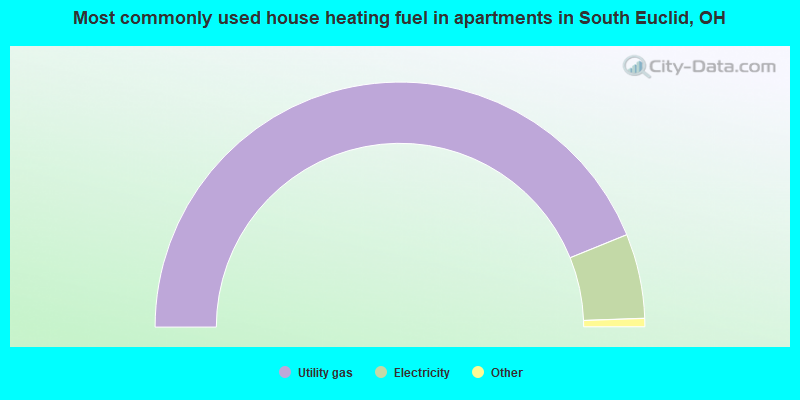
House heating fuel used in apartments - Utility gas (%)
House heating fuel used in apartments - Bottled, tank, or LP gas (%)
House heating fuel used in apartments - Electricity (%)
House heating fuel used in apartments - Fuel oil, kerosene, etc. (%)
House heating fuel used in apartments - Coal or coke (%)
House heating fuel used in apartments - Wood (%)
House heating fuel used in apartments - Solar energy (%)
House heating fuel used in apartments - Other fuel (%)
House heating fuel used in apartments - No fuel used (%)
Armed forces status - In Armed Forces (%)
Armed forces status - Civilian (%)
Armed forces status - Civilian - Veteran (%)
Armed forces status - Civilian - Nonveteran (%)
Fatal accidents locations in years 2005-2021
Fatal accidents locations in 2005
Fatal accidents locations in 2006
Fatal accidents locations in 2007
Fatal accidents locations in 2008
Fatal accidents locations in 2009
Fatal accidents locations in 2010
Fatal accidents locations in 2011
Fatal accidents locations in 2012
Fatal accidents locations in 2013
Fatal accidents locations in 2014
Fatal accidents locations in 2015
Fatal accidents locations in 2016
Fatal accidents locations in 2017
Fatal accidents locations in 2018
Fatal accidents locations in 2019
Fatal accidents locations in 2020
Fatal accidents locations in 2021
Alcohol use - People drinking some alcohol every month (%)
Alcohol use - People not drinking at all (%)
Alcohol use - Average days/month drinking alcohol
Alcohol use - Average drinks/week
Alcohol use - Average days/year people drink much
Audiometry - Average condition of hearing (%)
Audiometry - People that can hear a whisper from across a quiet room (%)
Audiometry - People that can hear normal voice from across a quiet room (%)
Audiometry - Ears ringing, roaring, buzzing (%)
Audiometry - Had a job exposure to loud noise (%)
Audiometry - Had off-work exposure to loud noise (%)
Blood Pressure & Cholesterol - Has high blood pressure (%)
Blood Pressure & Cholesterol - Checking blood pressure at home (%)
Blood Pressure & Cholesterol - Frequently checking blood cholesterol (%)
Blood Pressure & Cholesterol - Has high cholesterol level (%)
Consumer Behavior - Money monthly spent on food at supermarket/grocery store
Consumer Behavior - Money monthly spent on food at other stores
Consumer Behavior - Money monthly spent on eating out
Consumer Behavior - Money monthly spent on carryout/delivered foods
Consumer Behavior - Income spent on food at supermarket/grocery store (%)
Consumer Behavior - Income spent on food at other stores (%)
Consumer Behavior - Income spent on eating out (%)
Consumer Behavior - Income spent on carryout/delivered foods (%)
Current Health Status - General health condition (%)
Current Health Status - Blood donors (%)
Current Health Status - Has blood ever tested for HIV virus (%)
Current Health Status - Left-handed people (%)
Dermatology - People using sunscreen (%)
Diabetes - Diabetics (%)
Diabetes - Had a blood test for high blood sugar (%)
Diabetes - People taking insulin (%)
Diet Behavior & Nutrition - Diet health (%)
Diet Behavior & Nutrition - Milk product consumption (# of products/month)
Diet Behavior & Nutrition - Meals not home prepared (#/week)
Diet Behavior & Nutrition - Meals from fast food or pizza place (#/week)
Diet Behavior & Nutrition - Ready-to-eat foods (#/month)
Diet Behavior & Nutrition - Frozen meals/pizza (#/month)
Drug Use - People that ever used marijuana or hashish (%)
Drug Use - Ever used hard drugs (%)
Drug Use - Ever used any form of cocaine (%)
Drug Use - Ever used heroin (%)
Drug Use - Ever used methamphetamine (%)
Health Insurance - People covered by health insurance (%)
Kidney Conditions-Urology - Avg. # of times urinating at night
Medical Conditions - People with asthma (%)
Medical Conditions - People with anemia (%)
Medical Conditions - People with psoriasis (%)
Medical Conditions - People with overweight (%)
Medical Conditions - Elderly people having difficulties in thinking or remembering (%)
Medical Conditions - People who ever received blood transfusion (%)
Medical Conditions - People having trouble seeing even with glass/contacts (%)
Medical Conditions - People with arthritis (%)
Medical Conditions - People with gout (%)
Medical Conditions - People with congestive heart failure (%)
Medical Conditions - People with coronary heart disease (%)
Medical Conditions - People with angina pectoris (%)
Medical Conditions - People who ever had heart attack (%)
Medical Conditions - People who ever had stroke (%)
Medical Conditions - People with emphysema (%)
Medical Conditions - People with thyroid problem (%)
Medical Conditions - People with chronic bronchitis (%)
Medical Conditions - People with any liver condition (%)
Medical Conditions - People who ever had cancer or malignancy (%)
Mental Health - People who have little interest in doing things (%)
Mental Health - People feeling down, depressed, or hopeless (%)
Mental Health - People who have trouble sleeping or sleeping too much (%)
Mental Health - People feeling tired or having little energy (%)
Mental Health - People with poor appetite or overeating (%)
Mental Health - People feeling bad about themself (%)
Mental Health - People who have trouble concentrating on things (%)
Mental Health - People moving or speaking slowly or too fast (%)
Mental Health - People having thoughts they would be better off dead (%)
Oral Health - Average years since last visit a dentist
Oral Health - People embarrassed because of mouth (%)
Oral Health - People with gum disease (%)
Oral Health - General health of teeth and gums (%)
Oral Health - Average days a week using dental floss/device
Oral Health - Average days a week using mouthwash for dental problem
Oral Health - Average number of teeth
Pesticide Use - Households using pesticides to control insects (%)
Pesticide Use - Households using pesticides to kill weeds (%)
Physical Activity - People doing vigorous-intensity work activities (%)
Physical Activity - People doing moderate-intensity work activities (%)
Physical Activity - People walking or bicycling (%)
Physical Activity - People doing vigorous-intensity recreational activities (%)
Physical Activity - People doing moderate-intensity recreational activities (%)
Physical Activity - Average hours a day doing sedentary activities
Physical Activity - Average hours a day watching TV or videos
Physical Activity - Average hours a day using computer
Physical Functioning - People having limitations keeping them from working (%)
Physical Functioning - People limited in amount of work they can do (%)
Physical Functioning - People that need special equipment to walk (%)
Physical Functioning - People experiencing confusion/memory problems (%)
Physical Functioning - People requiring special healthcare equipment (%)
Prescription Medications - Average number of prescription medicines taking
Preventive Aspirin Use - Adults 40+ taking low-dose aspirin (%)
Reproductive Health - Vaginal deliveries (%)
Reproductive Health - Cesarean deliveries (%)
Reproductive Health - Deliveries resulted in a live birth (%)
Reproductive Health - Pregnancies resulted in a delivery (%)
Reproductive Health - Women breastfeeding newborns (%)
Reproductive Health - Women that had a hysterectomy (%)
Reproductive Health - Women that had both ovaries removed (%)
Reproductive Health - Women that have ever taken birth control pills (%)
Reproductive Health - Women taking birth control pills (%)
Reproductive Health - Women that have ever used Depo-Provera or injectables (%)
Reproductive Health - Women that have ever used female hormones (%)
Sexual Behavior - People 18+ that ever had sex (vaginal, anal, or oral) (%)
Sexual Behavior - Males 18+ that ever had vaginal sex with a woman (%)
Sexual Behavior - Males 18+ that ever performed oral sex on a woman (%)
Sexual Behavior - Males 18+ that ever had anal sex with a woman (%)
Sexual Behavior - Males 18+ that ever had any sex with a man (%)
Sexual Behavior - Females 18+ that ever had vaginal sex with a man (%)
Sexual Behavior - Females 18+ that ever performed oral sex on a man (%)
Sexual Behavior - Females 18+ that ever had anal sex with a man (%)
Sexual Behavior - Females 18+ that ever had any kind of sex with a woman (%)
Sexual Behavior - Average age people first had sex
Sexual Behavior - Average number of female sex partners in lifetime (males 18+)
Sexual Behavior - Average number of female vaginal sex partners in lifetime (males 18+)
Sexual Behavior - Average age people first performed oral sex on a woman (18+)
Sexual Behavior - Average number of woman performed oral sex on in lifetime (18+)
Sexual Behavior - Average number of male sex partners in lifetime (males 18+)
Sexual Behavior - Average number of male anal sex partners in lifetime (males 18+)
Sexual Behavior - Average age people first performed oral sex on a man (18+)
Sexual Behavior - Average number of male oral sex partners in lifetime (18+)
Sexual Behavior - People using protection when performing oral sex (%)
Sexual Behavior - Average number of times people have vaginal or anal sex a year
Sexual Behavior - People having sex without condom (%)
Sexual Behavior - Average number of male sex partners in lifetime (females 18+)
Sexual Behavior - Average number of male vaginal sex partners in lifetime (females 18+)
Sexual Behavior - Average number of female sex partners in lifetime (females 18+)
Sexual Behavior - Circumcised males 18+ (%)
Sleep Disorders - Average hours sleeping at night
Sleep Disorders - People that has trouble sleeping (%)
Smoking-Cigarette Use - People smoking cigarettes (%)
Taste & Smell - People 40+ having problems with smell (%)
Taste & Smell - People 40+ having problems with taste (%)
Taste & Smell - People 40+ that ever had wisdom teeth removed (%)
Taste & Smell - People 40+ that ever had tonsils teeth removed (%)
Taste & Smell - People 40+ that ever had a loss of consciousness because of a head injury (%)
Taste & Smell - People 40+ that ever had a broken nose or other serious injury to face or skull (%)
Taste & Smell - People 40+ that ever had two or more sinus infections (%)
Weight - Average height (inches)
Weight - Average weight (pounds)
Weight - Average BMI
Weight - People that are obese (%)
Weight - People that ever were obese (%)
Weight - People trying to lose weight (%)
According to our research of Ohio and other state lists, there were 36 registered sex offenders living in South Euclid, Ohio as of April 27, 2024 . The ratio of all residents to sex offenders in South Euclid is 603 to 1.The ratio of registered sex offenders to all residents in this city is near the state average.
Officers per 1,000 residents here:
1.61Ohio average:
2.23
Latest news from South Euclid, OH collected exclusively by city-data.com from local newspapers, TV, and radio stations
Ancestries: American (4.7%), European (4.6%), Italian (3.7%), Irish (2.8%), German (2.6%), African (2.6%).
Current Local Time:
Land area: 4.69 square miles.
Population density: 4,562 people per square mile (average).
914 residents are foreign born (1.9% Europe , 1.2% Latin America , 0.6% Asia ).
Median real estate property taxes paid for housing units with mortgages in 2022: $3,637 (2.6%)Median real estate property taxes paid for housing units with no mortgage in 2022: $3,589 (2.6%)
Nearest city with pop. 50,000+: Euclid, OH
Nearest city with pop. 200,000+: Cleveland, OH
Nearest city with pop. 1,000,000+: Chicago, IL
Nearest cities:
Latitude: 41.52 N, Longitude: 81.53 W
Daytime population change due to commuting: -5,382 (-25.2%)Workers who live and work in this city: 2,428 (21.8%)
Property values in South Euclid, OH
Single-family new house construction building permits:
2021: 7 buildings , average cost: $135,1002020: 3 buildings , average cost: $264,3002019: 1 building , cost: $250,0002018: 3 buildings , average cost: $222,7002016: 3 buildings , average cost: $158,3002015: 4 buildings , average cost: $153,8002014: 11 buildings , average cost: $165,0002013: 6 buildings , average cost: $126,7002012: 4 buildings , average cost: $143,8002011: 1 building , cost: $150,0002010: 6 buildings , average cost: $168,3002009: 4 buildings , average cost: $112,5002008: 12 buildings , average cost: $150,0002007: 9 buildings , average cost: $143,1002006: 7 buildings , average cost: $113,3002005: 6 buildings , average cost: $150,0002004: 6 buildings , average cost: $16,7002003: 26 buildings , average cost: $100,0002002: 4 buildings , average cost: $162,5001999: 5 buildings , average cost: $204,6001997: 4 buildings , average cost: $138,900Unemployment in December 2023:
Most common occupations in South Euclid, OH (%)
Both Males Females
Sales representatives, services, wholesale and manufacturing (4.4%)
Preschool, kindergarten, elementary, and middle school teachers (4.1%)
Secretaries and administrative assistants (4.0%)
Other office and administrative support workers, including supervisors (4.0%)
Other management occupations, except farmers and farm managers (3.9%)
Retail sales workers, except cashiers (3.8%)
Other sales and related occupations, including supervisors (3.8%)
Sales representatives, services, wholesale and manufacturing (6.0%)
Material recording, scheduling, dispatching, and distributing workers (4.8%)
Other sales and related occupations, including supervisors (4.5%)
Other management occupations, except farmers and farm managers (4.5%)
Building and grounds cleaning and maintenance occupations (4.4%)
Computer specialists (3.6%)
Retail sales workers, except cashiers (3.3%)
Secretaries and administrative assistants (7.7%)
Preschool, kindergarten, elementary, and middle school teachers (6.8%)
Registered nurses (5.9%)
Other office and administrative support workers, including supervisors (5.9%)
Retail sales workers, except cashiers (4.2%)
Other management occupations, except farmers and farm managers (3.4%)
Health technologists and technicians (3.2%)
Tornado activity:
South Euclid-area historical tornado activity is slightly below Ohio state average. It is 11% smaller than the overall U.S. average.
On 6/8/1953, a category F4 (max. wind speeds 207-260 mph) tornado 10.1 miles away from the South Euclid city center killed 17 people and injured 379 people .
On 5/31/1985, a category F5 (max. wind speeds 261-318 mph) tornado 29.7 miles away from the city center killed 18 people and injured 310 people and caused between $50,000,000 and $500,000,000 in damages.
Earthquake activity:
South Euclid-area historical earthquake activity is significantly above Ohio state average. It is 51% smaller than the overall U.S. average. On 9/25/1998 at 19:52:52, a magnitude 5.2 (4.8 MB, 4.3 MS, 5.2 LG, 4.5 MW, Depth: 3.1 mi, Class: Moderate, Intensity: VI - VII) earthquake occurred 58.7 miles away from the city center On 1/31/1986 at 16:46:43, a magnitude 5.0 (5.0 MB) earthquake occurred 19.8 miles away from South Euclid center On 8/23/2011 at 17:51:04, a magnitude 5.8 (5.8 MW, Depth: 3.7 mi) earthquake occurred 314.5 miles away from South Euclid center On 6/10/2019 at 14:50:45, a magnitude 4.0 (4.0 MB, Depth: 1.2 mi, Class: Light, Intensity: IV - V) earthquake occurred 11.5 miles away from the city center On 7/27/1980 at 18:52:21, a magnitude 5.2 (5.1 MB, 4.7 MS, 5.0 UK, 5.2 UK) earthquake occurred 262.8 miles away from South Euclid center On 12/31/2011 at 20:05:01, a magnitude 4.0 (4.0 ML, Depth: 3.1 mi) earthquake occurred 51.8 miles away from South Euclid center Magnitude types: regional Lg-wave magnitude (LG), body-wave magnitude (MB), local magnitude (ML), surface-wave magnitude (MS), moment magnitude (MW) Natural disasters: The number of natural disasters in Cuyahoga County (16) is near the US average (15).Major Disasters (Presidential) Declared: 12Emergencies Declared: 3Storms: 9, Floods: 8, Tornadoes: 7, Winds: 3, Hurricanes: 2, Blizzard: 1, Heavy Rain: 1, Power Outage: 1, Snowstorm: 1, Tropical Storm: 1, Other: 1 (Note: some incidents may be assigned to more than one category). Hospitals and medical centers in South Euclid: VERONA HOUSE (4285 VERONA ROAD) BUCKEYE HOMECARE SERVICES, INC (14077 CEDAR ROAD, LL FLOOR)
Other hospitals and medical centers near South Euclid: JUST LIKE FAMILEE III, INC (Home Health Center, about 1 miles away; CLEVELAND, OH)
EDENDALE HOUSE (Hospital, about 1 miles away; CLEVELAND HEIGHTS, OH)
MONTICELLO HOUSE (Hospital, about 2 miles away; EUCLID, OH)
RICHMOND HOUSE (Hospital, about 2 miles away; LYNDHURST, OH)
A 1 NURSING CARE OF CLEVELAND (Home Health Center, about 2 miles away; CLEVELAND HEIGHTS, OH)
EASTERN STAR HOME OF CUYAHOGA CO INC (Nursing Home, about 2 miles away; EAST CLEVELAND, OH)
HEALTH CARE BRIDGE, INC (Home Health Center, about 3 miles away; BEACHWOOD, OH)
Amtrak station near South Euclid: 9 miles: CLEVELAND (200 CLEVELAND MEMORIAL SHOREWAY) Services: ticket office, partially wheelchair accessible, enclosed waiting area, public restrooms, public payphones, vending machines, free short-term parking, paid long-term parking, taxi stand, public transit connection.
Colleges/universities with over 2000 students nearest to South Euclid:
John Carroll University (about 3 miles; University Heights, OH ; Full-time enrollment: 3,546)
Case Western Reserve University (about 5 miles; Cleveland, OH ; FT enrollment: 7,034)
Cuyahoga Community College District (about 8 miles; Cleveland, OH ; FT enrollment: 20,271)
Cleveland State University (about 8 miles; Cleveland, OH ; FT enrollment: 14,161)
Lakeland Community College (about 12 miles; Kirtland, OH ; FT enrollment: 6,170)
Baldwin Wallace University (about 20 miles; Berea, OH ; FT enrollment: 3,699)
Kent State University at Kent (about 28 miles; Kent, OH ; FT enrollment: 25,431)
Public elementary/middle schools in South Euclid:
Private elementary/middle school in South Euclid: ST JOHN LUTHERAN SCHOOL Students: 89, Location: 4386 MAYFIELD RD, Grades: PK-8)
See full list of schools located in South Euclid Birthplace of: Steve Stone (baseball) - Baseball player.
Cuyahoga County has a predicted average indoor radon screening level between 2 and 4 pCi/L (pico curies per liter) - Moderate Potential Average household size: This city:
2.4 peopleOhio:
2.4 people
Percentage of family households: This city:
65.0%Whole state:
65.0%
Percentage of households with unmarried partners: This city:
4.8%Whole state:
6.8%
Likely homosexual households (counted as self-reported same-sex unmarried-partner households)
Lesbian couples: 0.4% of all households Gay men: 0.2% of all households
People in group quarters in South Euclid in 2010:
585 people in college/university student housing
21 people in group homes intended for adults
5 people in local jails and other municipal confinement facilities
5 people in residential treatment centers for adults
3 people in other noninstitutional facilities
People in group quarters in South Euclid in 2000:
86 people in college dormitories (includes college quarters off campus)
32 people in other nonhousehold living situations
29 people in homes for the mentally retarded
14 people in religious group quarters
3 people in other noninstitutional group quarters
2 people in local jails and other confinement facilities (including police lockups)
Banks with branches in South Euclid (2011 data):
PNC Bank, National Association: Mayfield-Warrensville Branch at 4017 Mayfield Road, branch established on 1973/09/27. Info updated 2012/03/20: Bank assets: $263,309.6 mil, Deposits: $197,343.0 mil, headquarters in Wilmington, DE, positive income , Commercial Lending Specialization, 3085 total offices , Holding Company: Pnc Financial Services Group, Inc., The
Citizens Bank: 2104 Warrensville Center Branch at 13991 Cedar Road, branch established on 1985/06/30. Info updated 2011/08/01: Bank assets: $9,212.3 mil, Deposits: $7,452.0 mil, headquarters in Flint, MI, positive income , Commercial Lending Specialization, 220 total offices , Holding Company: Citizens Republic Bancorp, Inc.
Third Federal Savings and Loan Association of Cleveland: Cedar Branch at 13908 Cedar Road, branch established on 1993/06/17. Info updated 2011/07/21: Bank assets: $11,018.4 mil, Deposits: $8,966.1 mil, headquarters in Cleveland, OH, positive income , Mortgage Lending Specialization, 39 total offices
The Huntington National Bank: South Euclid Branch at 14481 Cedar Road, branch established on 1958/01/01. Info updated 2012/04/02: Bank assets: $54,183.4 mil, Deposits: $44,300.3 mil, headquarters in Columbus, OH, positive income , Commercial Lending Specialization, 878 total offices , Holding Company: Huntington Bancshares Incorporated
New York Community Bank: 14033 Cedar Rd Branch at 14033 Cedar Rd, branch established on 1921/01/01. Info updated 2010/03/29: Bank assets: $39,468.7 mil, Deposits: $20,709.8 mil, headquarters in Westbury, NY, positive income , Commercial Lending Specialization, 247 total offices , Holding Company: New York Community Bancorp, Inc.
KeyBank National Association: South Euclid Branch at 4461 Mayfield Road, branch established on 1956/01/16. Info updated 2008/03/03: Bank assets: $86,198.8 mil, Deposits: $64,214.8 mil, headquarters in Cleveland, OH, positive income , Commercial Lending Specialization, 1067 total offices , Holding Company: Keycorp
Fifth Third Bank: South Euclid at 4065 Mayfield Rd., branch established on 1907/01/01. Info updated 2009/10/05: Bank assets: $114,540.4 mil, Deposits: $89,689.1 mil, headquarters in Cincinnati, OH, positive income , Commercial Lending Specialization, 1378 total offices , Holding Company: Fifth Third Bancorp
For population 15 years and over in South Euclid:
Never married: 41.9%Now married: 41.1%Separated: 1.6%Widowed: 4.4%Divorced: 11.0% For population 25 years and over in South Euclid:
High school or higher: 96.7%Bachelor's degree or higher: 44.3%Graduate or professional degree: 18.4%Unemployed: 3.0%Mean travel time to work (commute): 18.6 minutes
Education Gini index (Inequality in education) Here:
9.0Ohio average:
11.0
Religion statistics for South Euclid, OH (based on Cuyahoga County data)
Religion Adherents Congregations Catholic 366,464 110 Evangelical Protestant 106,477 326 Mainline Protestant 94,977 233 Other 49,641 126 Black Protestant 40,776 129 Orthodox 16,456 31 None 605,331 -
Source: Clifford Grammich, Kirk Hadaway, Richard Houseal, Dale E.Jones, Alexei Krindatch, Richie Stanley and Richard H.Taylor. 2012. 2010 U.S.Religion Census: Religious Congregations & Membership Study. Association of Statisticians of American Religious Bodies. Jones, Dale E., et al. 2002. Congregations and Membership in the United States 2000. Nashville, TN: Glenmary Research Center. Graphs represent county-level data
Food Environment Statistics: Number of grocery stores : 302This county :
2.33 / 10,000 pop.Ohio :
1.89 / 10,000 pop.
Number of supercenters and club stores : 6Here :
0.05 / 10,000 pop.State :
0.13 / 10,000 pop.
Number of convenience stores (no gas) : 218Cuyahoga County :
1.68 / 10,000 pop.State :
1.25 / 10,000 pop.
Number of convenience stores (with gas) : 293Here :
2.26 / 10,000 pop.Ohio :
2.93 / 10,000 pop.
Number of full-service restaurants : 891Cuyahoga County :
6.88 / 10,000 pop.Ohio :
6.25 / 10,000 pop.
Adult diabetes rate : This county :
10.8%Ohio :
10.3%
Adult obesity rate : This county :
28.3%State :
29.1%
Low-income preschool obesity rate : Health and Nutrition: Healthy diet rate : South Euclid:
50.6%Ohio:
50.4%
Average overall health of teeth and gums : South Euclid:
47.8%Ohio:
47.8%
Average BMI : South Euclid:
28.5Ohio:
28.7
People feeling badly about themselves : People not drinking alcohol at all : South Euclid:
10.3%State:
10.4%
Average hours sleeping at night : Overweight people : South Euclid:
33.8%Ohio:
34.3%
General health condition : South Euclid:
56.4%Ohio:
57.0%
Average condition of hearing : This city:
79.2%State:
79.1%
More about Health and Nutrition of South Euclid, OH Residents
Local government employment and payroll (March 2022)
Function
Full-time employees
Monthly full-time payroll
Average yearly full-time wage
Part-time employees
Monthly part-time payroll
Police Protection - Officers
38 $303,404 $95,812 2 $2,030 Firefighters
33 $266,973 $97,081 0 $0 Other and Unallocable
11 $51,972 $56,697 0 $0 Judicial and Legal
9 $37,956 $50,608 8 $20,348 Streets and Highways
8 $48,997 $73,496 1 $1,751 Solid Waste Management
8 $44,951 $67,427 0 $0 Police - Other
4 $13,052 $39,156 3 $3,502 Sewerage
4 $21,804 $65,412 1 $1,818 Financial Administration
4 $21,988 $65,964 0 $0 Other Government Administration
3 $21,496 $85,984 23 $9,122 Parks and Recreation
2 $6,665 $39,990 5 $1,800 Housing and Community Development (Local)
1 $5,844 $70,128 0 $0
Totals for Government
125 $845,102 $81,130 43 $40,371
South Euclid government finances - Expenditure in 2021 (per resident):
Construction - Regular Highways: $1,281,000 ($59.87)
Current Operations - Police Protection: $7,717,000 ($360.69)
Local Fire Protection: $2,966,000 ($138.63)Regular Highways: $1,955,000 ($91.38)Solid Waste Management: $1,182,000 ($55.25)Central Staff Services: $1,072,000 ($50.11)Financial Administration: $993,000 ($46.41)General Public Buildings: $505,000 ($23.60)Judicial and Legal Services: $305,000 ($14.26)General - Other: $56,000 ($2.62)Parks and Recreation: $24,000 ($1.12)General - Interest on Debt: $28,000 ($1.31)
Total Salaries and Wages: $6,319,000 ($295.35)
South Euclid government finances - Revenue in 2021 (per resident):
Charges - Solid Waste Management: $1,401,000 ($65.48)
Miscellaneous Commercial Activities: $227,000 ($10.61)Other: $59,000 ($2.76)Local Intergovernmental - Health and Hospitals: $670,000 ($31.32)
Housing and Community Development: $248,000 ($11.59)Other: $13,000 ($0.61)Miscellaneous - Fines and Forfeits: $1,032,000 ($48.24)
Special Assessments: $65,000 ($3.04)Donations From Private Sources: $44,000 ($2.06)State Intergovernmental - Highways: $1,695,000 ($79.22)
General Local Government Support: $1,081,000 ($50.53)Housing and Community Development: $96,000 ($4.49)Tax - Property: $9,483,000 ($443.23)
Individual Income: $3,960,000 ($185.09)Other: $243,000 ($11.36)Other License: $6,000 ($0.28)
South Euclid government finances - Debt in 2021 (per resident):
Long Term Debt - Beginning Outstanding - Unspecified Public Purpose: $882,000 ($41.22)
Outstanding Unspecified Public Purpose: $471,000 ($22.01)Retired Unspecified Public Purpose: $411,000 ($19.21)
South Euclid government finances - Cash and Securities in 2021 (per resident):
Sinking Funds - Cash and Securities: $8,915,000 ($416.69)
4.02% of this county's 2021 resident taxpayers lived in other counties in 2020 ($66,006 average adjusted gross income )
Here:
4.02%Ohio average:
5.68%
0.02% of residents moved from foreign countries ($135 average AGI )Cuyahoga County:
0.02%Ohio average:
0.01%
Top counties from which taxpayers relocated into this county between 2020 and 2021:
5.02% of this county's 2020 resident taxpayers moved to other counties in 2021 ($88,842 average adjusted gross income )
Here:
5.02%Ohio average:
5.79%
0.01% of residents moved to foreign countries ($120 average AGI )Cuyahoga County:
0.01%Ohio average:
0.01%
Top counties to which taxpayers relocated from this county between 2020 and 2021:
Businesses in South Euclid, OH
Name Count Name Count
AT&T 1 FedEx 1 Advance Auto Parts 1 KFC 1 Arby's 1 McDonald's 1 Baskin-Robbins 1 Penske 1 Blockbuster 1 Starbucks 1 Burger King 2 True Value 1 CVS 1 U-Haul 1 Dunkin Donuts 1
Strongest AM radio stations in South Euclid:
WKNR (850 AM; 50 kW; CLEVELAND, OH; Owner: CARON BROADCASTING, INC.)
WTAM (1100 AM; 50 kW; CLEVELAND, OH; Owner: JACOR BROADCASTING CORPORATION)
WHK (1220 AM; 50 kW; CLEVELAND, OH; Owner: CARON BROADCASTING, INC.)
WJMO (1490 AM; 1 kW; CLEVELAND HEIGHTS, OH; Owner: BLUE CHIP BROADCASTING LICENSES, LTD.)
WWMK (1260 AM; 10 kW; CLEVELAND, OH; Owner: ABC, INC.)
WABQ (1540 AM; daytime; 1 kW; CLEVELAND, OH; Owner: WABQ, INC.)
WRMR (1420 AM; 5 kW; CLEVELAND, OH; Owner: CLEVELAND CLASSICAL RADIO, LLC)
WERE (1300 AM; 5 kW; CLEVELAND, OH)
WCUE (1150 AM; 5 kW; CUYAHOGA FALLS, OH; Owner: FAMILY STATIONS, INC.)
WHLO (640 AM; 5 kW; AKRON, OH; Owner: CLEAR CHANNEL BROADCASTING LICENSES, INC.)
WJTB (1040 AM; daytime; 5 kW; NORTH RIDGEVILLE, OH; Owner: TAYLOR BROADCASTING CO)
WJR (760 AM; 50 kW; DETROIT, MI; Owner: ABC, INC.)
WTOU (1350 AM; 5 kW; AKRON, OH)
Strongest FM radio stations in South Euclid:
WJCU (88.7 FM; UNIVERSITY HEIGHTS, OH; Owner: JOHN CARROLL UNIVERSITY)
WRUW-FM (91.1 FM; CLEVELAND, OH; Owner: CASE WESTERN RESERVE UNIVERSITY)
WFHM-FM (95.5 FM; CLEVELAND, OH; Owner: SCA LICENSE CORPORATION)
WXTM (92.3 FM; CLEVELAND HEIGHTS, OH; Owner: INFINITY RADIO OPERATIONS INC.)
WMJI (105.7 FM; CLEVELAND, OH; Owner: CITICASTERS LICENSES, L.P.)
WDOK (102.1 FM; CLEVELAND, OH; Owner: INFINITY RADIO OPERATIONS INC.)
WQAL (104.1 FM; CLEVELAND, OH; Owner: INFINITY RADIO OPERATIONS INC.)
WMVX (106.5 FM; CLEVELAND, OH; Owner: JACOR BROADCASTING CORPORATION)
WENZ (107.9 FM; CLEVELAND, OH; Owner: RADIO ONE LICENSES, LLC)
WNCX (98.5 FM; CLEVELAND, OH; Owner: INFINITY RADIO OF CLEVELAND INC.)
WMMS (100.7 FM; CLEVELAND, OH; Owner: CITICASTERS LICENSES, L.P.)
WCRF-FM (103.3 FM; CLEVELAND, OH; Owner: THE MOODY BIBLE INSTITUTE OF CHICAGO)
WCPN (90.3 FM; CLEVELAND, OH; Owner: IDEASTREAM)
WGAR-FM (99.5 FM; CLEVELAND, OH; Owner: CITICASTERS LICENSES, L.P.)
WZAK (93.1 FM; CLEVELAND, OH; Owner: RADIO ONE LICENSES, LLC)
WCSB (89.3 FM; CLEVELAND, OH; Owner: CLEVELAND STATE UNIVERSITY)
WKHR (91.5 FM; BAINBRIDGE, OH; Owner: KENSTON LOCAL SCHOOL DISTRICT)
WAKS (96.5 FM; AKRON, OH; Owner: CAPSTAR TX LIMITED PARTNERSHIP)
WKSU-FM (89.7 FM; KENT, OH; Owner: KENT STATE UNIVERSITY)
WQMX (94.9 FM; MEDINA, OH; Owner: RUBBER CITY RADIO GROUP, INC)
TV broadcast stations around South Euclid:
WRAP-CA (Channel 32; CLEVELAND, OH; Owner: COMMERCIAL BROADCASTING CORP.)
WKYC-TV (Channel 3; CLEVELAND, OH; Owner: WKYC-TV, INC.)
WOIO (Channel 19; SHAKER HEIGHTS, OH; Owner: RAYCOM NATIONAL, INC.)
WBNX-TV (Channel 55; AKRON, OH; Owner: WINSTON BROADCASTING NETWORK, INC.)
W35AX (Channel 35; CLEVELAND, OH; Owner: MEDIA-COM TELEVISION, INC.)
WQHS-TV (Channel 61; CLEVELAND, OH; Owner: UNIVISION CLEVELAND LLC)
WEWS-TV (Channel 5; CLEVELAND, OH; Owner: SCRIPPS HOWARD BROADCASTING COMPANY)
WUAB (Channel 43; LORAIN, OH; Owner: RAYCOM NATIONAL, INC.)
WXOX-LP (Channel 65; CLEVELAND, OH; Owner: VENTURE TECHNOLOGIES GROUP, LLC)
W53AX (Channel 53; CLEVELAND, OH; Owner: WORD OF GOD FELLOWSHIP, INC.)
WJW (Channel 8; CLEVELAND, OH; Owner: WJW LICENSE, INC.)
WVIZ (Channel 25; CLEVELAND, OH; Owner: IDEASTREAM)
W51BI (Channel 51; KIRTLAND, OH; Owner: TRINITY BROADCASTING NETWORK)
WEAO (Channel 49; AKRON, OH; Owner: NORTHEASTERN EDUCATIONAL TELEVISION OF OHIO, INC.)
WVPX (Channel 23; AKRON, OH; Owner: PAXSON AKRON LICENSE, INC.)
WAKN-LP (Channel 11; AKRON, OH; Owner: AKRON TELEVISION, INC.)
WOAC (Channel 67; CANTON, OH; Owner: WRAY, INC.)
National Bridge Inventory (NBI) Statistics 6 Number of bridges56ft / 16.9m Total length $176,000 Total costs24,659 Total average daily traffic1,443 Total average daily truck traffic34,226 Total future (year 2015) average daily traffic
FCC Registered Antenna Towers: 46 (
See the full list of FCC Registered Antenna Towers in South Euclid )
FCC Registered Broadcast Land Mobile Towers: 7
1349 S Green Rd (Lat: 41.520889 Lon: -81.520667), Call Sign: KQB506, Assigned Frequencies: 155.370 MHz, 39.5800 MHz, 39.6800 MHz, 39.9800 MHz, Grant Date: 09/09/1997, Expiration Date: 11/19/2002, Cancellation Date: 03/02/2003, Registrant: City Of South Euclid, 1349 S Green Rd, Cleveland, OH 44121, Phone: (216) 381-0400 645 S Green Rd (Lat: 41.538944 Lon: -81.526500), Call Sign: KBY820, Licensee ID: L00065214, Assigned Frequencies: 47.6800 MHz, Grant Date: 01/26/2023, Expiration Date: 04/14/2033, Registrant: Utilities Equipment And Supply Company, 645 S Green Rd, South Euclid, OH 44121, Phone: (216) 381-8100, Email:
Lat: 41.519917 Lon: -81.516278, Call Sign: WPWC712, Assigned Frequencies: 468.762 MHz, 468.837 MHz, 469.137 MHz, 469.462 MHz, 469.637 MHz, 469.662 MHz, 469.887 MHz, 457.512 MHz, 457.537 MHz, 457.562 MHz, 457.587 MHz, 457.612 MHz, Grant Date: 10/15/2002, Expiration Date: 10/15/2012, Cancellation Date: 12/15/2009, Certifier: Sharon Stevens, Registrant: Keller And Heckman LLP, 1001 G Street, Nw, Suite 500 West, Washington, DC 20001, Phone: (202) 434-4282, Fax: (202) 434-4646, Email:
Lat: 41.517889 Lon: -81.512194, Call Sign: WQGN287, Assigned Frequencies: 464.375 MHz, 469.375 MHz, 462.300 MHz, 467.300 MHz, 463.525 MHz, Grant Date: 01/31/2017, Expiration Date: 03/07/2027, Certifier: Mike Yenny, Registrant: Dennis R Spaulding Inc, 250 Fairgrounds Road, Painesville, OH 44077, Phone: (440) 354-3715, Fax: (440) 354-4302, Email:
Lat: 41.517944 Lon: -81.512056, Call Sign: WQGN733, Assigned Frequencies: 452.000 MHz, 457.000 MHz, 457.650 MHz, 457.975 MHz, 467.425 MHz, Grant Date: 03/12/2007, Expiration Date: 03/12/2017, Cancellation Date: 03/12/2007, Certifier: Mike Yenny, Registrant: Dennis R. Spaulding, Inc., 250 Fairgrounds Road, Painesville, OH 44077, Phone: (440) 354-3715, Fax: (440) 354-4302, Email:
Lat: 41.507556 Lon: -81.515111, Call Sign: WQIP268, Assigned Frequencies: 467.012 MHz, Grant Date: 04/02/2008, Expiration Date: 04/02/2018, Cancellation Date: 06/02/2018, Certifier: Michael Dugan, Registrant: Washington Radio Reports, 1588 Fairfield Road Ste 7, Gettysburg, PA 17325, Phone: (717) 334-0668, Fax: (717) 334-6440, Email:
Lat: 41.518750 Lon: -81.518889, Call Sign: WRNY669, Assigned Frequencies: 467.212 MHz, Grant Date: 09/10/2021, Expiration Date: 09/10/2031, Certifier: Michael A Tohn, Registrant: Innovation Wireless, 11869 Teale St, Culver City, CA 90230, Phone: (888) 559-5565, Fax: (310) 482-3480, Email:
FCC Registered Microwave Towers: 2
CLE0613, 4188 Glen Ridge (Lat: 41.542222 Lon: -81.527778), Type: Tower, Structure height: 60.9 m, Call Sign: WQBJ371, Licensee ID: L01728370, Assigned Frequencies: 19360.0 MHz, 21970.0 MHz, Grant Date: 10/19/2004, Expiration Date: 10/19/2014, Cancellation Date: 09/11/2013, Certifier: Joseph M Sandri Jr., Registrant: Fibertower Network Services, Corp., Debtor-In-Possession, 1875 Eye Street, Nw, 5th Floor, Room 505, Washington, DC 20006, Phone: (202) 223-1028, Email:
OH-CLE058D, 4188 Glen Ridge (Lat: 41.542333 Lon: -81.528028), Type: Tower, Structure height: 56.7 m, Overall height: 59.4 m, Call Sign: WQNA610, Assigned Frequencies: 10775.0 MHz, 11015.0 MHz, 22075.0 MHz, 10855.0 MHz, 11095.0 MHz, Grant Date: 11/23/2010, Expiration Date: 11/23/2020, Cancellation Date: 08/21/2014, Certifier: Nadja S Sodos-Wallace, Registrant: Sprint Corporation, 12502 Sunrise Valley Drive, Reston, VA 20196, Phone: (703) 433-4000, Fax: (703) 433-4483 FCC Registered Amateur Radio Licenses: 64 (
See the full list of FCC Registered Amateur Radio Licenses in South Euclid )
FAA Registered Aircraft: 3
Aircraft: CESSNA 150L (Category: Land, Seats: 2, Weight: Up to 12,499 Pounds, Speed: 90 mph), Engine: CONT MOTOR 0-200 SERIES (100 HP) (Reciprocating)N-Number: 1363Q, N1363Q, N-1363Q, Serial Number: 15072663, Year manufactured: 1971, Airworthiness Date: 07/22/1971, Certificate Issue Date: 06/20/2016Registrant (Individual): Thomas R Powers, 1511 Sheridan Rd, South Euclid, OH 44121Aircraft: CESSNA 172H (Category: Land, Seats: 4, Weight: Up to 12,499 Pounds, Speed: 105 mph), Engine: CONT MOTOR 0-300 SER (145 HP) (Reciprocating)N-Number: 3880R, N3880R, N-3880R, Serial Number: 17255380, Year manufactured: 1966, Airworthiness Date: 10/24/1966, Certificate Issue Date: 04/15/2015Registrant (LLC): C172 Nancy LLC, 1199 Berwick Ln, South Euclid, OH 44121Aircraft: BELLANCA 14-19-3 (Category: Land, Seats: 4, Weight: Up to 12,499 Pounds, Speed: 152 mph), Engine: CONT MOTOR I0-470 SERIES (260 HP) (Reciprocating)N-Number: 7606E, N7606E, N-7606E, Serial Number: 4108, Year manufactured: 1959, Airworthiness Date: 03/14/1959, Certificate Issue Date: 04/26/1977Registrant (Individual): Charles J Consiglio, 1169 Winston Rd, South Euclid, OH 44121Deregistered: Cancel Date: 09/11/2020
Home Mortgage Disclosure Act Aggregated Statistics For Year 2009(Based on 7 full tracts) A) FHA, FSA/RHS & VA B) Conventional C) Refinancings D) Home Improvement Loans E) Loans on Dwellings For 5+ Families F) Non-occupant Loans on Number Average Value Number Average Value Number Average Value Number Average Value Number Average Value Number Average Value
LOANS ORIGINATED 164 $99,756 68 $98,676 259 $108,830 35 $21,629 0 $0 29 $65,414 APPLICATIONS APPROVED, NOT ACCEPTED 2 $90,000 1 $23,000 31 $121,613 14 $21,929 0 $0 3 $86,667 APPLICATIONS DENIED 24 $83,750 11 $59,182 170 $114,682 66 $17,621 2 $381,500 9 $70,889 APPLICATIONS WITHDRAWN 10 $71,900 7 $62,571 55 $113,491 3 $19,333 1 $100,000 2 $53,500 FILES CLOSED FOR INCOMPLETENESS 4 $75,000 4 $97,500 23 $114,000 3 $14,000 0 $0 0 $0
Aggregated Statistics For Year 2008(Based on 7 full tracts) A) FHA, FSA/RHS & VA B) Conventional C) Refinancings D) Home Improvement Loans E) Loans on Dwellings For 5+ Families F) Non-occupant Loans on G) Loans On Manufactured Number Average Value Number Average Value Number Average Value Number Average Value Number Average Value Number Average Value Number Average Value
LOANS ORIGINATED 137 $104,124 122 $91,795 192 $107,901 69 $11,536 0 $0 65 $74,000 1 $4,000 APPLICATIONS APPROVED, NOT ACCEPTED 9 $92,667 14 $85,786 35 $101,257 21 $24,571 0 $0 9 $82,000 0 $0 APPLICATIONS DENIED 29 $104,586 42 $73,476 284 $112,732 100 $19,740 0 $0 49 $81,551 2 $10,000 APPLICATIONS WITHDRAWN 14 $98,429 15 $88,533 70 $115,729 2 $84,000 0 $0 15 $94,867 0 $0 FILES CLOSED FOR INCOMPLETENESS 3 $111,667 2 $66,000 24 $135,667 6 $50,833 1 $1,000,000 3 $103,667 0 $0
Aggregated Statistics For Year 2007(Based on 7 full tracts) A) FHA, FSA/RHS & VA B) Conventional C) Refinancings D) Home Improvement Loans E) Loans on Dwellings For 5+ Families F) Non-occupant Loans on G) Loans On Manufactured Number Average Value Number Average Value Number Average Value Number Average Value Number Average Value Number Average Value Number Average Value
LOANS ORIGINATED 41 $115,732 285 $98,319 286 $104,112 92 $29,707 4 $488,000 77 $83,545 1 $9,000 APPLICATIONS APPROVED, NOT ACCEPTED 4 $116,500 63 $92,159 124 $109,363 20 $40,800 0 $0 35 $85,943 1 $98,000 APPLICATIONS DENIED 15 $110,867 94 $99,745 375 $115,083 134 $37,052 0 $0 45 $90,644 1 $5,000 APPLICATIONS WITHDRAWN 8 $111,500 36 $80,500 89 $233,146 24 $40,208 0 $0 16 $70,250 0 $0 FILES CLOSED FOR INCOMPLETENESS 0 $0 20 $94,650 34 $131,853 1 $11,000 0 $0 5 $85,200 0 $0
Aggregated Statistics For Year 2006(Based on 7 full tracts) A) FHA, FSA/RHS & VA B) Conventional C) Refinancings D) Home Improvement Loans E) Loans on Dwellings For 5+ Families F) Non-occupant Loans on G) Loans On Manufactured Number Average Value Number Average Value Number Average Value Number Average Value Number Average Value Number Average Value Number Average Value
LOANS ORIGINATED 50 $127,400 512 $94,873 417 $98,820 108 $20,380 3 $442,667 125 $83,712 0 $0 APPLICATIONS APPROVED, NOT ACCEPTED 1 $125,000 121 $89,769 115 $96,548 26 $20,308 0 $0 45 $78,311 0 $0 APPLICATIONS DENIED 4 $110,750 237 $102,920 407 $113,988 117 $27,197 1 $420,000 75 $95,560 1 $33,000 APPLICATIONS WITHDRAWN 5 $109,600 92 $89,065 144 $109,160 20 $41,600 0 $0 27 $79,778 0 $0 FILES CLOSED FOR INCOMPLETENESS 0 $0 15 $103,800 56 $117,661 3 $60,333 0 $0 8 $101,750 0 $0
Aggregated Statistics For Year 2005(Based on 7 full tracts) A) FHA, FSA/RHS & VA B) Conventional C) Refinancings D) Home Improvement Loans E) Loans on Dwellings For 5+ Families F) Non-occupant Loans on G) Loans On Manufactured Number Average Value Number Average Value Number Average Value Number Average Value Number Average Value Number Average Value Number Average Value
LOANS ORIGINATED 58 $130,948 585 $101,855 573 $101,557 76 $41,816 4 $458,750 128 $92,117 0 $0 APPLICATIONS APPROVED, NOT ACCEPTED 3 $100,667 73 $89,932 136 $102,169 17 $28,824 1 $310,000 8 $63,375 0 $0 APPLICATIONS DENIED 8 $135,875 169 $101,757 468 $117,169 113 $35,920 0 $0 43 $100,698 3 $119,000 APPLICATIONS WITHDRAWN 7 $105,571 93 $95,688 232 $126,759 22 $101,318 2 $310,500 27 $89,963 0 $0 FILES CLOSED FOR INCOMPLETENESS 0 $0 15 $122,200 48 $114,750 1 $26,000 0 $0 5 $104,800 0 $0
Aggregated Statistics For Year 2004(Based on 7 full tracts) A) FHA, FSA/RHS & VA B) Conventional C) Refinancings D) Home Improvement Loans E) Loans on Dwellings For 5+ Families F) Non-occupant Loans on G) Loans On Manufactured Number Average Value Number Average Value Number Average Value Number Average Value Number Average Value Number Average Value Number Average Value
LOANS ORIGINATED 70 $129,200 556 $103,228 621 $101,961 109 $33,550 3 $485,000 106 $97,717 0 $0 APPLICATIONS APPROVED, NOT ACCEPTED 1 $128,000 76 $116,171 133 $103,451 31 $32,806 0 $0 19 $102,158 0 $0 APPLICATIONS DENIED 14 $129,357 108 $101,426 486 $114,459 173 $24,584 0 $0 41 $81,829 2 $91,500 APPLICATIONS WITHDRAWN 9 $121,444 70 $110,957 231 $115,000 20 $74,400 0 $0 18 $88,667 1 $120,000 FILES CLOSED FOR INCOMPLETENESS 0 $0 16 $145,812 82 $119,427 5 $26,400 0 $0 3 $87,667 0 $0
Aggregated Statistics For Year 2003(Based on 7 full tracts) A) FHA, FSA/RHS & VA B) Conventional C) Refinancings D) Home Improvement Loans F) Non-occupant Loans on Number Average Value Number Average Value Number Average Value Number Average Value Number Average Value
LOANS ORIGINATED 86 $124,884 476 $103,792 1,346 $98,684 66 $13,288 119 $84,908 APPLICATIONS APPROVED, NOT ACCEPTED 4 $118,500 50 $110,720 192 $96,438 19 $17,579 21 $96,143 APPLICATIONS DENIED 9 $129,222 89 $107,528 472 $103,375 115 $16,365 44 $92,909 APPLICATIONS WITHDRAWN 5 $113,400 56 $108,161 249 $105,622 6 $7,000 19 $76,789 FILES CLOSED FOR INCOMPLETENESS 0 $0 10 $127,100 57 $107,281 3 $9,667 5 $100,200
Aggregated Statistics For Year 2002(Based on 7 full tracts) A) FHA, FSA/RHS & VA B) Conventional C) Refinancings D) Home Improvement Loans F) Non-occupant Loans on Number Average Value Number Average Value Number Average Value Number Average Value Number Average Value
LOANS ORIGINATED 101 $115,713 383 $98,392 915 $97,236 88 $12,023 108 $88,463 APPLICATIONS APPROVED, NOT ACCEPTED 4 $123,500 40 $109,300 164 $98,659 15 $8,067 3 $78,000 APPLICATIONS DENIED 10 $121,700 54 $98,741 438 $99,146 106 $12,189 7 $99,714 APPLICATIONS WITHDRAWN 13 $97,615 29 $91,862 250 $99,996 13 $21,231 4 $82,000 FILES CLOSED FOR INCOMPLETENESS 3 $123,333 17 $100,000 77 $111,623 5 $15,000 4 $113,250
Aggregated Statistics For Year 2001(Based on 7 full tracts) A) FHA, FSA/RHS & VA B) Conventional C) Refinancings D) Home Improvement Loans F) Non-occupant Loans on Number Average Value Number Average Value Number Average Value Number Average Value Number Average Value
LOANS ORIGINATED 135 $111,711 413 $92,237 847 $91,498 130 $13,277 50 $77,900 APPLICATIONS APPROVED, NOT ACCEPTED 1 $89,000 39 $82,513 174 $86,718 40 $18,125 2 $125,500 APPLICATIONS DENIED 4 $121,500 62 $97,194 491 $90,391 125 $12,448 12 $77,583 APPLICATIONS WITHDRAWN 13 $102,615 39 $101,744 211 $94,237 17 $23,000 4 $72,500 FILES CLOSED FOR INCOMPLETENESS 0 $0 11 $109,636 52 $101,346 6 $38,500 3 $95,333
Aggregated Statistics For Year 2000(Based on 7 full tracts) A) FHA, FSA/RHS & VA B) Conventional C) Refinancings D) Home Improvement Loans E) Loans on Dwellings For 5+ Families F) Non-occupant Loans on Number Average Value Number Average Value Number Average Value Number Average Value Number Average Value Number Average Value
LOANS ORIGINATED 106 $104,132 364 $91,860 245 $79,424 128 $15,414 1 $348,000 36 $76,306 APPLICATIONS APPROVED, NOT ACCEPTED 4 $111,250 36 $91,972 96 $83,698 70 $16,029 1 $212,000 6 $68,500 APPLICATIONS DENIED 10 $105,100 78 $89,615 329 $85,596 136 $14,265 0 $0 8 $66,750 APPLICATIONS WITHDRAWN 4 $137,000 49 $98,408 145 $87,669 13 $36,692 0 $0 4 $99,750 FILES CLOSED FOR INCOMPLETENESS 3 $92,667 17 $89,118 41 $90,585 4 $9,750 0 $0 0 $0
Aggregated Statistics For Year 1999(Based on 7 full tracts) A) FHA, FSA/RHS & VA B) Conventional C) Refinancings D) Home Improvement Loans E) Loans on Dwellings For 5+ Families F) Non-occupant Loans on Number Average Value Number Average Value Number Average Value Number Average Value Number Average Value Number Average Value
LOANS ORIGINATED 129 $94,668 379 $90,419 494 $77,906 149 $11,959 1 $313,540 50 $65,344 APPLICATIONS APPROVED, NOT ACCEPTED 1 $97,420 43 $81,859 141 $81,348 59 $14,867 0 $0 10 $61,868 APPLICATIONS DENIED 6 $104,015 62 $93,054 297 $78,189 150 $13,646 0 $0 6 $64,250 APPLICATIONS WITHDRAWN 8 $95,796 43 $84,145 200 $78,568 23 $36,364 0 $0 7 $59,349 FILES CLOSED FOR INCOMPLETENESS 1 $89,530 10 $71,546 55 $91,690 1 $54,710 0 $0 0 $0
Detailed HMDA statistics for the following Tracts:
1851.01
, 1851.02 , 1851.03 , 1851.04 , 1852.01 , 1852.02 , 1852.03
Private Mortgage Insurance Companies Aggregated Statistics For Year 2009(Based on 6 full tracts) A) Conventional B) Refinancings C) Non-occupant Loans on Number Average Value Number Average Value Number Average Value
LOANS ORIGINATED 10 $93,900 7 $125,857 0 $0 APPLICATIONS APPROVED, NOT ACCEPTED 5 $100,600 5 $142,200 1 $87,000 APPLICATIONS DENIED 1 $145,000 3 $133,667 0 $0 APPLICATIONS WITHDRAWN 0 $0 2 $104,000 0 $0 FILES CLOSED FOR INCOMPLETENESS 2 $80,500 0 $0 1 $87,000
Aggregated Statistics For Year 2008(Based on 7 full tracts) A) Conventional B) Refinancings C) Non-occupant Loans on Number Average Value Number Average Value Number Average Value
LOANS ORIGINATED 49 $96,510 15 $120,533 12 $78,000 APPLICATIONS APPROVED, NOT ACCEPTED 22 $97,409 16 $128,062 7 $99,286 APPLICATIONS DENIED 6 $100,833 0 $0 2 $99,000 APPLICATIONS WITHDRAWN 5 $65,800 1 $100,000 3 $57,333 FILES CLOSED FOR INCOMPLETENESS 0 $0 0 $0 0 $0
Aggregated Statistics For Year 2007(Based on 7 full tracts) A) Conventional B) Refinancings C) Non-occupant Loans on Number Average Value Number Average Value Number Average Value
LOANS ORIGINATED 104 $112,808 40 $129,375 10 $81,800 APPLICATIONS APPROVED, NOT ACCEPTED 19 $104,368 15 $140,000 8 $96,250 APPLICATIONS DENIED 6 $106,500 0 $0 4 $104,750 APPLICATIONS WITHDRAWN 4 $107,000 0 $0 1 $62,000 FILES CLOSED FOR INCOMPLETENESS 0 $0 0 $0 0 $0
Aggregated Statistics For Year 2006(Based on 7 full tracts) A) Conventional B) Refinancings C) Non-occupant Loans on Number Average Value Number Average Value Number Average Value
LOANS ORIGINATED 99 $117,394 25 $127,960 12 $89,833 APPLICATIONS APPROVED, NOT ACCEPTED 10 $113,600 10 $129,200 1 $56,000 APPLICATIONS DENIED 0 $0 1 $115,000 0 $0 APPLICATIONS WITHDRAWN 1 $110,000 2 $108,000 0 $0 FILES CLOSED FOR INCOMPLETENESS 0 $0 1 $119,000 0 $0
Aggregated Statistics For Year 2005(Based on 7 full tracts) A) Conventional B) Refinancings C) Non-occupant Loans on Number Average Value Number Average Value Number Average Value
LOANS ORIGINATED 83 $121,410 43 $121,837 17 $107,529 APPLICATIONS APPROVED, NOT ACCEPTED 11 $122,727 13 $123,846 1 $90,000 APPLICATIONS DENIED 2 $92,000 1 $120,000 2 $92,000 APPLICATIONS WITHDRAWN 5 $101,400 4 $129,500 2 $108,500 FILES CLOSED FOR INCOMPLETENESS 0 $0 0 $0 0 $0
Aggregated Statistics For Year 2004(Based on 7 full tracts) A) Conventional B) Refinancings C) Non-occupant Loans on Number Average Value Number Average Value Number Average Value
LOANS ORIGINATED 127 $112,220 44 $123,636 17 $95,412 APPLICATIONS APPROVED, NOT ACCEPTED 20 $134,750 30 $122,900 2 $88,000 APPLICATIONS DENIED 2 $161,500 1 $164,000 0 $0 APPLICATIONS WITHDRAWN 4 $109,750 6 $124,333 2 $122,500 FILES CLOSED FOR INCOMPLETENESS 0 $0 0 $0 0 $0
Aggregated Statistics For Year 2003(Based on 7 full tracts) A) Conventional B) Refinancings C) Non-occupant Loans on Number Average Value Number Average Value Number Average Value
LOANS ORIGINATED 118 $117,042 148 $119,135 21 $103,238 APPLICATIONS APPROVED, NOT ACCEPTED 23 $118,391 34 $118,059 4 $114,250 APPLICATIONS DENIED 1 $77,000 5 $125,600 2 $118,500 APPLICATIONS WITHDRAWN 5 $99,200 12 $121,250 1 $130,000 FILES CLOSED FOR INCOMPLETENESS 0 $0 0 $0 0 $0
Aggregated Statistics For Year 2002(Based on 7 full tracts) A) Conventional B) Refinancings C) Non-occupant Loans on Number Average Value Number Average Value Number Average Value
LOANS ORIGINATED 126 $115,087 106 $113,934 16 $95,000 APPLICATIONS APPROVED, NOT ACCEPTED 18 $116,556 31 $121,710 4 $96,500 APPLICATIONS DENIED 3 $113,000 6 $118,500 1 $124,000 APPLICATIONS WITHDRAWN 8 $97,625 17 $115,000 2 $128,000 FILES CLOSED FOR INCOMPLETENESS 0 $0 5 $117,800 0 $0
Aggregated Statistics For Year 2001(Based on 7 full tracts) A) Conventional B) Refinancings C) Non-occupant Loans on Number Average Value Number Average Value Number Average Value
LOANS ORIGINATED 130 $102,092 99 $111,869 9 $102,222 APPLICATIONS APPROVED, NOT ACCEPTED 17 $88,529 24 $116,792 2 $85,000 APPLICATIONS DENIED 3 $84,333 3 $107,000 2 $81,000 APPLICATIONS WITHDRAWN 1 $65,000 7 $106,714 0 $0 FILES CLOSED FOR INCOMPLETENESS 1 $90,000 0 $0 0 $0
Aggregated Statistics For Year 2000(Based on 7 full tracts) A) Conventional B) Refinancings C) Non-occupant Loans on Number Average Value Number Average Value Number Average Value
LOANS ORIGINATED 143 $99,741 24 $103,625 10 $83,000 APPLICATIONS APPROVED, NOT ACCEPTED 12 $102,333 13 $109,154 0 $0 APPLICATIONS DENIED 2 $126,000 3 $131,000 0 $0 APPLICATIONS WITHDRAWN 4 $112,500 2 $116,500 0 $0 FILES CLOSED FOR INCOMPLETENESS 0 $0 1 $79,000 0 $0
Aggregated Statistics For Year 1999(Based on 7 full tracts) A) Conventional B) Refinancings C) Non-occupant Loans on Number Average Value Number Average Value Number Average Value
LOANS ORIGINATED 149 $95,164 48 $98,223 6 $78,920 APPLICATIONS APPROVED, NOT ACCEPTED 14 $95,081 10 $101,803 0 $0 APPLICATIONS DENIED 10 $94,690 6 $91,015 2 $87,540 APPLICATIONS WITHDRAWN 3 $106,963 2 $78,355 0 $0 FILES CLOSED FOR INCOMPLETENESS 4 $73,465 0 $0 0 $0
Detailed PMIC statistics for the following Tracts:
1851.01
, 1851.02 , 1851.03 , 1851.04 , 1852.01 , 1852.02 , 1852.03 South Euclid compared to Ohio state average:
Unemployed percentage significantly below state average. Black race population percentage significantly above state average. Hispanic race population percentage below state average. Renting percentage below state average. Length of stay since moving in above state average. Percentage of population with a bachelor's degree or higher above state average. South Euclid on our top lists :
#76 on the list of "Top 101 cities with the smallest racial income disparities between White and Black householders (with at least 2,000 householders)"
#5 on the list of "Top 101 counties with the most Orthodox congregations"
#9 on the list of "Top 101 counties with the most Catholic congregations"
#9 on the list of "Top 101 counties with the most Orthodox adherents"
#10 on the list of "Top 101 counties with the most Black Protestant congregations"
#11 on the list of "Top 101 counties with the most Mainline Protestant congregations (pop. 50,000+)"
Top Patent Applicants
Paul A. Weissbrod (35)
Taryl J. Jasper (28)
Taryl Jon Jasper (16)
Taryl Jasper (10)
David C. Dudik (10)
Yefim Vaks (9)
Howard L. Senkfor (8)
Brian Roberts (8)
Howard Senkfor (5)
Thomas O. Mera (5)
Total of 215 patent applications in 2008-2024.
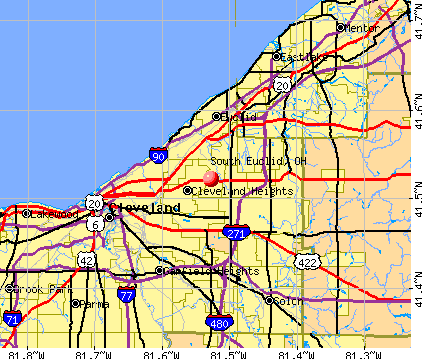


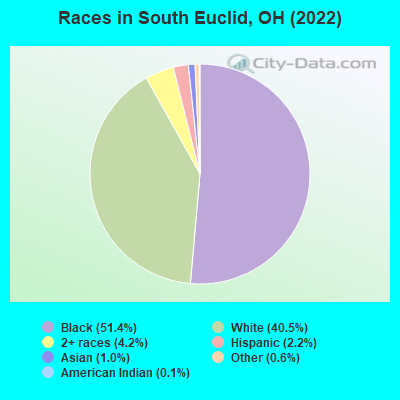
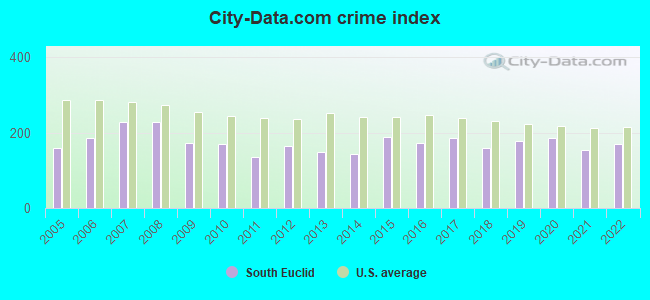
 Recent articles from our blog. Our writers, many of them Ph.D. graduates or candidates, create easy-to-read articles on a wide variety of topics.

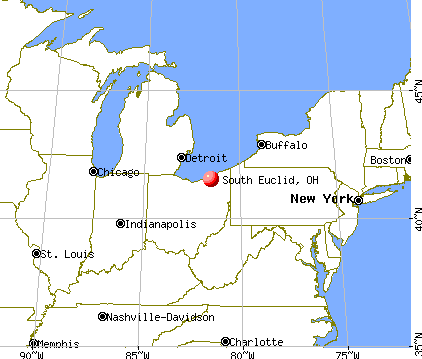
 (5.1 miles
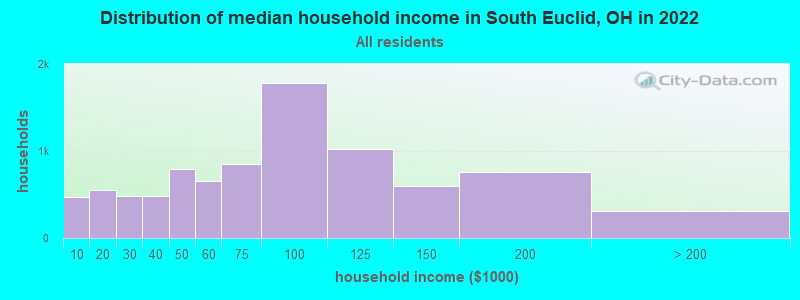
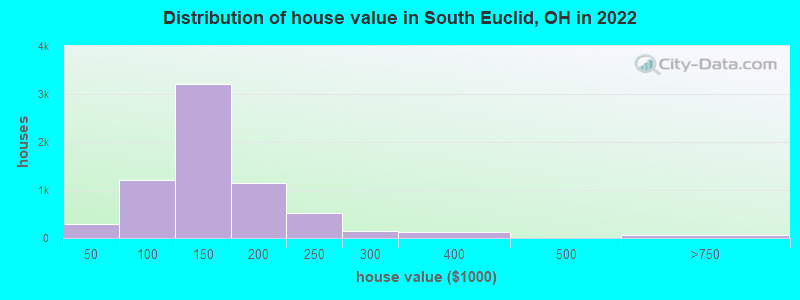

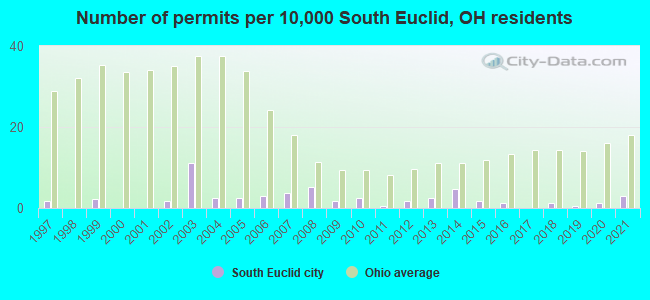
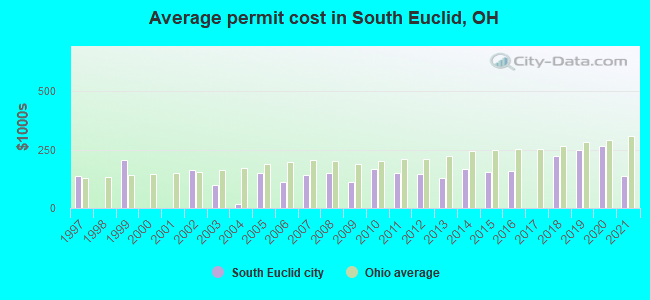
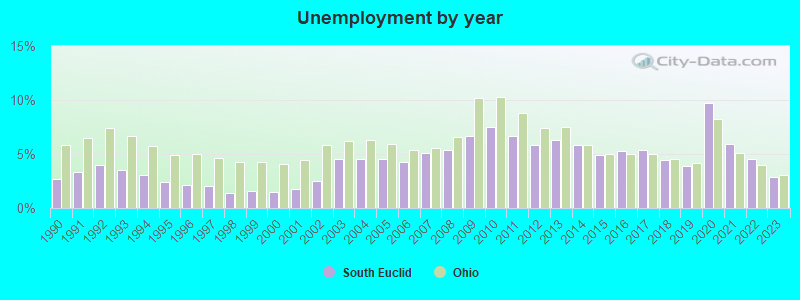
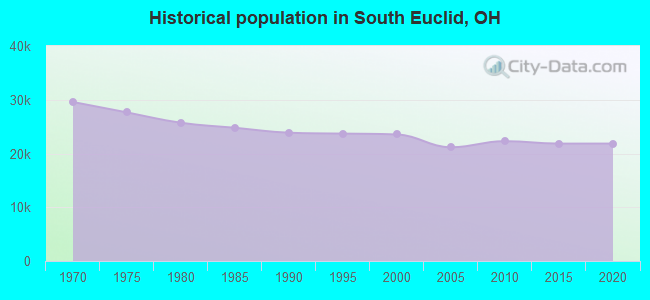
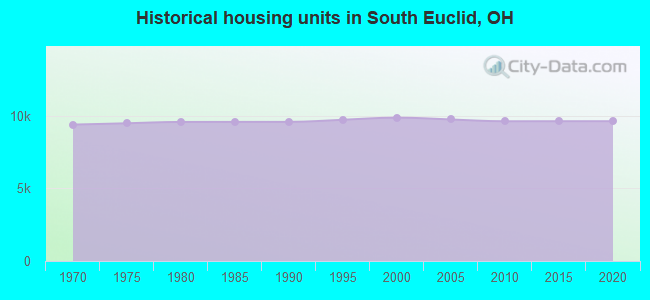
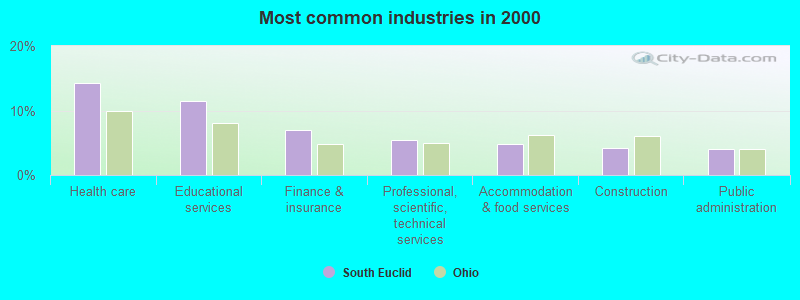
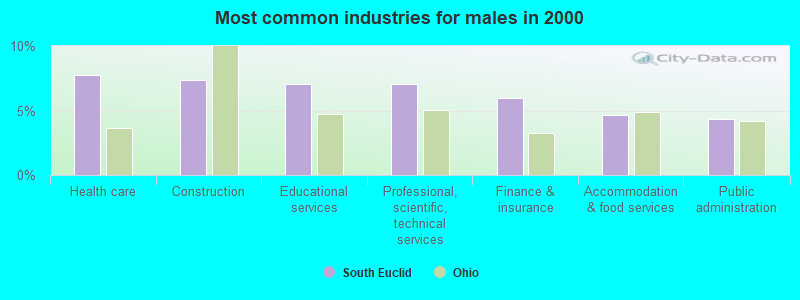
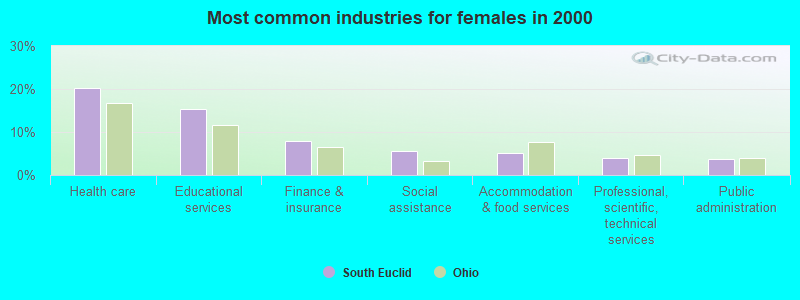
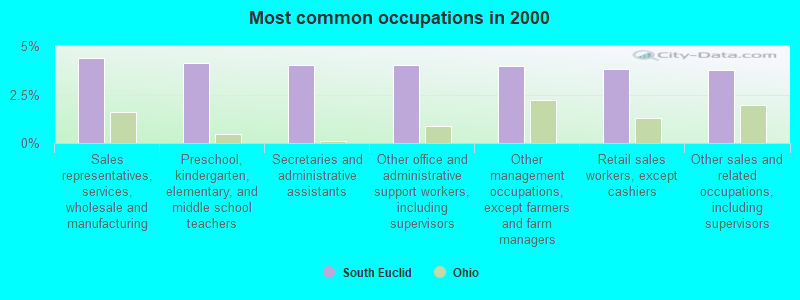
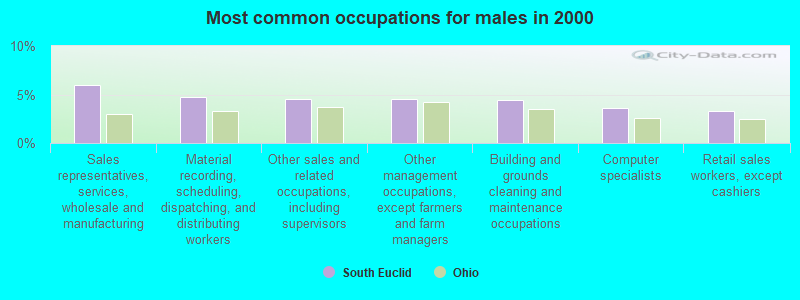
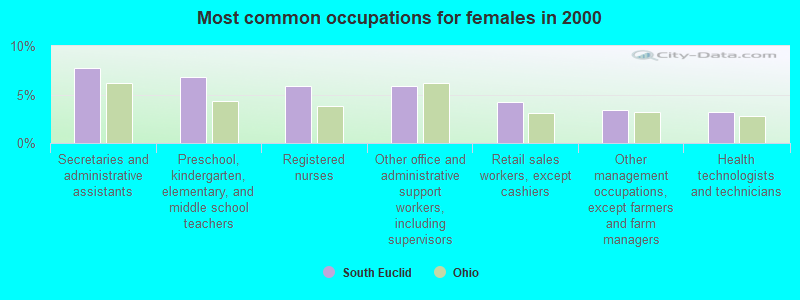


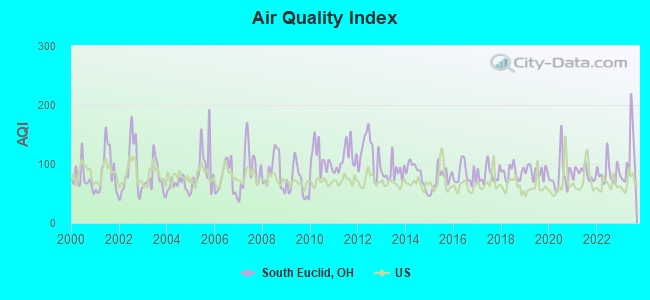
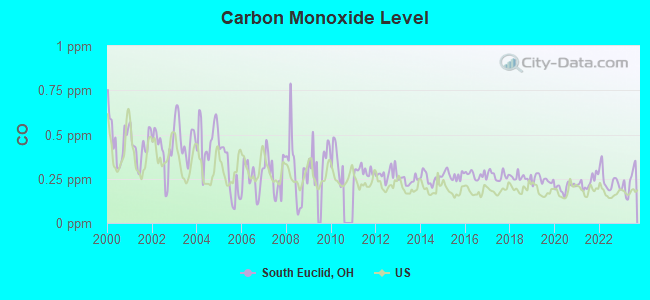
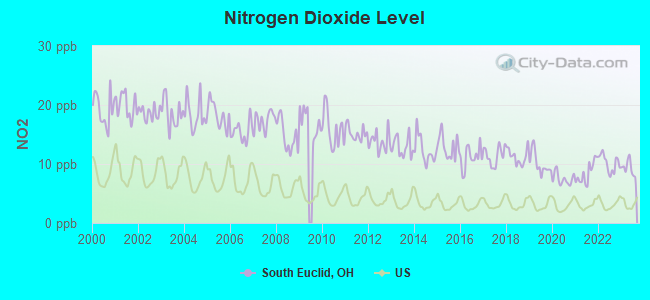
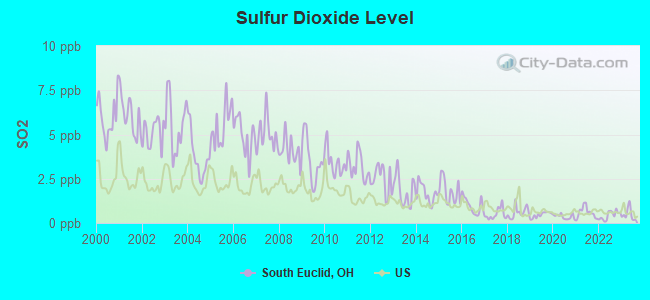
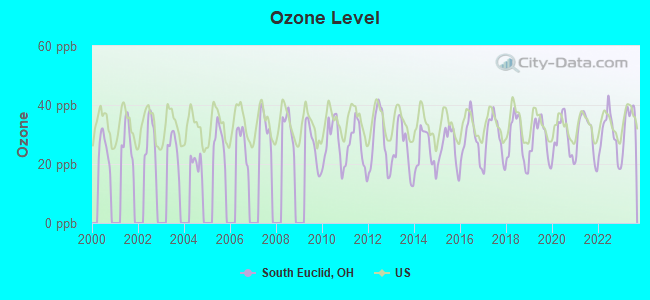
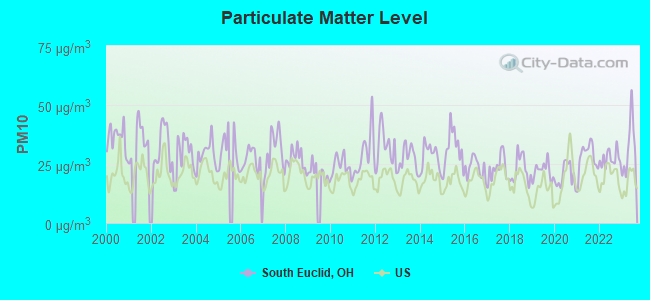
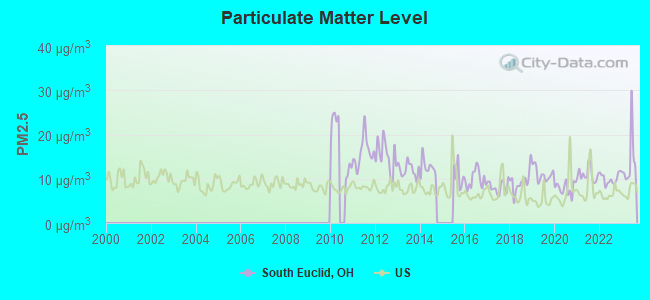
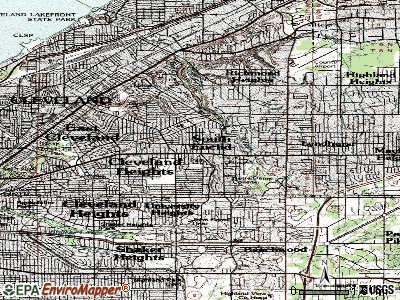
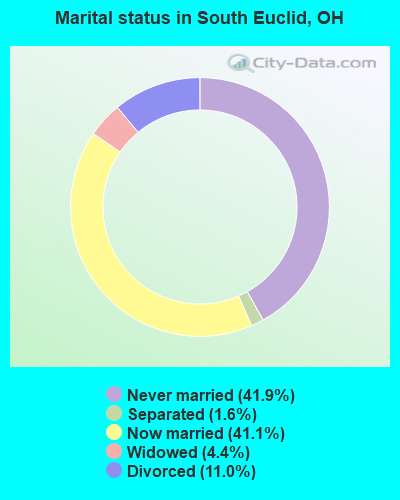
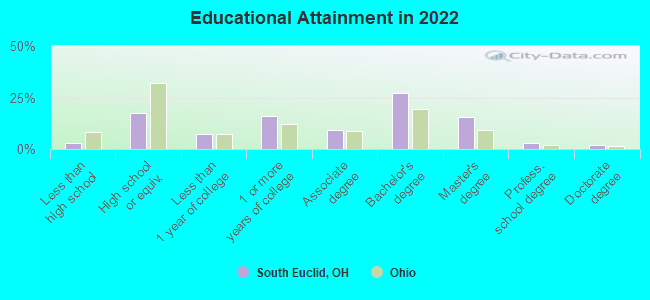
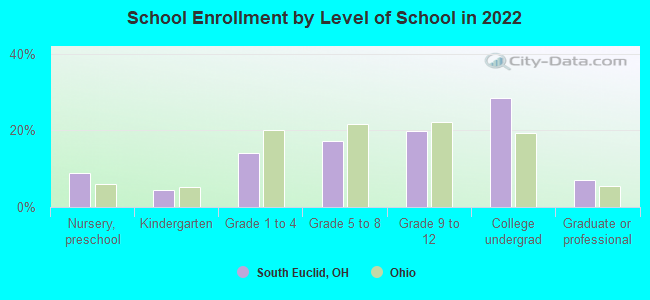
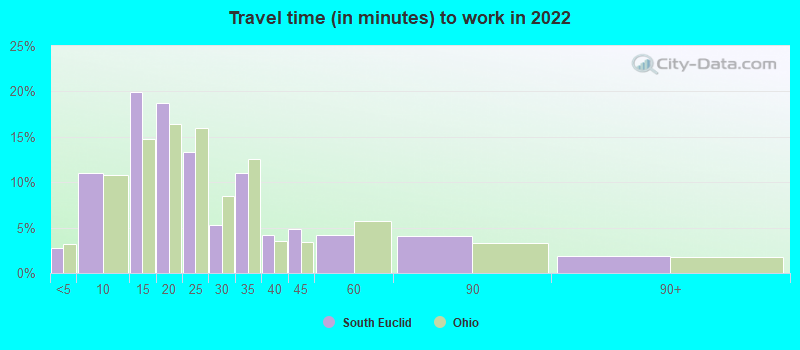
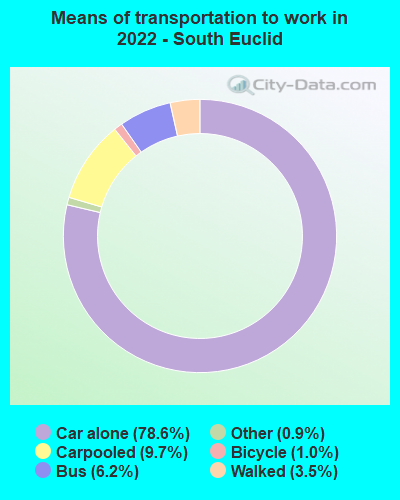
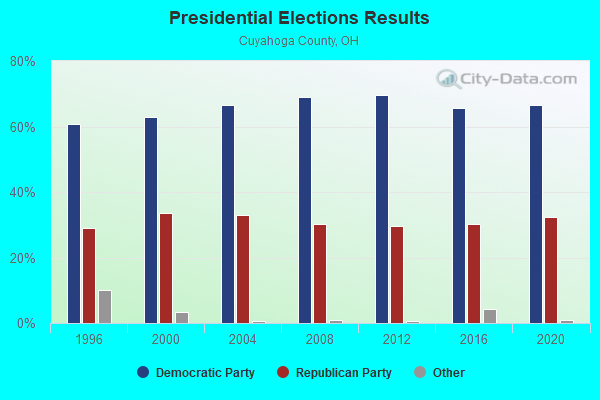
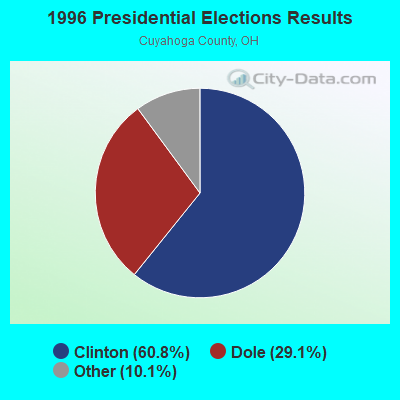
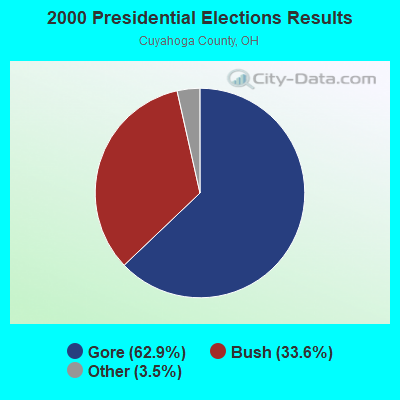
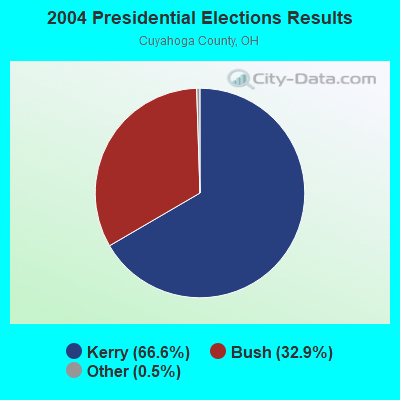
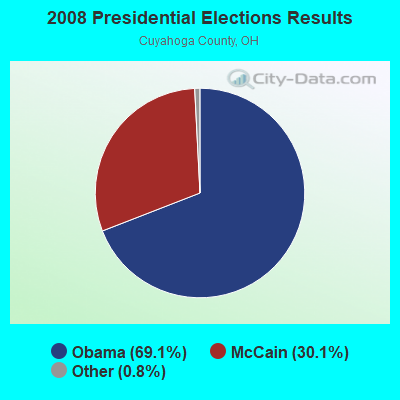
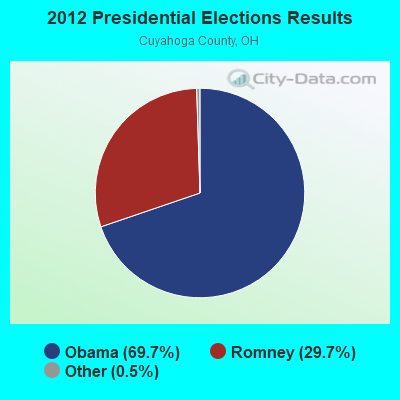
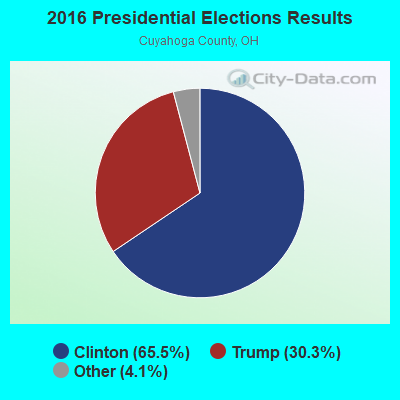
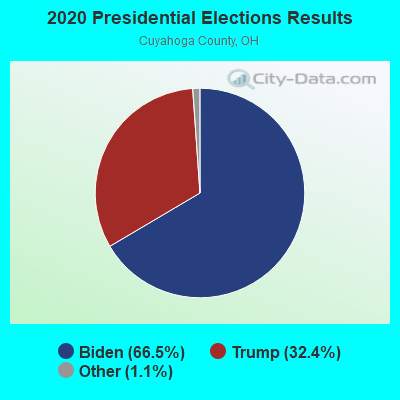
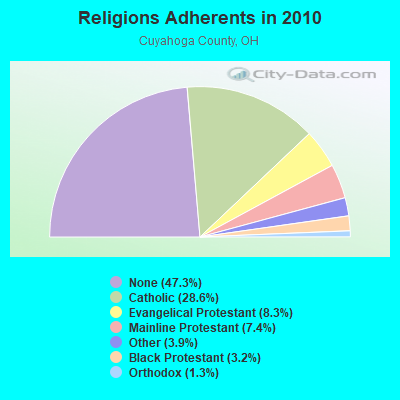
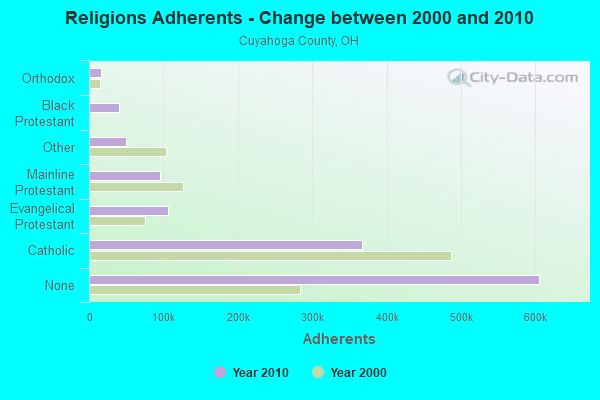
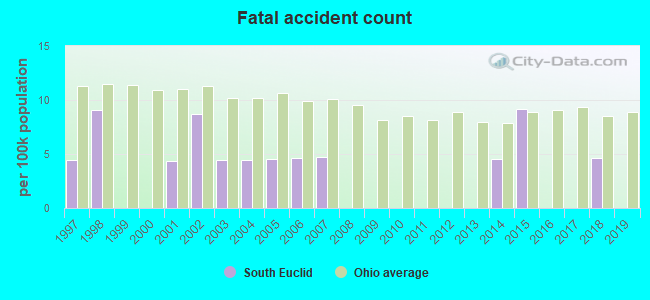
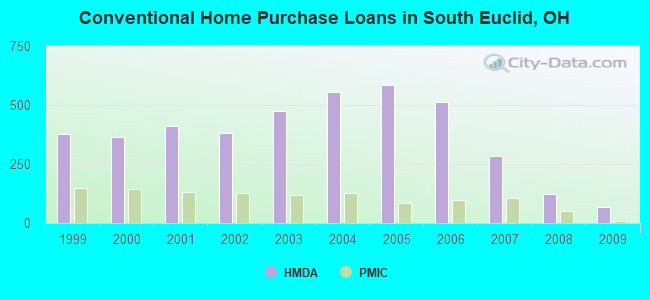
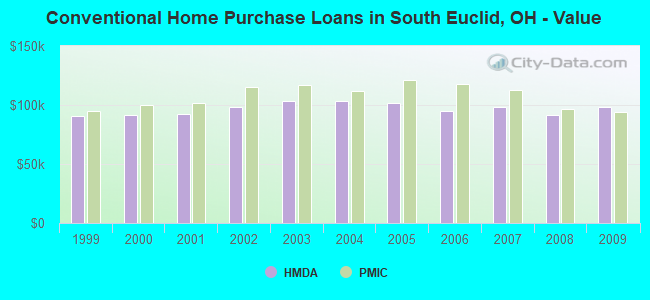
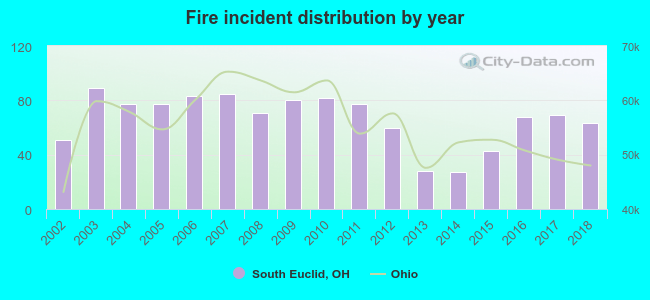 Based on the data from the years 2002 - 2018 the average number of fire incidents per year is 66. The highest number of reported fires - 89 took place in 2003, and the least - 27 in 2014. The data has a growing trend.
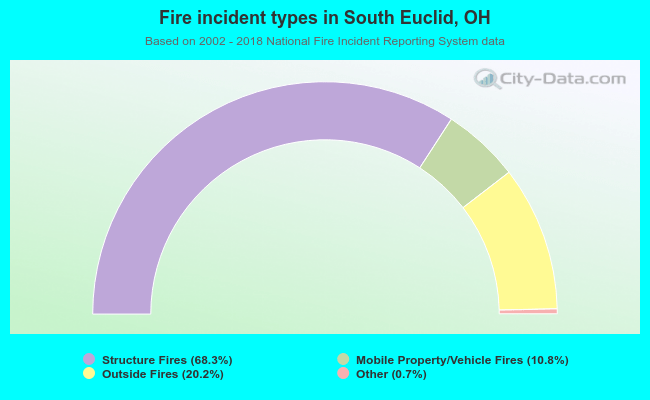 When looking into fire subcategories, the most reports belonged to: Structure Fires (68.3%), and Outside Fires (20.2%).