Shaker Heights, Ohio Submit your own pictures of this city and show them to the world
OSM Map
General Map
Google Map
MSN Map
OSM Map
General Map
Google Map
MSN Map
OSM Map
General Map
Google Map
MSN Map
OSM Map
General Map
Google Map
MSN Map
Please wait while loading the map...
Population in 2022: 28,723 (100% urban, 0% rural). Population change since 2000: -2.3%Males: 13,163 Females: 15,560
March 2022 cost of living index in Shaker Heights: 95.9 (near average, U.S. average is 100) Percentage of residents living in poverty in 2022: 8.4%for White Non-Hispanic residents , 15.2% for Black residents , 3.5% for Hispanic or Latino residents , 38.5% for American Indian residents , 5.1% for two or more races residents )
Profiles of local businesses
Business Search - 14 Million verified businesses
Data:
Median household income ($)
Median household income (% change since 2000)
Household income diversity
Ratio of average income to average house value (%)
Ratio of average income to average rent
Median household income ($) - White
Median household income ($) - Black or African American
Median household income ($) - Asian
Median household income ($) - Hispanic or Latino
Median household income ($) - American Indian and Alaska Native
Median household income ($) - Multirace
Median household income ($) - Other Race
Median household income for houses/condos with a mortgage ($)
Median household income for apartments without a mortgage ($)
Races - White alone (%)
Races - White alone (% change since 2000)
Races - Black alone (%)
Races - Black alone (% change since 2000)
Races - American Indian alone (%)
Races - American Indian alone (% change since 2000)
Races - Asian alone (%)
Races - Asian alone (% change since 2000)
Races - Hispanic (%)
Races - Hispanic (% change since 2000)
Races - Native Hawaiian and Other Pacific Islander alone (%)
Races - Native Hawaiian and Other Pacific Islander alone (% change since 2000)
Races - Two or more races (%)
Races - Two or more races (% change since 2000)
Races - Other race alone (%)
Races - Other race alone (% change since 2000)
Racial diversity
Unemployment (%)
Unemployment (% change since 2000)
Unemployment (%) - White
Unemployment (%) - Black or African American
Unemployment (%) - Asian
Unemployment (%) - Hispanic or Latino
Unemployment (%) - American Indian and Alaska Native
Unemployment (%) - Multirace
Unemployment (%) - Other Race
Population density (people per square mile)
Population - Males (%)
Population - Females (%)
Population - Males (%) - White
Population - Males (%) - Black or African American
Population - Males (%) - Asian
Population - Males (%) - Hispanic or Latino
Population - Males (%) - American Indian and Alaska Native
Population - Males (%) - Multirace
Population - Males (%) - Other Race
Population - Females (%) - White
Population - Females (%) - Black or African American
Population - Females (%) - Asian
Population - Females (%) - Hispanic or Latino
Population - Females (%) - American Indian and Alaska Native
Population - Females (%) - Multirace
Population - Females (%) - Other Race
Coronavirus confirmed cases (Apr 27, 2024)
Deaths caused by coronavirus (Apr 27, 2024)
Coronavirus confirmed cases (per 100k population) (Apr 27, 2024)
Deaths caused by coronavirus (per 100k population) (Apr 27, 2024)
Daily increase in number of cases (Apr 27, 2024)
Weekly increase in number of cases (Apr 27, 2024)
Cases doubled (in days) (Apr 27, 2024)
Hospitalized patients (Apr 18, 2022)
Negative test results (Apr 18, 2022)
Total test results (Apr 18, 2022)
COVID Vaccine doses distributed (per 100k population) (Sep 19, 2023)
COVID Vaccine doses administered (per 100k population) (Sep 19, 2023)
COVID Vaccine doses distributed (Sep 19, 2023)
COVID Vaccine doses administered (Sep 19, 2023)
Likely homosexual households (%)
Likely homosexual households (% change since 2000)
Likely homosexual households - Lesbian couples (%)
Likely homosexual households - Lesbian couples (% change since 2000)
Likely homosexual households - Gay men (%)
Likely homosexual households - Gay men (% change since 2000)
Cost of living index
Median gross rent ($)
Median contract rent ($)
Median monthly housing costs ($)
Median house or condo value ($)
Median house or condo value ($ change since 2000)
Mean house or condo value by units in structure - 1, detached ($)
Mean house or condo value by units in structure - 1, attached ($)
Mean house or condo value by units in structure - 2 ($)
Mean house or condo value by units in structure by units in structure - 3 or 4 ($)
Mean house or condo value by units in structure - 5 or more ($)
Mean house or condo value by units in structure - Boat, RV, van, etc. ($)
Mean house or condo value by units in structure - Mobile home ($)
Median house or condo value ($) - White
Median house or condo value ($) - Black or African American
Median house or condo value ($) - Asian
Median house or condo value ($) - Hispanic or Latino
Median house or condo value ($) - American Indian and Alaska Native
Median house or condo value ($) - Multirace
Median house or condo value ($) - Other Race
Median resident age
Resident age diversity
Median resident age - Males
Median resident age - Females
Median resident age - White
Median resident age - Black or African American
Median resident age - Asian
Median resident age - Hispanic or Latino
Median resident age - American Indian and Alaska Native
Median resident age - Multirace
Median resident age - Other Race
Median resident age - Males - White
Median resident age - Males - Black or African American
Median resident age - Males - Asian
Median resident age - Males - Hispanic or Latino
Median resident age - Males - American Indian and Alaska Native
Median resident age - Males - Multirace
Median resident age - Males - Other Race
Median resident age - Females - White
Median resident age - Females - Black or African American
Median resident age - Females - Asian
Median resident age - Females - Hispanic or Latino
Median resident age - Females - American Indian and Alaska Native
Median resident age - Females - Multirace
Median resident age - Females - Other Race
Commute - mean travel time to work (minutes)
Travel time to work - Less than 5 minutes (%)
Travel time to work - Less than 5 minutes (% change since 2000)
Travel time to work - 5 to 9 minutes (%)
Travel time to work - 5 to 9 minutes (% change since 2000)
Travel time to work - 10 to 19 minutes (%)
Travel time to work - 10 to 19 minutes (% change since 2000)
Travel time to work - 20 to 29 minutes (%)
Travel time to work - 20 to 29 minutes (% change since 2000)
Travel time to work - 30 to 39 minutes (%)
Travel time to work - 30 to 39 minutes (% change since 2000)
Travel time to work - 40 to 59 minutes (%)
Travel time to work - 40 to 59 minutes (% change since 2000)
Travel time to work - 60 to 89 minutes (%)
Travel time to work - 60 to 89 minutes (% change since 2000)
Travel time to work - 90 or more minutes (%)
Travel time to work - 90 or more minutes (% change since 2000)
Marital status - Never married (%)
Marital status - Now married (%)
Marital status - Separated (%)
Marital status - Widowed (%)
Marital status - Divorced (%)
Median family income ($)
Median family income (% change since 2000)
Median non-family income ($)
Median non-family income (% change since 2000)
Median per capita income ($)
Median per capita income (% change since 2000)
Median family income ($) - White
Median family income ($) - Black or African American
Median family income ($) - Asian
Median family income ($) - Hispanic or Latino
Median family income ($) - American Indian and Alaska Native
Median family income ($) - Multirace
Median family income ($) - Other Race
Median year house/condo built
Median year apartment built
Year house built - Built 2005 or later (%)
Year house built - Built 2000 to 2004 (%)
Year house built - Built 1990 to 1999 (%)
Year house built - Built 1980 to 1989 (%)
Year house built - Built 1970 to 1979 (%)
Year house built - Built 1960 to 1969 (%)
Year house built - Built 1950 to 1959 (%)
Year house built - Built 1940 to 1949 (%)
Year house built - Built 1939 or earlier (%)
Average household size
Household density (households per square mile)
Average household size - White
Average household size - Black or African American
Average household size - Asian
Average household size - Hispanic or Latino
Average household size - American Indian and Alaska Native
Average household size - Multirace
Average household size - Other Race
Occupied housing units (%)
Vacant housing units (%)
Owner occupied housing units (%)
Renter occupied housing units (%)
Vacancy status - For rent (%)
Vacancy status - For sale only (%)
Vacancy status - Rented or sold, not occupied (%)
Vacancy status - For seasonal, recreational, or occasional use (%)
Vacancy status - For migrant workers (%)
Vacancy status - Other vacant (%)
Residents with income below the poverty level (%)
Residents with income below 50% of the poverty level (%)
Children below poverty level (%)
Poor families by family type - Married-couple family (%)
Poor families by family type - Male, no wife present (%)
Poor families by family type - Female, no husband present (%)
Poverty status for native-born residents (%)
Poverty status for foreign-born residents (%)
Poverty among high school graduates not in families (%)
Poverty among people who did not graduate high school not in families (%)
Residents with income below the poverty level (%) - White
Residents with income below the poverty level (%) - Black or African American
Residents with income below the poverty level (%) - Asian
Residents with income below the poverty level (%) - Hispanic or Latino
Residents with income below the poverty level (%) - American Indian and Alaska Native
Residents with income below the poverty level (%) - Multirace
Residents with income below the poverty level (%) - Other Race
Air pollution - Air Quality Index (AQI)
Air pollution - CO
Air pollution - NO2
Air pollution - SO2
Air pollution - Ozone
Air pollution - PM10
Air pollution - PM25
Air pollution - Pb
Crime - Murders per 100,000 population
Crime - Rapes per 100,000 population
Crime - Robberies per 100,000 population
Crime - Assaults per 100,000 population
Crime - Burglaries per 100,000 population
Crime - Thefts per 100,000 population
Crime - Auto thefts per 100,000 population
Crime - Arson per 100,000 population
Crime - City-data.com crime index
Crime - Violent crime index
Crime - Property crime index
Crime - Murders per 100,000 population (5 year average)
Crime - Rapes per 100,000 population (5 year average)
Crime - Robberies per 100,000 population (5 year average)
Crime - Assaults per 100,000 population (5 year average)
Crime - Burglaries per 100,000 population (5 year average)
Crime - Thefts per 100,000 population (5 year average)
Crime - Auto thefts per 100,000 population (5 year average)
Crime - Arson per 100,000 population (5 year average)
Crime - City-data.com crime index (5 year average)
Crime - Violent crime index (5 year average)
Crime - Property crime index (5 year average)
1996 Presidential Elections Results (%) - Democratic Party (Clinton)
1996 Presidential Elections Results (%) - Republican Party (Dole)
1996 Presidential Elections Results (%) - Other
2000 Presidential Elections Results (%) - Democratic Party (Gore)
2000 Presidential Elections Results (%) - Republican Party (Bush)
2000 Presidential Elections Results (%) - Other
2004 Presidential Elections Results (%) - Democratic Party (Kerry)
2004 Presidential Elections Results (%) - Republican Party (Bush)
2004 Presidential Elections Results (%) - Other
2008 Presidential Elections Results (%) - Democratic Party (Obama)
2008 Presidential Elections Results (%) - Republican Party (McCain)
2008 Presidential Elections Results (%) - Other
2012 Presidential Elections Results (%) - Democratic Party (Obama)
2012 Presidential Elections Results (%) - Republican Party (Romney)
2012 Presidential Elections Results (%) - Other
2016 Presidential Elections Results (%) - Democratic Party (Clinton)
2016 Presidential Elections Results (%) - Republican Party (Trump)
2016 Presidential Elections Results (%) - Other
2020 Presidential Elections Results (%) - Democratic Party (Biden)
2020 Presidential Elections Results (%) - Republican Party (Trump)
2020 Presidential Elections Results (%) - Other
Ancestries Reported - Arab (%)
Ancestries Reported - Czech (%)
Ancestries Reported - Danish (%)
Ancestries Reported - Dutch (%)
Ancestries Reported - English (%)
Ancestries Reported - French (%)
Ancestries Reported - French Canadian (%)
Ancestries Reported - German (%)
Ancestries Reported - Greek (%)
Ancestries Reported - Hungarian (%)
Ancestries Reported - Irish (%)
Ancestries Reported - Italian (%)
Ancestries Reported - Lithuanian (%)
Ancestries Reported - Norwegian (%)
Ancestries Reported - Polish (%)
Ancestries Reported - Portuguese (%)
Ancestries Reported - Russian (%)
Ancestries Reported - Scotch-Irish (%)
Ancestries Reported - Scottish (%)
Ancestries Reported - Slovak (%)
Ancestries Reported - Subsaharan African (%)
Ancestries Reported - Swedish (%)
Ancestries Reported - Swiss (%)
Ancestries Reported - Ukrainian (%)
Ancestries Reported - United States (%)
Ancestries Reported - Welsh (%)
Ancestries Reported - West Indian (%)
Ancestries Reported - Other (%)
Educational Attainment - No schooling completed (%)
Educational Attainment - Less than high school (%)
Educational Attainment - High school or equivalent (%)
Educational Attainment - Less than 1 year of college (%)
Educational Attainment - 1 or more years of college (%)
Educational Attainment - Associate degree (%)
Educational Attainment - Bachelor's degree (%)
Educational Attainment - Master's degree (%)
Educational Attainment - Professional school degree (%)
Educational Attainment - Doctorate degree (%)
School Enrollment - Nursery, preschool (%)
School Enrollment - Kindergarten (%)
School Enrollment - Grade 1 to 4 (%)
School Enrollment - Grade 5 to 8 (%)
School Enrollment - Grade 9 to 12 (%)
School Enrollment - College undergrad (%)
School Enrollment - Graduate or professional (%)
School Enrollment - Not enrolled in school (%)
School enrollment - Public schools (%)
School enrollment - Private schools (%)
School enrollment - Not enrolled (%)
Median number of rooms in houses and condos
Median number of rooms in apartments
Housing units lacking complete plumbing facilities (%)
Housing units lacking complete kitchen facilities (%)
Density of houses
Urban houses (%)
Rural houses (%)
Households with people 60 years and over (%)
Households with people 65 years and over (%)
Households with people 75 years and over (%)
Households with one or more nonrelatives (%)
Households with no nonrelatives (%)
Population in households (%)
Family households (%)
Nonfamily households (%)
Population in families (%)
Family households with own children (%)
Median number of bedrooms in owner occupied houses
Mean number of bedrooms in owner occupied houses
Median number of bedrooms in renter occupied houses
Mean number of bedrooms in renter occupied houses
Median number of vehichles in owner occupied houses
Mean number of vehichles in owner occupied houses
Median number of vehichles in renter occupied houses
Mean number of vehichles in renter occupied houses
Mortgage status - with mortgage (%)
Mortgage status - with second mortgage (%)
Mortgage status - with home equity loan (%)
Mortgage status - with both second mortgage and home equity loan (%)
Mortgage status - without a mortgage (%)
Average family size
Average family size - White
Average family size - Black or African American
Average family size - Asian
Average family size - Hispanic or Latino
Average family size - American Indian and Alaska Native
Average family size - Multirace
Average family size - Other Race
Geographical mobility - Same house 1 year ago (%)
Geographical mobility - Moved within same county (%)
Geographical mobility - Moved from different county within same state (%)
Geographical mobility - Moved from different state (%)
Geographical mobility - Moved from abroad (%)
Place of birth - Born in state of residence (%)
Place of birth - Born in other state (%)
Place of birth - Native, outside of US (%)
Place of birth - Foreign born (%)
Housing units in structures - 1, detached (%)
Housing units in structures - 1, attached (%)
Housing units in structures - 2 (%)
Housing units in structures - 3 or 4 (%)
Housing units in structures - 5 to 9 (%)
Housing units in structures - 10 to 19 (%)
Housing units in structures - 20 to 49 (%)
Housing units in structures - 50 or more (%)
Housing units in structures - Mobile home (%)
Housing units in structures - Boat, RV, van, etc. (%)
House/condo owner moved in on average (years ago)
Renter moved in on average (years ago)
Year householder moved into unit - Moved in 1999 to March 2000 (%)
Year householder moved into unit - Moved in 1995 to 1998 (%)
Year householder moved into unit - Moved in 1990 to 1994 (%)
Year householder moved into unit - Moved in 1980 to 1989 (%)
Year householder moved into unit - Moved in 1970 to 1979 (%)
Year householder moved into unit - Moved in 1969 or earlier (%)
Means of transportation to work - Drove car alone (%)
Means of transportation to work - Carpooled (%)
Means of transportation to work - Public transportation (%)
Means of transportation to work - Bus or trolley bus (%)
Means of transportation to work - Streetcar or trolley car (%)
Means of transportation to work - Subway or elevated (%)
Means of transportation to work - Railroad (%)
Means of transportation to work - Ferryboat (%)
Means of transportation to work - Taxicab (%)
Means of transportation to work - Motorcycle (%)
Means of transportation to work - Bicycle (%)
Means of transportation to work - Walked (%)
Means of transportation to work - Other means (%)
Working at home (%)
Industry diversity
Most Common Industries - Agriculture, forestry, fishing and hunting, and mining (%)
Most Common Industries - Agriculture, forestry, fishing and hunting (%)
Most Common Industries - Mining, quarrying, and oil and gas extraction (%)
Most Common Industries - Construction (%)
Most Common Industries - Manufacturing (%)
Most Common Industries - Wholesale trade (%)
Most Common Industries - Retail trade (%)
Most Common Industries - Transportation and warehousing, and utilities (%)
Most Common Industries - Transportation and warehousing (%)
Most Common Industries - Utilities (%)
Most Common Industries - Information (%)
Most Common Industries - Finance and insurance, and real estate and rental and leasing (%)
Most Common Industries - Finance and insurance (%)
Most Common Industries - Real estate and rental and leasing (%)
Most Common Industries - Professional, scientific, and management, and administrative and waste management services (%)
Most Common Industries - Professional, scientific, and technical services (%)
Most Common Industries - Management of companies and enterprises (%)
Most Common Industries - Administrative and support and waste management services (%)
Most Common Industries - Educational services, and health care and social assistance (%)
Most Common Industries - Educational services (%)
Most Common Industries - Health care and social assistance (%)
Most Common Industries - Arts, entertainment, and recreation, and accommodation and food services (%)
Most Common Industries - Arts, entertainment, and recreation (%)
Most Common Industries - Accommodation and food services (%)
Most Common Industries - Other services, except public administration (%)
Most Common Industries - Public administration (%)
Occupation diversity
Most Common Occupations - Management, business, science, and arts occupations (%)
Most Common Occupations - Management, business, and financial occupations (%)
Most Common Occupations - Management occupations (%)
Most Common Occupations - Business and financial operations occupations (%)
Most Common Occupations - Computer, engineering, and science occupations (%)
Most Common Occupations - Computer and mathematical occupations (%)
Most Common Occupations - Architecture and engineering occupations (%)
Most Common Occupations - Life, physical, and social science occupations (%)
Most Common Occupations - Education, legal, community service, arts, and media occupations (%)
Most Common Occupations - Community and social service occupations (%)
Most Common Occupations - Legal occupations (%)
Most Common Occupations - Education, training, and library occupations (%)
Most Common Occupations - Arts, design, entertainment, sports, and media occupations (%)
Most Common Occupations - Healthcare practitioners and technical occupations (%)
Most Common Occupations - Health diagnosing and treating practitioners and other technical occupations (%)
Most Common Occupations - Health technologists and technicians (%)
Most Common Occupations - Service occupations (%)
Most Common Occupations - Healthcare support occupations (%)
Most Common Occupations - Protective service occupations (%)
Most Common Occupations - Fire fighting and prevention, and other protective service workers including supervisors (%)
Most Common Occupations - Law enforcement workers including supervisors (%)
Most Common Occupations - Food preparation and serving related occupations (%)
Most Common Occupations - Building and grounds cleaning and maintenance occupations (%)
Most Common Occupations - Personal care and service occupations (%)
Most Common Occupations - Sales and office occupations (%)
Most Common Occupations - Sales and related occupations (%)
Most Common Occupations - Office and administrative support occupations (%)
Most Common Occupations - Natural resources, construction, and maintenance occupations (%)
Most Common Occupations - Farming, fishing, and forestry occupations (%)
Most Common Occupations - Construction and extraction occupations (%)
Most Common Occupations - Installation, maintenance, and repair occupations (%)
Most Common Occupations - Production, transportation, and material moving occupations (%)
Most Common Occupations - Production occupations (%)
Most Common Occupations - Transportation occupations (%)
Most Common Occupations - Material moving occupations (%)
People in Group quarters - Institutionalized population (%)
People in Group quarters - Correctional institutions (%)
People in Group quarters - Federal prisons and detention centers (%)
People in Group quarters - Halfway houses (%)
People in Group quarters - Local jails and other confinement facilities (including police lockups) (%)
People in Group quarters - Military disciplinary barracks (%)
People in Group quarters - State prisons (%)
People in Group quarters - Other types of correctional institutions (%)
People in Group quarters - Nursing homes (%)
People in Group quarters - Hospitals/wards, hospices, and schools for the handicapped (%)
People in Group quarters - Hospitals/wards and hospices for chronically ill (%)
People in Group quarters - Hospices or homes for chronically ill (%)
People in Group quarters - Military hospitals or wards for chronically ill (%)
People in Group quarters - Other hospitals or wards for chronically ill (%)
People in Group quarters - Hospitals or wards for drug/alcohol abuse (%)
People in Group quarters - Mental (Psychiatric) hospitals or wards (%)
People in Group quarters - Schools, hospitals, or wards for the mentally retarded (%)
People in Group quarters - Schools, hospitals, or wards for the physically handicapped (%)
People in Group quarters - Institutions for the deaf (%)
People in Group quarters - Institutions for the blind (%)
People in Group quarters - Orthopedic wards and institutions for the physically handicapped (%)
People in Group quarters - Wards in general hospitals for patients who have no usual home elsewhere (%)
People in Group quarters - Wards in military hospitals for patients who have no usual home elsewhere (%)
People in Group quarters - Juvenile institutions (%)
People in Group quarters - Long-term care (%)
People in Group quarters - Homes for abused, dependent, and neglected children (%)
People in Group quarters - Residential treatment centers for emotionally disturbed children (%)
People in Group quarters - Training schools for juvenile delinquents (%)
People in Group quarters - Short-term care, detention or diagnostic centers for delinquent children (%)
People in Group quarters - Type of juvenile institution unknown (%)
People in Group quarters - Noninstitutionalized population (%)
People in Group quarters - College dormitories (includes college quarters off campus) (%)
People in Group quarters - Military quarters (%)
People in Group quarters - On base (%)
People in Group quarters - Barracks, unaccompanied personnel housing (UPH), (Enlisted/Officer), ;and similar group living quarters for military personnel (%)
People in Group quarters - Transient quarters for temporary residents (%)
People in Group quarters - Military ships (%)
People in Group quarters - Group homes (%)
People in Group quarters - Homes or halfway houses for drug/alcohol abuse (%)
People in Group quarters - Homes for the mentally ill (%)
People in Group quarters - Homes for the mentally retarded (%)
People in Group quarters - Homes for the physically handicapped (%)
People in Group quarters - Other group homes (%)
People in Group quarters - Religious group quarters (%)
People in Group quarters - Dormitories (%)
People in Group quarters - Agriculture workers' dormitories on farms (%)
People in Group quarters - Job Corps and vocational training facilities (%)
People in Group quarters - Other workers' dormitories (%)
People in Group quarters - Crews of maritime vessels (%)
People in Group quarters - Other nonhousehold living situations (%)
People in Group quarters - Other noninstitutional group quarters (%)
Residents speaking English at home (%)
Residents speaking English at home - Born in the United States (%)
Residents speaking English at home - Native, born elsewhere (%)
Residents speaking English at home - Foreign born (%)
Residents speaking Spanish at home (%)
Residents speaking Spanish at home - Born in the United States (%)
Residents speaking Spanish at home - Native, born elsewhere (%)
Residents speaking Spanish at home - Foreign born (%)
Residents speaking other language at home (%)
Residents speaking other language at home - Born in the United States (%)
Residents speaking other language at home - Native, born elsewhere (%)
Residents speaking other language at home - Foreign born (%)
Class of Workers - Employee of private company (%)
Class of Workers - Self-employed in own incorporated business (%)
Class of Workers - Private not-for-profit wage and salary workers (%)
Class of Workers - Local government workers (%)
Class of Workers - State government workers (%)
Class of Workers - Federal government workers (%)
Class of Workers - Self-employed workers in own not incorporated business and Unpaid family workers (%)
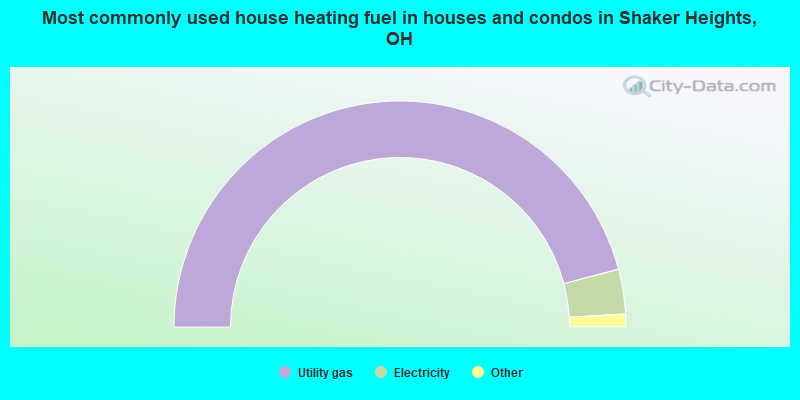
House heating fuel used in houses and condos - Utility gas (%)
House heating fuel used in houses and condos - Bottled, tank, or LP gas (%)
House heating fuel used in houses and condos - Electricity (%)
House heating fuel used in houses and condos - Fuel oil, kerosene, etc. (%)
House heating fuel used in houses and condos - Coal or coke (%)
House heating fuel used in houses and condos - Wood (%)
House heating fuel used in houses and condos - Solar energy (%)
House heating fuel used in houses and condos - Other fuel (%)
House heating fuel used in houses and condos - No fuel used (%)
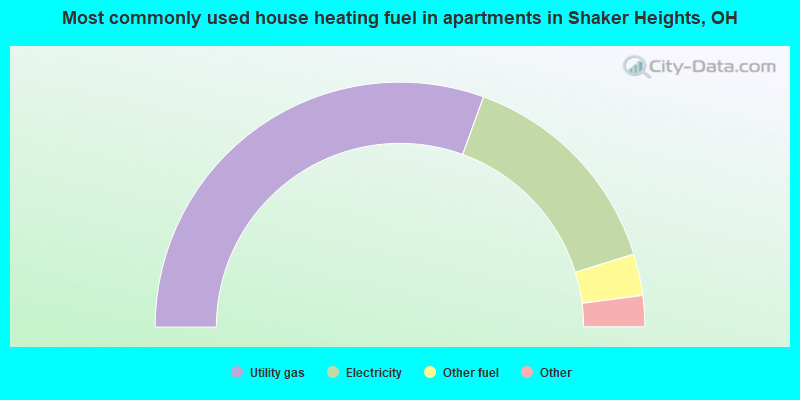
House heating fuel used in apartments - Utility gas (%)
House heating fuel used in apartments - Bottled, tank, or LP gas (%)
House heating fuel used in apartments - Electricity (%)
House heating fuel used in apartments - Fuel oil, kerosene, etc. (%)
House heating fuel used in apartments - Coal or coke (%)
House heating fuel used in apartments - Wood (%)
House heating fuel used in apartments - Solar energy (%)
House heating fuel used in apartments - Other fuel (%)
House heating fuel used in apartments - No fuel used (%)
Armed forces status - In Armed Forces (%)
Armed forces status - Civilian (%)
Armed forces status - Civilian - Veteran (%)
Armed forces status - Civilian - Nonveteran (%)
Fatal accidents locations in years 2005-2021
Fatal accidents locations in 2005
Fatal accidents locations in 2006
Fatal accidents locations in 2007
Fatal accidents locations in 2008
Fatal accidents locations in 2009
Fatal accidents locations in 2010
Fatal accidents locations in 2011
Fatal accidents locations in 2012
Fatal accidents locations in 2013
Fatal accidents locations in 2014
Fatal accidents locations in 2015
Fatal accidents locations in 2016
Fatal accidents locations in 2017
Fatal accidents locations in 2018
Fatal accidents locations in 2019
Fatal accidents locations in 2020
Fatal accidents locations in 2021
Alcohol use - People drinking some alcohol every month (%)
Alcohol use - People not drinking at all (%)
Alcohol use - Average days/month drinking alcohol
Alcohol use - Average drinks/week
Alcohol use - Average days/year people drink much
Audiometry - Average condition of hearing (%)
Audiometry - People that can hear a whisper from across a quiet room (%)
Audiometry - People that can hear normal voice from across a quiet room (%)
Audiometry - Ears ringing, roaring, buzzing (%)
Audiometry - Had a job exposure to loud noise (%)
Audiometry - Had off-work exposure to loud noise (%)
Blood Pressure & Cholesterol - Has high blood pressure (%)
Blood Pressure & Cholesterol - Checking blood pressure at home (%)
Blood Pressure & Cholesterol - Frequently checking blood cholesterol (%)
Blood Pressure & Cholesterol - Has high cholesterol level (%)
Consumer Behavior - Money monthly spent on food at supermarket/grocery store
Consumer Behavior - Money monthly spent on food at other stores
Consumer Behavior - Money monthly spent on eating out
Consumer Behavior - Money monthly spent on carryout/delivered foods
Consumer Behavior - Income spent on food at supermarket/grocery store (%)
Consumer Behavior - Income spent on food at other stores (%)
Consumer Behavior - Income spent on eating out (%)
Consumer Behavior - Income spent on carryout/delivered foods (%)
Current Health Status - General health condition (%)
Current Health Status - Blood donors (%)
Current Health Status - Has blood ever tested for HIV virus (%)
Current Health Status - Left-handed people (%)
Dermatology - People using sunscreen (%)
Diabetes - Diabetics (%)
Diabetes - Had a blood test for high blood sugar (%)
Diabetes - People taking insulin (%)
Diet Behavior & Nutrition - Diet health (%)
Diet Behavior & Nutrition - Milk product consumption (# of products/month)
Diet Behavior & Nutrition - Meals not home prepared (#/week)
Diet Behavior & Nutrition - Meals from fast food or pizza place (#/week)
Diet Behavior & Nutrition - Ready-to-eat foods (#/month)
Diet Behavior & Nutrition - Frozen meals/pizza (#/month)
Drug Use - People that ever used marijuana or hashish (%)
Drug Use - Ever used hard drugs (%)
Drug Use - Ever used any form of cocaine (%)
Drug Use - Ever used heroin (%)
Drug Use - Ever used methamphetamine (%)
Health Insurance - People covered by health insurance (%)
Kidney Conditions-Urology - Avg. # of times urinating at night
Medical Conditions - People with asthma (%)
Medical Conditions - People with anemia (%)
Medical Conditions - People with psoriasis (%)
Medical Conditions - People with overweight (%)
Medical Conditions - Elderly people having difficulties in thinking or remembering (%)
Medical Conditions - People who ever received blood transfusion (%)
Medical Conditions - People having trouble seeing even with glass/contacts (%)
Medical Conditions - People with arthritis (%)
Medical Conditions - People with gout (%)
Medical Conditions - People with congestive heart failure (%)
Medical Conditions - People with coronary heart disease (%)
Medical Conditions - People with angina pectoris (%)
Medical Conditions - People who ever had heart attack (%)
Medical Conditions - People who ever had stroke (%)
Medical Conditions - People with emphysema (%)
Medical Conditions - People with thyroid problem (%)
Medical Conditions - People with chronic bronchitis (%)
Medical Conditions - People with any liver condition (%)
Medical Conditions - People who ever had cancer or malignancy (%)
Mental Health - People who have little interest in doing things (%)
Mental Health - People feeling down, depressed, or hopeless (%)
Mental Health - People who have trouble sleeping or sleeping too much (%)
Mental Health - People feeling tired or having little energy (%)
Mental Health - People with poor appetite or overeating (%)
Mental Health - People feeling bad about themself (%)
Mental Health - People who have trouble concentrating on things (%)
Mental Health - People moving or speaking slowly or too fast (%)
Mental Health - People having thoughts they would be better off dead (%)
Oral Health - Average years since last visit a dentist
Oral Health - People embarrassed because of mouth (%)
Oral Health - People with gum disease (%)
Oral Health - General health of teeth and gums (%)
Oral Health - Average days a week using dental floss/device
Oral Health - Average days a week using mouthwash for dental problem
Oral Health - Average number of teeth
Pesticide Use - Households using pesticides to control insects (%)
Pesticide Use - Households using pesticides to kill weeds (%)
Physical Activity - People doing vigorous-intensity work activities (%)
Physical Activity - People doing moderate-intensity work activities (%)
Physical Activity - People walking or bicycling (%)
Physical Activity - People doing vigorous-intensity recreational activities (%)
Physical Activity - People doing moderate-intensity recreational activities (%)
Physical Activity - Average hours a day doing sedentary activities
Physical Activity - Average hours a day watching TV or videos
Physical Activity - Average hours a day using computer
Physical Functioning - People having limitations keeping them from working (%)
Physical Functioning - People limited in amount of work they can do (%)
Physical Functioning - People that need special equipment to walk (%)
Physical Functioning - People experiencing confusion/memory problems (%)
Physical Functioning - People requiring special healthcare equipment (%)
Prescription Medications - Average number of prescription medicines taking
Preventive Aspirin Use - Adults 40+ taking low-dose aspirin (%)
Reproductive Health - Vaginal deliveries (%)
Reproductive Health - Cesarean deliveries (%)
Reproductive Health - Deliveries resulted in a live birth (%)
Reproductive Health - Pregnancies resulted in a delivery (%)
Reproductive Health - Women breastfeeding newborns (%)
Reproductive Health - Women that had a hysterectomy (%)
Reproductive Health - Women that had both ovaries removed (%)
Reproductive Health - Women that have ever taken birth control pills (%)
Reproductive Health - Women taking birth control pills (%)
Reproductive Health - Women that have ever used Depo-Provera or injectables (%)
Reproductive Health - Women that have ever used female hormones (%)
Sexual Behavior - People 18+ that ever had sex (vaginal, anal, or oral) (%)
Sexual Behavior - Males 18+ that ever had vaginal sex with a woman (%)
Sexual Behavior - Males 18+ that ever performed oral sex on a woman (%)
Sexual Behavior - Males 18+ that ever had anal sex with a woman (%)
Sexual Behavior - Males 18+ that ever had any sex with a man (%)
Sexual Behavior - Females 18+ that ever had vaginal sex with a man (%)
Sexual Behavior - Females 18+ that ever performed oral sex on a man (%)
Sexual Behavior - Females 18+ that ever had anal sex with a man (%)
Sexual Behavior - Females 18+ that ever had any kind of sex with a woman (%)
Sexual Behavior - Average age people first had sex
Sexual Behavior - Average number of female sex partners in lifetime (males 18+)
Sexual Behavior - Average number of female vaginal sex partners in lifetime (males 18+)
Sexual Behavior - Average age people first performed oral sex on a woman (18+)
Sexual Behavior - Average number of woman performed oral sex on in lifetime (18+)
Sexual Behavior - Average number of male sex partners in lifetime (males 18+)
Sexual Behavior - Average number of male anal sex partners in lifetime (males 18+)
Sexual Behavior - Average age people first performed oral sex on a man (18+)
Sexual Behavior - Average number of male oral sex partners in lifetime (18+)
Sexual Behavior - People using protection when performing oral sex (%)
Sexual Behavior - Average number of times people have vaginal or anal sex a year
Sexual Behavior - People having sex without condom (%)
Sexual Behavior - Average number of male sex partners in lifetime (females 18+)
Sexual Behavior - Average number of male vaginal sex partners in lifetime (females 18+)
Sexual Behavior - Average number of female sex partners in lifetime (females 18+)
Sexual Behavior - Circumcised males 18+ (%)
Sleep Disorders - Average hours sleeping at night
Sleep Disorders - People that has trouble sleeping (%)
Smoking-Cigarette Use - People smoking cigarettes (%)
Taste & Smell - People 40+ having problems with smell (%)
Taste & Smell - People 40+ having problems with taste (%)
Taste & Smell - People 40+ that ever had wisdom teeth removed (%)
Taste & Smell - People 40+ that ever had tonsils teeth removed (%)
Taste & Smell - People 40+ that ever had a loss of consciousness because of a head injury (%)
Taste & Smell - People 40+ that ever had a broken nose or other serious injury to face or skull (%)
Taste & Smell - People 40+ that ever had two or more sinus infections (%)
Weight - Average height (inches)
Weight - Average weight (pounds)
Weight - Average BMI
Weight - People that are obese (%)
Weight - People that ever were obese (%)
Weight - People trying to lose weight (%)
According to our research of Ohio and other state lists, there were 19 registered sex offenders living in Shaker Heights, Ohio as of April 27, 2024 . The ratio of all residents to sex offenders in Shaker Heights is 1,451 to 1.The ratio of registered sex offenders to all residents in this city is much lower than the state average.
Officers per 1,000 residents here:
2.43Ohio average:
2.31
Latest news from Shaker Heights, OH collected exclusively by city-data.com from local newspapers, TV, and radio stations
Ancestries: American (4.5%), European (4.3%), German (4.2%), Polish (3.4%), English (3.4%), Irish (2.6%).
Current Local Time:
Land area: 6.28 square miles.
Population density: 4,576 people per square mile (average).
2,455 residents are foreign born (2.9% Asia , 2.1% Europe , 1.7% Latin America , 1.1% Africa ).
Median real estate property taxes paid for housing units with mortgages in 2022: $9,374 (3.0%)Median real estate property taxes paid for housing units with no mortgage in 2022: $8,915 (3.3%)
Nearest city with pop. 50,000+: Cleveland, OH
Nearest city with pop. 1,000,000+: Chicago, IL
Nearest cities:
Latitude: 41.48 N, Longitude: 81.55 W
Daytime population change due to commuting: -5,467 (-19.1%)Workers who live and work in this city: 3,486 (24.2%)
Property values in Shaker Heights, OH
Single-family new house construction building permits:
2022: 5 buildings , average cost: $340,0002021: 6 buildings , average cost: $340,0002020: 1 building , cost: $400,0002018: 2 buildings , average cost: $475,0002015: 2 buildings , average cost: $500,0002007: 2 buildings , average cost: $500,0002005: 34 buildings , average cost: $552,1002004: 13 buildings , average cost: $279,4002003: 13 buildings , average cost: $279,4002002: 13 buildings , average cost: $279,4002001: 17 buildings , average cost: $279,4002000: 1 building , cost: $415,0001999: 2 buildings , average cost: $209,2001998: 15 buildings , average cost: $188,4001997: 4 buildings , average cost: $275,500Unemployment in December 2023:
Most common industries in Shaker Heights, OH (%)
Both Males Females
Health care (17.5%)
Educational services (15.3%)
Professional, scientific, technical services (12.0%)
Finance & insurance (7.3%)
Public administration (3.8%)
Accommodation & food services (2.8%)
Arts, entertainment, recreation (2.8%)
Professional, scientific, technical services (15.7%)
Health care (14.5%)
Educational services (11.0%)
Finance & insurance (7.4%)
Public administration (3.4%)
Metal & metal products (3.3%)
Construction (3.3%)
Health care (20.6%)
Educational services (19.7%)
Professional, scientific, technical services (8.2%)
Finance & insurance (7.1%)
Public administration (4.1%)
Real estate & rental & leasing (3.3%)
Arts, entertainment, recreation (3.2%)
Most common occupations in Shaker Heights, OH (%)
Both Males Females
Other management occupations, except farmers and farm managers (7.0%)
Physicians and surgeons (6.4%)
Lawyers (5.0%)
Other sales and related occupations, including supervisors (4.1%)
Preschool, kindergarten, elementary, and middle school teachers (4.1%)
Postsecondary teachers (3.9%)
Other office and administrative support workers, including supervisors (3.4%)
Other management occupations, except farmers and farm managers (8.7%)
Physicians and surgeons (8.5%)
Lawyers (8.1%)
Top executives (5.3%)
Sales representatives, services, wholesale and manufacturing (4.3%)
Other sales and related occupations, including supervisors (4.0%)
Postsecondary teachers (3.8%)
Preschool, kindergarten, elementary, and middle school teachers (6.1%)
Other office and administrative support workers, including supervisors (5.4%)
Other management occupations, except farmers and farm managers (5.2%)
Physicians and surgeons (4.3%)
Other sales and related occupations, including supervisors (4.1%)
Postsecondary teachers (4.0%)
Registered nurses (3.5%)
Tornado activity:
Shaker Heights-area historical tornado activity is slightly below Ohio state average. It is 7% smaller than the overall U.S. average.
On 5/31/1985, a category F5 (max. wind speeds 261-318 mph) tornado 28.3 miles away from the Shaker Heights city center killed 18 people and injured 310 people and caused between $50,000,000 and $500,000,000 in damages.
On 6/8/1953, a category F4 (max. wind speeds 207-260 mph) tornado 8.9 miles away from the city center killed 17 people and injured 379 people .
Earthquake activity:
Shaker Heights-area historical earthquake activity is significantly above Ohio state average. It is 51% smaller than the overall U.S. average. On 9/25/1998 at 19:52:52, a magnitude 5.2 (4.8 MB, 4.3 MS, 5.2 LG, 4.5 MW, Depth: 3.1 mi, Class: Moderate, Intensity: VI - VII) earthquake occurred 59.9 miles away from Shaker Heights center On 1/31/1986 at 16:46:43, a magnitude 5.0 (5.0 MB) earthquake occurred 22.1 miles away from Shaker Heights center On 8/23/2011 at 17:51:04, a magnitude 5.8 (5.8 MW, Depth: 3.7 mi) earthquake occurred 312.8 miles away from the city center On 6/10/2019 at 14:50:45, a magnitude 4.0 (4.0 MB, Depth: 1.2 mi, Class: Light, Intensity: IV - V) earthquake occurred 14.9 miles away from Shaker Heights center On 7/27/1980 at 18:52:21, a magnitude 5.2 (5.1 MB, 4.7 MS, 5.0 UK, 5.2 UK) earthquake occurred 259.5 miles away from the city center On 12/31/2011 at 20:05:01, a magnitude 4.0 (4.0 ML, Depth: 3.1 mi) earthquake occurred 51.3 miles away from Shaker Heights center Magnitude types: regional Lg-wave magnitude (LG), body-wave magnitude (MB), local magnitude (ML), surface-wave magnitude (MS), moment magnitude (MW) Natural disasters: The number of natural disasters in Cuyahoga County (16) is near the US average (15).Major Disasters (Presidential) Declared: 12Emergencies Declared: 3Storms: 9, Floods: 8, Tornadoes: 7, Winds: 3, Hurricanes: 2, Blizzard: 1, Heavy Rain: 1, Power Outage: 1, Snowstorm: 1, Tropical Storm: 1, Other: 1 (Note: some incidents may be assigned to more than one category). Hospitals and medical centers in Shaker Heights: WARRINGTON HOUSE (3270 WARRINGTON ROAD) SHAKER GARDENS NURSING AND REHAB CTR (3550 NORTHFIELD ROAD)
NEPHROLOGY ASSOCIATES OF CLEVELAND, LTD. (18720 CHAGRIN BLVD)
ALMOST FAMILY MEDLINK (20600 CHAGRIN BLVD, SUITE 290)
DIAMONDS AND PEARLS HEALTH SERVICES LLC (3570 WARRENSVILLE CENTER ROAD, SUITE 104)
ESSENTIAL HEALTHCARE SERVICES, INC (3691 LEE ROAD, SUITE 106)
Amtrak station near Shaker Heights: 8 miles: CLEVELAND (200 CLEVELAND MEMORIAL SHOREWAY) Services: ticket office, partially wheelchair accessible, enclosed waiting area, public restrooms, public payphones, vending machines, free short-term parking, paid long-term parking, taxi stand, public transit connection.
Colleges/universities with over 2000 students nearest to Shaker Heights:
John Carroll University (about 2 miles; University Heights, OH ; Full-time enrollment: 3,546)
Case Western Reserve University (about 4 miles; Cleveland, OH ; FT enrollment: 7,034)
Cuyahoga Community College District (about 7 miles; Cleveland, OH ; FT enrollment: 20,271)
Cleveland State University (about 7 miles; Cleveland, OH ; FT enrollment: 14,161)
Lakeland Community College (about 15 miles; Kirtland, OH ; FT enrollment: 6,170)
Baldwin Wallace University (about 17 miles; Berea, OH ; FT enrollment: 3,699)
Kent State University at Kent (about 26 miles; Kent, OH ; FT enrollment: 25,431)
Public high school in Shaker Heights:
Private high schools in Shaker Heights: HATHAWAY BROWN SCHOOL Students: 825, Location: 19600 N PARK BLVD, Grades: PK-12, Girls only )
LAUREL SCHOOL Students: 650, Location: 1 LYMAN CIR, Grades: PK-12, Girls only )
Public elementary/middle schools in Shaker Heights: WOODBURY ELEMENTARY SCHOOL Students: 832, Location: 15400 S WOODLAND RD, Grades: 5-7)SHAKER HTS MIDDLE SCHOOL Students: 820, Location: 20600 SHAKER BLVD, Grades: 7-8)LOMOND ELEMENTARY SCHOOL Students: 505, Location: 17917 LOMOND BLVD, Grades: KG-4)MERCER ELEMENTARY SCHOOL Students: 419, Location: 23325 WIMBLEDON RD, Grades: PK-4)ONAWAY ELEMENTARY SCHOOL Students: 387, Location: 3115 WOODBURY RD, Grades: PK-4)FERNWAY ELEMENTARY SCHOOL Students: 357, Location: 17420 FERNWAY RD, Grades: KG-4)BOULEVARD ELEMENTARY SCHOOL Students: 356, Location: 14900 DREXMORE RD, Grades: KG-4)Private elementary/middle school in Shaker Heights: ST DOMINIC SCHOOL Students: 174, Location: 3455 NORWOOD RD, Grades: KG-8)
See full list of schools located in Shaker Heights Library in Shaker Heights: SHAKER HEIGHTS PUBLIC LIBRARY Operating income: $5,260,494; Location: 16500 VAN AKEN BOULEVARD; 215,885 books ; 18,801 e-books ; 36,734 audio materials ; 29,864 video materials ; 1 local licensed databases ; 266 state licensed databases ; 40 other licensed databases ; 632 print serial subscriptions )
Notable locations in Shaker Heights: (A) , Shaker Heights Country Club (B) , Shaker Heights Fire Department Station 1 (C) , Shaker Heights Fire Department Station 2 (D) , Shaker Heights Public Library (E) , Shaker Heights City Hall (F) . Display/hide their locations on the map
Shopping Centers: (1) , Fairmount Circle Shopping Center (2) , Van Aken Shopping Center (3) . Display/hide their locations on the map
Churches in Shaker Heights include: (A) , Saint Dominics Catholic Church (B) , Plymouth Church (C) . Display/hide their locations on the map
Cemetery: (1) . Display/hide its location on the map
Reservoirs: (A) , Green Lake (B) , Lower Shaker Lake (C) , Upper Shaker Lake (D) . Display/hide their locations on the map
Parks in Shaker Heights include: (1) , Shaker Village Historic District (2) . Display/hide their locations on the map
Birthplace of: David Pogue - Technology writer, Fred Willard - Actor, Paul Newman - (born 1925), actor, Bill Taft - Male singer, Jamie Babbit - Director, Ralph Kohl - Football player and coach, Roger Penske - Businessman, Adrien Clarke - 2005 NFL player (Philadelphia Eagles, born : Mar 26, 1981), Ben Simon - NHL player (Columbus Blue Jackets, born : Jun 14, 1978), David Kelley - Philosopher.
Cuyahoga County has a predicted average indoor radon screening level between 2 and 4 pCi/L (pico curies per liter) - Moderate Potential Drinking water stations with addresses in Shaker Heights that have no violations reported:
UNIVERSITY HEALTH CENTER AT CHESTER PWS (Population served: 80, Primary Water Source Type: Groundwater)
Average household size: This city:
2.4 peopleOhio:
2.4 people
Percentage of family households: This city:
65.2%Whole state:
65.0%
Percentage of households with unmarried partners: This city:
3.4%Whole state:
6.8%
Likely homosexual households (counted as self-reported same-sex unmarried-partner households)
Lesbian couples: 0.3% of all households Gay men: 0.3% of all households
People in group quarters in Shaker Heights in 2010:
70 people in group homes for juveniles (non-correctional)
44 people in nursing facilities/skilled-nursing facilities
22 people in group homes intended for adults
8 people in residential treatment centers for adults
7 people in other noninstitutional facilities
5 people in local jails and other municipal confinement facilities
People in group quarters in Shaker Heights in 2000:
93 people in nursing homes
30 people in residential treatment centers for emotionally disturbed children
30 people in homes for the mentally ill
23 people in homes for the mentally retarded
12 people in religious group quarters
10 people in local jails and other confinement facilities (including police lockups)
Banks with branches in Shaker Heights (2011 data):
The Huntington National Bank: Shaker Hts Branch at 17121 Chagrin Blvd, branch established on 1993/01/01; Fairmont-Circle Branch at 20601 Fairmont Boulevard, branch established on 1962/02/05. Info updated 2012/04/02: Bank assets: $54,183.4 mil, Deposits: $44,300.3 mil, headquarters in Columbus, OH, positive income , Commercial Lending Specialization, 878 total offices , Holding Company: Huntington Bancshares Incorporated
PNC Bank, National Association: Chagrin-Warrensville Branch at 20711 Chagrin Boulevard, branch established on 1969/12/22; Shaker Towne Centre Branch at 16601 Chagrin Boulevard, branch established on 1964/11/12. Info updated 2012/03/20: Bank assets: $263,309.6 mil, Deposits: $197,343.0 mil, headquarters in Wilmington, DE, positive income , Commercial Lending Specialization, 3085 total offices , Holding Company: Pnc Financial Services Group, Inc., The
Citizens Bank: Shaker Heights Branch at 3505 Lee Road, branch established on 1951/10/08. Info updated 2011/08/01: Bank assets: $9,212.3 mil, Deposits: $7,452.0 mil, headquarters in Flint, MI, positive income , Commercial Lending Specialization, 220 total offices , Holding Company: Citizens Republic Bancorp, Inc.
New York Community Bank: 20133 Farnsleigh Road Branch at 20133 Farnsleigh Road, branch established on 1921/01/01. Info updated 2010/03/29: Bank assets: $39,468.7 mil, Deposits: $20,709.8 mil, headquarters in Westbury, NY, positive income , Commercial Lending Specialization, 247 total offices , Holding Company: New York Community Bancorp, Inc.
KeyBank National Association: Warrensville-Farnsleigh Branch at 3370 Warrensville Center Road, branch established on 1957/11/11. Info updated 2008/03/03: Bank assets: $86,198.8 mil, Deposits: $64,214.8 mil, headquarters in Cleveland, OH, positive income , Commercial Lending Specialization, 1067 total offices , Holding Company: Keycorp
RBS Citizens, National Association: Van Aken Shopping Center Branch at 20195 Van Aken Boulevard, branch established on 2004/04/19. Info updated 2007/09/19: Bank assets: $106,940.6 mil, Deposits: $75,690.2 mil, headquarters in Providence, RI, positive income , 1135 total offices , Holding Company: Uk Financial Investments Limited
For population 15 years and over in Shaker Heights:
Never married: 32.5%Now married: 49.2%Separated: 1.0%Widowed: 5.7%Divorced: 11.5% For population 25 years and over in Shaker Heights:
High school or higher: 97.4%Bachelor's degree or higher: 70.1%Graduate or professional degree: 42.1%Unemployed: 3.6%Mean travel time to work (commute): 18.0 minutes
Education Gini index (Inequality in education) Here:
9.7Ohio average:
11.0
Religion statistics for Shaker Heights, OH (based on Cuyahoga County data)
Religion Adherents Congregations Catholic 366,464 110 Evangelical Protestant 106,477 326 Mainline Protestant 94,977 233 Other 49,641 126 Black Protestant 40,776 129 Orthodox 16,456 31 None 605,331 -
Source: Clifford Grammich, Kirk Hadaway, Richard Houseal, Dale E.Jones, Alexei Krindatch, Richie Stanley and Richard H.Taylor. 2012. 2010 U.S.Religion Census: Religious Congregations & Membership Study. Association of Statisticians of American Religious Bodies. Jones, Dale E., et al. 2002. Congregations and Membership in the United States 2000. Nashville, TN: Glenmary Research Center. Graphs represent county-level data
Food Environment Statistics: Number of grocery stores : 302This county :
2.33 / 10,000 pop.State :
1.89 / 10,000 pop.
Number of supercenters and club stores : 6Here :
0.05 / 10,000 pop.Ohio :
0.13 / 10,000 pop.
Number of convenience stores (no gas) : 218Cuyahoga County :
1.68 / 10,000 pop.State :
1.25 / 10,000 pop.
Number of convenience stores (with gas) : 293Here :
2.26 / 10,000 pop.Ohio :
2.93 / 10,000 pop.
Number of full-service restaurants : 891Cuyahoga County :
6.88 / 10,000 pop.Ohio :
6.25 / 10,000 pop.
Adult diabetes rate : Cuyahoga County :
10.8%Ohio :
10.3%
Adult obesity rate : Cuyahoga County :
28.3%Ohio :
29.1%
Low-income preschool obesity rate : Health and Nutrition:
Average overall health of teeth and gums : This city:
55.8%Ohio:
47.8%
People feeling badly about themselves : People not drinking alcohol at all : This city:
10.0%State:
10.4%
Average hours sleeping at night : General health condition : This city:
61.2%State:
57.0%
Average condition of hearing : Shaker Heights:
82.4%Ohio:
79.1%
More about Health and Nutrition of Shaker Heights, OH Residents
Local government employment and payroll (March 2022)
Function
Full-time employees
Monthly full-time payroll
Average yearly full-time wage
Part-time employees
Monthly part-time payroll
Police Protection - Officers
65 $525,826 $97,076 0 $0 Firefighters
54 $426,938 $94,875 0 $0 Judicial and Legal
30 $171,382 $68,553 9 $26,504 Other Government Administration
30 $217,868 $87,147 2 $1,970 Other and Unallocable
29 $171,547 $70,985 11 $32,223 Streets and Highways
22 $49,628 $27,070 0 $0 Parks and Recreation
22 $108,308 $59,077 49 $28,348 Solid Waste Management
16 $81,932 $61,449 0 $0 Police - Other
13 $68,998 $63,690 19 $20,967 Financial Administration
7 $46,676 $80,016 0 $0 Natural Resources
6 $31,633 $63,266 0 $0 Sewerage
5 $13,622 $32,693 0 $0 Welfare
4 $27,671 $83,013 1 $681 Housing and Community Development (Local)
3 $15,946 $63,784 0 $0 Fire - Other
1 $5,366 $64,392 1 $4,121 Correction
1 $5,046 $60,552 1 $2,411
Totals for Government
308 $1,968,386 $76,690 93 $117,225
Shaker Heights government finances - Expenditure in 2021 (per resident):
Construction - Regular Highways: $2,966,000 ($103.26)
Central Staff Services: $2,585,000 ($90.00)General Public Buildings: $2,160,000 ($75.20)Parks and Recreation: $538,000 ($18.73)Housing and Community Development: $405,000 ($14.10)Sewerage: $64,000 ($2.23)Police Protection: $29,000 ($1.01)Current Operations - General Public Buildings: $12,728,000 ($443.13)
Police Protection: $9,821,000 ($341.92)Local Fire Protection: $7,016,000 ($244.26)Parks and Recreation: $5,346,000 ($186.12)General - Other: $4,457,000 ($155.17)Central Staff Services: $4,040,000 ($140.65)Regular Highways: $3,135,000 ($109.15)Solid Waste Management: $2,994,000 ($104.24)Housing and Community Development: $2,988,000 ($104.03)Judicial and Legal Services: $2,793,000 ($97.24)Protective Inspection and Regulation - Other: $1,787,000 ($62.21)Sewerage: $1,542,000 ($53.69)Financial Administration: $779,000 ($27.12)Correctional Institutions: $297,000 ($10.34)Health - Other: $84,000 ($2.92)General - Interest on Debt: $749,000 ($26.08)
Intergovernmental to State - General - Other: $2,260,000 ($78.68)
Other Capital Outlay - Local Fire Protection: $581,000 ($20.23)
Solid Waste Management: $325,000 ($11.31)Police Protection: $324,000 ($11.28)Regular Highways: $280,000 ($9.75)Central Staff Services: $159,000 ($5.54)Parks and Recreation: $40,000 ($1.39)General - Other: $37,000 ($1.29)Correctional Institutions: $31,000 ($1.08)General Public Building: $7,000 ($0.24)Total Salaries and Wages: $25,938,000 ($903.04)
Shaker Heights government finances - Revenue in 2021 (per resident):
Charges - Other: $1,863,000 ($64.86)
Parks and Recreation: $1,728,000 ($60.16)Regular Highways: $1,302,000 ($45.33)Sewerage: $1,002,000 ($34.88)Solid Waste Management: $2,000 ($0.07)Federal Intergovernmental - Housing and Community Development: $913,000 ($31.79)
Other: $168,000 ($5.85)Local Intergovernmental - Highways: $1,214,000 ($42.27)
Other: $950,000 ($33.07)Housing and Community Development: $143,000 ($4.98)Miscellaneous - General Revenue - Other: $6,852,000 ($238.55)
Fines and Forfeits: $3,174,000 ($110.50)Interest Earnings: $966,000 ($33.63)Special Assessments: $230,000 ($8.01)Donations From Private Sources: $142,000 ($4.94)Sale of Property: $49,000 ($1.71)Rents: $42,000 ($1.46)Royalties: $3,000 ($0.10)State Intergovernmental - General Local Government Support: $1,821,000 ($63.40)
Highways: $1,043,000 ($36.31)Other: $36,000 ($1.25)Tax - Individual Income: $34,395,000 ($1197.47)
Property: $8,999,000 ($313.30)Other License: $1,275,000 ($44.39)Corporation Net Income: $647,000 ($22.53)Other Selective Sales: $46,000 ($1.60)Other: $9,000 ($0.31)
Shaker Heights government finances - Debt in 2021 (per resident):
Long Term Debt - Beginning Outstanding - Unspecified Public Purpose: $14,829,000 ($516.28)
Outstanding Unspecified Public Purpose: $13,552,000 ($471.82)Retired Unspecified Public Purpose: $1,277,000 ($44.46)
Shaker Heights government finances - Cash and Securities in 2021 (per resident):
Other Funds - Cash and Securities: $56,218,000 ($1957.25)
4.02% of this county's 2021 resident taxpayers lived in other counties in 2020 ($66,006 average adjusted gross income )
Here:
4.02%Ohio average:
5.68%
0.02% of residents moved from foreign countries ($135 average AGI )Cuyahoga County:
0.02%Ohio average:
0.01%
Top counties from which taxpayers relocated into this county between 2020 and 2021:
5.02% of this county's 2020 resident taxpayers moved to other counties in 2021 ($88,842 average adjusted gross income )
Here:
5.02%Ohio average:
5.79%
0.01% of residents moved to foreign countries ($120 average AGI )Cuyahoga County:
0.01%Ohio average:
0.01%
Top counties to which taxpayers relocated from this county between 2020 and 2021:
Businesses in Shaker Heights, OH
Name Count Name Count
Advance Auto Parts 1 Papa John's Pizza 1 Blockbuster 1 Pizza Hut 1 CVS 2 Qdoba Mexican Grill 1 Curves 1 RadioShack 1 Firestone Complete Auto Care 1 Rite Aid 1 GNC 1 Starbucks 1 GameStop 1 T-Mobile 1 H&R Block 1 UPS 1 JoS. A. Bank 1 Walgreens 2 Panera Bread 1
Strongest AM radio stations in Shaker Heights:
WKNR (850 AM; 50 kW; CLEVELAND, OH; Owner: CARON BROADCASTING, INC.)
WTAM (1100 AM; 50 kW; CLEVELAND, OH; Owner: JACOR BROADCASTING CORPORATION)
WHK (1220 AM; 50 kW; CLEVELAND, OH; Owner: CARON BROADCASTING, INC.)
WJMO (1490 AM; 1 kW; CLEVELAND HEIGHTS, OH; Owner: BLUE CHIP BROADCASTING LICENSES, LTD.)
WWMK (1260 AM; 10 kW; CLEVELAND, OH; Owner: ABC, INC.)
WRMR (1420 AM; 5 kW; CLEVELAND, OH; Owner: CLEVELAND CLASSICAL RADIO, LLC)
WABQ (1540 AM; daytime; 1 kW; CLEVELAND, OH; Owner: WABQ, INC.)
WERE (1300 AM; 5 kW; CLEVELAND, OH)
WCUE (1150 AM; 5 kW; CUYAHOGA FALLS, OH; Owner: FAMILY STATIONS, INC.)
WHLO (640 AM; 5 kW; AKRON, OH; Owner: CLEAR CHANNEL BROADCASTING LICENSES, INC.)
WTOU (1350 AM; 5 kW; AKRON, OH)
WJTB (1040 AM; daytime; 5 kW; NORTH RIDGEVILLE, OH; Owner: TAYLOR BROADCASTING CO)
WJR (760 AM; 50 kW; DETROIT, MI; Owner: ABC, INC.)
Strongest FM radio stations in Shaker Heights:
WJCU (88.7 FM; UNIVERSITY HEIGHTS, OH; Owner: JOHN CARROLL UNIVERSITY)
WFHM-FM (95.5 FM; CLEVELAND, OH; Owner: SCA LICENSE CORPORATION)
WXTM (92.3 FM; CLEVELAND HEIGHTS, OH; Owner: INFINITY RADIO OPERATIONS INC.)
WRUW-FM (91.1 FM; CLEVELAND, OH; Owner: CASE WESTERN RESERVE UNIVERSITY)
WMJI (105.7 FM; CLEVELAND, OH; Owner: CITICASTERS LICENSES, L.P.)
WDOK (102.1 FM; CLEVELAND, OH; Owner: INFINITY RADIO OPERATIONS INC.)
WQAL (104.1 FM; CLEVELAND, OH; Owner: INFINITY RADIO OPERATIONS INC.)
WMVX (106.5 FM; CLEVELAND, OH; Owner: JACOR BROADCASTING CORPORATION)
WNCX (98.5 FM; CLEVELAND, OH; Owner: INFINITY RADIO OF CLEVELAND INC.)
WMMS (100.7 FM; CLEVELAND, OH; Owner: CITICASTERS LICENSES, L.P.)
WENZ (107.9 FM; CLEVELAND, OH; Owner: RADIO ONE LICENSES, LLC)
WCPN (90.3 FM; CLEVELAND, OH; Owner: IDEASTREAM)
WCRF-FM (103.3 FM; CLEVELAND, OH; Owner: THE MOODY BIBLE INSTITUTE OF CHICAGO)
WGAR-FM (99.5 FM; CLEVELAND, OH; Owner: CITICASTERS LICENSES, L.P.)
WZAK (93.1 FM; CLEVELAND, OH; Owner: RADIO ONE LICENSES, LLC)
WCSB (89.3 FM; CLEVELAND, OH; Owner: CLEVELAND STATE UNIVERSITY)
WKHR (91.5 FM; BAINBRIDGE, OH; Owner: KENSTON LOCAL SCHOOL DISTRICT)
WAKS (96.5 FM; AKRON, OH; Owner: CAPSTAR TX LIMITED PARTNERSHIP)
WKSU-FM (89.7 FM; KENT, OH; Owner: KENT STATE UNIVERSITY)
WQMX (94.9 FM; MEDINA, OH; Owner: RUBBER CITY RADIO GROUP, INC)
TV broadcast stations around Shaker Heights:
WKYC-TV (Channel 3; CLEVELAND, OH; Owner: WKYC-TV, INC.)
WRAP-CA (Channel 32; CLEVELAND, OH; Owner: COMMERCIAL BROADCASTING CORP.)
WOIO (Channel 19; SHAKER HEIGHTS, OH; Owner: RAYCOM NATIONAL, INC.)
WBNX-TV (Channel 55; AKRON, OH; Owner: WINSTON BROADCASTING NETWORK, INC.)
W35AX (Channel 35; CLEVELAND, OH; Owner: MEDIA-COM TELEVISION, INC.)
WQHS-TV (Channel 61; CLEVELAND, OH; Owner: UNIVISION CLEVELAND LLC)
WEWS-TV (Channel 5; CLEVELAND, OH; Owner: SCRIPPS HOWARD BROADCASTING COMPANY)
WUAB (Channel 43; LORAIN, OH; Owner: RAYCOM NATIONAL, INC.)
WJW (Channel 8; CLEVELAND, OH; Owner: WJW LICENSE, INC.)
WVIZ (Channel 25; CLEVELAND, OH; Owner: IDEASTREAM)
WXOX-LP (Channel 65; CLEVELAND, OH; Owner: VENTURE TECHNOLOGIES GROUP, LLC)
W53AX (Channel 53; CLEVELAND, OH; Owner: WORD OF GOD FELLOWSHIP, INC.)
W51BI (Channel 51; KIRTLAND, OH; Owner: TRINITY BROADCASTING NETWORK)
WEAO (Channel 49; AKRON, OH; Owner: NORTHEASTERN EDUCATIONAL TELEVISION OF OHIO, INC.)
WVPX (Channel 23; AKRON, OH; Owner: PAXSON AKRON LICENSE, INC.)
WAKN-LP (Channel 11; AKRON, OH; Owner: AKRON TELEVISION, INC.)
WOAC (Channel 67; CANTON, OH; Owner: WRAY, INC.)
WAOH-LP (Channel 29; AKRON, OH; Owner: MEDIA-COM TELEVISION, INC.)
National Bridge Inventory (NBI) Statistics 10 Number of bridges49ft / 15.2m Total length $110,000 Total costs119,697 Total average daily traffic7,452 Total average daily truck traffic166,138 Total future (year 2035) average daily traffic
New bridges - historical statistics
1 1940-1949 1 1960-1969 5 1980-1989 3 1990-1999
See full National Bridge Inventory statistics for Shaker Heights, OH
FCC Registered Antenna Towers: 9 (
See the full list of FCC Registered Antenna Towers in Shaker Heights )
FCC Registered Broadcast Land Mobile Towers: 10 (
See the full list of FCC Registered Broadcast Land Mobile Towers in Shaker Heights, OH )
FCC Registered Microwave Towers: 5
CLE0013590, 20600 Chagrin Blvd (Lat: 41.463806 Lon: -81.534167), Type: Pole, Structure height: 51.8 m, Call Sign: WPRT526, Licensee ID: L00163444, Assigned Frequencies: 17840.0 MHz, Grant Date: 01/23/2001, Expiration Date: 01/23/2011, Cancellation Date: 05/28/2002, Certifier: Terri B Natoli, Registrant: Katlink LLC (Debtor-In-Possession) OH-CLE0342A, 15911 Aldersyde Drive (Lat: 41.473556 Lon: -81.569194), Type: Stack, Structure height: 15.2 m, Overall height: 19 m, Call Sign: WQNA795, Assigned Frequencies: 23225.0 MHz, Grant Date: 03/08/2021, Expiration Date: 11/26/2030, Cancellation Date: 09/15/2021, Certifier: Nadja S Sodos-Wallace, Registrant: T-Mobile Usa, Inc., 12920 Se 38th Street, Bellevue, WA 98006, Phone: (425) 383-8402, Fax: (425) 383-4840, Email:
OH-CLE0369A, 3752 Lee Road (Lat: 41.457444 Lon: -81.565278), Type: Bant, Structure height: 16.7 m, Overall height: 20 m, Call Sign: WQNA797, Assigned Frequencies: 17915.0 MHz, Grant Date: 03/08/2021, Expiration Date: 11/26/2030, Cancellation Date: 09/15/2021, Certifier: Nadja S Sodos-Wallace, Registrant: T-Mobile Usa, Inc., 12920 Se 38th Street, Bellevue, WA 98006, Phone: (425) 383-8402, Fax: (425) 383-4840, Email:
OH-CLE192A, 20600 Chagrin Blvd (Lat: 41.463194 Lon: -81.533694), Type: Bant, Structure height: 50.6 m, Overall height: 53.6 m, Call Sign: WQNA802, Assigned Frequencies: 19575.0 MHz, 19675.0 MHz, Grant Date: 03/08/2021, Expiration Date: 11/26/2030, Cancellation Date: 04/05/2022, Certifier: Nadja S Sodos-Wallace, Registrant: T-Mobile Usa, Inc., 12920 Se 38th Street, Bellevue, WA 98006, Phone: (425) 383-8401, Fax: (425) 383-4840, Email:
CLE26C, 20600 Chagrin Blvd (Lat: 41.463917 Lon: -81.534333), Type: Mast, Structure height: 54 m, Overall height: 57 m, Call Sign: WQYD997, Assigned Frequencies: 10735.0 MHz, 10735.0 MHz, 10735.0 MHz, 10735.0 MHz, 10815.0 MHz, 10815.0 MHz, 10815.0 MHz, 10815.0 MHz, Grant Date: 08/29/2016, Expiration Date: 08/29/2026, Certifier: Christopher W Craven, Registrant: Bob, LLC Dba Business Only Broadband, 999 Oak Creek Dr., Lombard, IL 60148, Phone: (630) 590-6006, Email:
FCC Registered Amateur Radio Licenses: 77 (
See the full list of FCC Registered Amateur Radio Licenses in Shaker Heights )
FAA Registered Aircraft: 7
Aircraft: BELL 47G-2 (Category: Land, Seats: 3, Weight: Up to 12,499 Pounds, Speed: 78 mph), Engine: LYCOMING VO-435 SERIES (260 HP) (Reciprocating)N-Number: 2292B, N2292B, N-2292B, Serial Number: 1972, Year manufactured: 1957, Airworthiness Date: 05/07/1984, Certificate Issue Date: 10/23/1995Registrant (Individual): Franklin B Jr Floyd, 2723 Dryden Rd, Shaker Heights, OH 44122Aircraft: AIR CREATION GTE 912 (Category: Land, Seats: 2, Weight: Up to 12,499 Pounds), Engine: ROTAX 912 (80 HP) (4 Cycle)N-Number: 3656, N3656, N-3656, Serial Number: T02044, Year manufactured: 2002, Airworthiness Date: 11/15/2007, Certificate Issue Date: 09/29/2014Registrant (Individual): Luis F Amunategui, 3122 Huntington Rd, Shaker Heights, OH 44120Aircraft: CESSNA TR182 (Category: Land, Seats: 4, Weight: Up to 12,499 Pounds), Engine: LYCOMING 0-540 SERIES (250 HP) (Reciprocating)N-Number: 756RN, N756RN, N-756RN, Serial Number: R18201137, Year manufactured: 1979, Airworthiness Date: 06/08/1979, Certificate Issue Date: 06/09/1994Registrant (Individual): Heber Macwilliams, 20676 Fairmount Blvd Apt 303, Shaker Heights, OH 44118Aircraft: CRONIG MITCHELL MC-1 COMET (Category: Land, Seats: 2, Weight: Up to 12,499 Pounds), Engine: ReciprocatingN-Number: 81694, N81694, N-81694, Serial Number: 001, Certificate Issue Date: 04/21/1998Registrant (Individual): Mitchell S Cronig, 20120 Scottsdale Blvd, Shaker Heights, OH 44122Deregistered: Cancel Date: 11/29/1977, Exported to: South AfricaAircraft: ENGINEERING & RESEARCH ERCOUPE 415-C (Category: Land, Seats: 2, Weight: Up to 12,499 Pounds, Speed: 90 mph), Engine: CONT MOTOR A&C75 SERIES (75 HP) (Reciprocating)N-Number: 94139, N94139, N-94139, Serial Number: 1462, Year manufactured: 1946, Airworthiness Date: 09/14/1954, Certificate Issue Date: 10/21/2016Registrant (Individual): Donald J Jr Fix, 2916 Litchfield Rd, Shaker Heights, OH 44120Aircraft: JODEL D-11 (Category: Land, Seats: 2, Weight: Up to 12,499 Pounds, Speed: 112 mph), Engine: CONT MOTOR 0-200 SERIES (100 HP) (Reciprocating)N-Number: 94287, N94287, N-94287, Serial Number: TC-1, Airworthiness Date: 04/29/1980, Certificate Issue Date: 08/01/2017Registrant (Individual): Thomas D Callahan, 2869 Huntington Rd, Shaker Heights, OH 44120Aircraft: PIPER PA-28-180 (Category: Land, Seats: 4, Weight: Up to 12,499 Pounds, Speed: 107 mph), Engine: LYCOMING O&VO-360 SER (180 HP) (Reciprocating)N-Number: 8317W, N8317W, N-8317W, Serial Number: 28-2490, Year manufactured: 1965Registrant (Individual): Fred Gold, 3703 Hildana, Shaker Heights, OH 00000Deregistered: Cancel Date: 05/16/2019
Home Mortgage Disclosure Act Aggregated Statistics For Year 2009(Based on 11 full tracts) A) FHA, FSA/RHS & VA B) Conventional C) Refinancings D) Home Improvement Loans E) Loans on Dwellings For 5+ Families F) Non-occupant Loans on G) Loans On Manufactured Number Average Value Number Average Value Number Average Value Number Average Value Number Average Value Number Average Value Number Average Value
LOANS ORIGINATED 85 $146,271 193 $214,896 487 $227,170 46 $36,543 4 $655,500 23 $96,348 0 $0 APPLICATIONS APPROVED, NOT ACCEPTED 3 $112,333 11 $233,545 64 $226,547 14 $26,214 0 $0 6 $62,500 1 $5,000 APPLICATIONS DENIED 16 $147,125 20 $253,050 168 $197,744 51 $22,000 0 $0 22 $88,227 0 $0 APPLICATIONS WITHDRAWN 16 $149,188 25 $189,800 91 $227,571 2 $75,000 0 $0 7 $101,571 0 $0 FILES CLOSED FOR INCOMPLETENESS 2 $85,000 4 $266,500 38 $197,921 1 $25,000 0 $0 5 $81,000 0 $0
Aggregated Statistics For Year 2008(Based on 11 full tracts) A) FHA, FSA/RHS & VA B) Conventional C) Refinancings D) Home Improvement Loans E) Loans on Dwellings For 5+ Families F) Non-occupant Loans on G) Loans On Manufactured Number Average Value Number Average Value Number Average Value Number Average Value Number Average Value Number Average Value Number Average Value
LOANS ORIGINATED 75 $150,760 262 $220,229 257 $205,611 77 $30,039 1 $71,000 58 $115,724 0 $0 APPLICATIONS APPROVED, NOT ACCEPTED 6 $133,000 26 $170,808 59 $174,220 9 $21,778 0 $0 9 $104,000 0 $0 APPLICATIONS DENIED 22 $129,636 31 $209,677 189 $172,148 100 $39,720 1 $71,000 35 $87,029 2 $35,000 APPLICATIONS WITHDRAWN 13 $152,769 21 $155,571 72 $206,972 2 $15,500 0 $0 8 $59,875 0 $0 FILES CLOSED FOR INCOMPLETENESS 0 $0 7 $277,143 19 $201,947 6 $28,000 0 $0 4 $110,750 0 $0
Aggregated Statistics For Year 2007(Based on 11 full tracts) A) FHA, FSA/RHS & VA B) Conventional C) Refinancings D) Home Improvement Loans E) Loans on Dwellings For 5+ Families F) Non-occupant Loans on G) Loans On Manufactured Number Average Value Number Average Value Number Average Value Number Average Value Number Average Value Number Average Value Number Average Value
LOANS ORIGINATED 27 $121,407 420 $201,021 305 $198,243 115 $55,991 4 $579,750 80 $143,250 0 $0 APPLICATIONS APPROVED, NOT ACCEPTED 3 $140,000 51 $190,686 84 $181,571 33 $42,000 0 $0 19 $142,842 0 $0 APPLICATIONS DENIED 2 $138,000 137 $151,000 314 $186,102 114 $48,868 1 $2,400,000 86 $119,930 2 $146,000 APPLICATIONS WITHDRAWN 2 $130,000 40 $216,900 89 $182,517 7 $30,143 1 $2,400,000 12 $133,167 0 $0 FILES CLOSED FOR INCOMPLETENESS 0 $0 15 $255,533 39 $198,590 2 $135,000 0 $0 9 $148,889 0 $0
Aggregated Statistics For Year 2006(Based on 11 full tracts) A) FHA, FSA/RHS & VA B) Conventional C) Refinancings D) Home Improvement Loans E) Loans on Dwellings For 5+ Families F) Non-occupant Loans on G) Loans On Manufactured Number Average Value Number Average Value Number Average Value Number Average Value Number Average Value Number Average Value Number Average Value
LOANS ORIGINATED 23 $156,826 543 $190,794 406 $178,751 101 $75,475 11 $2,083,727 119 $140,580 1 $30,000 APPLICATIONS APPROVED, NOT ACCEPTED 1 $217,000 104 $135,375 102 $163,294 21 $59,000 0 $0 39 $120,974 0 $0 APPLICATIONS DENIED 5 $129,800 213 $144,169 398 $173,796 98 $52,653 3 $1,513,333 92 $141,076 0 $0 APPLICATIONS WITHDRAWN 3 $178,000 99 $143,222 126 $209,016 9 $80,444 1 $320,000 42 $133,286 2 $146,500 FILES CLOSED FOR INCOMPLETENESS 0 $0 28 $120,857 37 $168,946 1 $50,000 0 $0 6 $147,333 0 $0
Aggregated Statistics For Year 2005(Based on 11 full tracts) A) FHA, FSA/RHS & VA B) Conventional C) Refinancings D) Home Improvement Loans E) Loans on Dwellings For 5+ Families F) Non-occupant Loans on G) Loans On Manufactured Number Average Value Number Average Value Number Average Value Number Average Value Number Average Value Number Average Value Number Average Value
LOANS ORIGINATED 21 $148,048 596 $205,042 579 $181,587 134 $65,164 2 $481,000 129 $154,636 1 $18,000 APPLICATIONS APPROVED, NOT ACCEPTED 0 $0 100 $154,830 116 $144,155 23 $83,565 0 $0 28 $109,750 0 $0 APPLICATIONS DENIED 6 $161,000 162 $155,358 437 $168,817 106 $51,802 0 $0 83 $127,265 1 $11,000 APPLICATIONS WITHDRAWN 0 $0 85 $175,024 226 $185,951 26 $170,615 1 $2,950,000 31 $136,355 1 $145,000 FILES CLOSED FOR INCOMPLETENESS 0 $0 20 $133,300 45 $173,600 1 $880,000 1 $1,700,000 5 $160,600 0 $0
Aggregated Statistics For Year 2004(Based on 11 full tracts) A) FHA, FSA/RHS & VA B) Conventional C) Refinancings D) Home Improvement Loans E) Loans on Dwellings For 5+ Families F) Non-occupant Loans on G) Loans On Manufactured Number Average Value Number Average Value Number Average Value Number Average Value Number Average Value Number Average Value Number Average Value
LOANS ORIGINATED 22 $165,909 539 $195,163 684 $176,335 99 $78,313 7 $401,857 116 $127,509 1 $30,000 APPLICATIONS APPROVED, NOT ACCEPTED 0 $0 104 $147,769 123 $165,195 17 $33,941 0 $0 39 $115,538 0 $0 APPLICATIONS DENIED 7 $137,714 83 $147,819 365 $156,852 119 $51,445 3 $478,333 48 $134,979 1 $48,000 APPLICATIONS WITHDRAWN 4 $145,250 70 $184,571 206 $172,587 18 $113,167 3 $525,333 17 $120,588 0 $0 FILES CLOSED FOR INCOMPLETENESS 0 $0 18 $149,222 102 $158,235 2 $49,500 0 $0 10 $146,500 0 $0
Aggregated Statistics For Year 2003(Based on 11 full tracts) A) FHA, FSA/RHS & VA B) Conventional C) Refinancings D) Home Improvement Loans E) Loans on Dwellings For 5+ Families F) Non-occupant Loans on Number Average Value Number Average Value Number Average Value Number Average Value Number Average Value Number Average Value
LOANS ORIGINATED 32 $163,250 486 $194,979 1,678 $184,372 58 $38,845 10 $809,000 139 $129,288 APPLICATIONS APPROVED, NOT ACCEPTED 0 $0 46 $163,217 213 $159,404 13 $28,846 1 $170,000 23 $113,435 APPLICATIONS DENIED 1 $49,000 65 $165,292 424 $155,550 89 $23,697 0 $0 47 $85,468 APPLICATIONS WITHDRAWN 5 $150,600 125 $217,536 246 $160,000 9 $31,222 0 $0 20 $128,950 FILES CLOSED FOR INCOMPLETENESS 1 $96,000 21 $195,905 62 $165,694 2 $20,000 0 $0 2 $82,000
Aggregated Statistics For Year 2002(Based on 11 full tracts) A) FHA, FSA/RHS & VA B) Conventional C) Refinancings D) Home Improvement Loans E) Loans on Dwellings For 5+ Families F) Non-occupant Loans on Number Average Value Number Average Value Number Average Value Number Average Value Number Average Value Number Average Value
LOANS ORIGINATED 33 $145,848 455 $186,314 1,159 $181,105 76 $24,816 7 $1,010,000 117 $119,188 APPLICATIONS APPROVED, NOT ACCEPTED 2 $150,500 56 $171,214 179 $150,078 39 $31,846 0 $0 20 $95,850 APPLICATIONS DENIED 3 $131,000 58 $167,776 383 $147,243 86 $20,919 0 $0 30 $101,600 APPLICATIONS WITHDRAWN 7 $159,000 50 $154,960 238 $142,416 9 $90,333 0 $0 13 $97,385 FILES CLOSED FOR INCOMPLETENESS 1 $135,000 16 $145,250 74 $185,649 2 $41,500 0 $0 4 $117,250
Aggregated Statistics For Year 2001(Based on 11 full tracts) A) FHA, FSA/RHS & VA B) Conventional C) Refinancings D) Home Improvement Loans E) Loans on Dwellings For 5+ Families F) Non-occupant Loans on Number Average Value Number Average Value Number Average Value Number Average Value Number Average Value Number Average Value
LOANS ORIGINATED 54 $150,556 516 $169,390 985 $172,197 129 $39,690 3 $702,667 77 $121,532 APPLICATIONS APPROVED, NOT ACCEPTED 1 $173,000 47 $135,106 168 $120,756 41 $34,805 2 $2,080,000 19 $101,316 APPLICATIONS DENIED 2 $88,500 77 $135,584 397 $123,181 135 $15,874 0 $0 30 $77,267 APPLICATIONS WITHDRAWN 12 $133,250 53 $158,509 219 $141,329 17 $34,588 1 $124,000 10 $112,900 FILES CLOSED FOR INCOMPLETENESS 0 $0 13 $140,846 53 $139,453 4 $41,000 0 $0 1 $26,000
Aggregated Statistics For Year 2000(Based on 11 full tracts) A) FHA, FSA/RHS & VA B) Conventional C) Refinancings D) Home Improvement Loans E) Loans on Dwellings For 5+ Families F) Non-occupant Loans on Number Average Value Number Average Value Number Average Value Number Average Value Number Average Value Number Average Value
LOANS ORIGINATED 44 $137,273 461 $174,046 283 $134,714 137 $20,197 2 $1,665,000 48 $114,125 APPLICATIONS APPROVED, NOT ACCEPTED 1 $131,000 41 $135,585 92 $113,750 63 $20,349 1 $280,000 7 $63,714 APPLICATIONS DENIED 4 $90,500 95 $126,989 340 $127,126 145 $15,255 0 $0 29 $92,448 APPLICATIONS WITHDRAWN 7 $122,429 50 $159,540 140 $121,036 23 $50,565 3 $259,667 9 $97,889 FILES CLOSED FOR INCOMPLETENESS 0 $0 11 $136,091 32 $135,938 3 $16,667 1 $1,100,000 4 $88,250
Aggregated Statistics For Year 1999(Based on 11 full tracts) A) FHA, FSA/RHS & VA B) Conventional C) Refinancings D) Home Improvement Loans E) Loans on Dwellings For 5+ Families F) Non-occupant Loans on Number Average Value Number Average Value Number Average Value Number Average Value Number Average Value Number Average Value
LOANS ORIGINATED 40 $121,136 554 $164,167 572 $135,336 123 $16,536 9 $1,235,421 67 $94,697 APPLICATIONS APPROVED, NOT ACCEPTED 2 $114,670 77 $96,896 183 $99,309 62 $16,651 1 $7,940 20 $61,578 APPLICATIONS DENIED 8 $102,212 101 $104,753 332 $111,864 133 $20,399 2 $601,455 26 $64,997 APPLICATIONS WITHDRAWN 2 $80,570 50 $129,533 184 $115,441 20 $24,150 1 $146,980 14 $123,836 FILES CLOSED FOR INCOMPLETENESS 0 $0 10 $100,287 72 $116,279 0 $0 0 $0 2 $74,335
Detailed mortgage data for all 11 tracts in Shaker Heights, OH
Private Mortgage Insurance Companies Aggregated Statistics For Year 2009(Based on 10 full tracts) A) Conventional B) Refinancings C) Non-occupant Loans on Number Average Value Number Average Value Number Average Value
LOANS ORIGINATED 37 $220,892 8 $258,750 1 $82,000 APPLICATIONS APPROVED, NOT ACCEPTED 3 $249,000 8 $291,000 0 $0 APPLICATIONS DENIED 3 $117,667 4 $181,750 0 $0 APPLICATIONS WITHDRAWN 0 $0 0 $0 0 $0 FILES CLOSED FOR INCOMPLETENESS 1 $327,000 2 $157,000 0 $0
Aggregated Statistics For Year 2008(Based on 11 full tracts) A) Conventional B) Refinancings C) Non-occupant Loans on Number Average Value Number Average Value Number Average Value
LOANS ORIGINATED 50 $187,200 12 $221,500 7 $120,429 APPLICATIONS APPROVED, NOT ACCEPTED 13 $228,923 9 $204,778 4 $162,250 APPLICATIONS DENIED 6 $192,833 1 $360,000 1 $270,000 APPLICATIONS WITHDRAWN 3 $222,667 2 $169,000 1 $227,000 FILES CLOSED FOR INCOMPLETENESS 1 $175,000 2 $279,000 1 $175,000
Aggregated Statistics For Year 2007(Based on 11 full tracts) A) Conventional B) Refinancings C) Non-occupant Loans on Number Average Value Number Average Value Number Average Value
LOANS ORIGINATED 70 $164,243 33 $219,818 13 $172,462 APPLICATIONS APPROVED, NOT ACCEPTED 12 $157,583 9 $178,333 6 $166,000 APPLICATIONS DENIED 0 $0 8 $158,625 8 $158,625 APPLICATIONS WITHDRAWN 4 $145,750 1 $174,000 1 $203,000 FILES CLOSED FOR INCOMPLETENESS 1 $64,000 0 $0 0 $0
Aggregated Statistics For Year 2006(Based on 11 full tracts) A) Conventional B) Refinancings C) Non-occupant Loans on Number Average Value Number Average Value Number Average Value
LOANS ORIGINATED 53 $157,717 13 $175,231 11 $144,545 APPLICATIONS APPROVED, NOT ACCEPTED 12 $150,167 3 $159,333 1 $149,000 APPLICATIONS DENIED 2 $162,500 2 $133,000 0 $0 APPLICATIONS WITHDRAWN 4 $176,000 3 $297,000 0 $0 FILES CLOSED FOR INCOMPLETENESS 0 $0 0 $0 0 $0
Aggregated Statistics For Year 2005(Based on 11 full tracts) A) Conventional B) Refinancings C) Non-occupant Loans on Number Average Value Number Average Value Number Average Value
LOANS ORIGINATED 53 $166,660 26 $188,538 12 $155,250 APPLICATIONS APPROVED, NOT ACCEPTED 5 $114,400 9 $171,667 3 $154,333 APPLICATIONS DENIED 0 $0 2 $245,500 2 $245,500 APPLICATIONS WITHDRAWN 2 $195,000 1 $250,000 0 $0 FILES CLOSED FOR INCOMPLETENESS 0 $0 0 $0 0 $0
Aggregated Statistics For Year 2004(Based on 11 full tracts) A) Conventional B) Refinancings C) Non-occupant Loans on Number Average Value Number Average Value Number Average Value
LOANS ORIGINATED 65 $152,508 27 $174,815 10 $107,500 APPLICATIONS APPROVED, NOT ACCEPTED 13 $137,000 13 $130,231 1 $155,000 APPLICATIONS DENIED 1 $90,000 0 $0 1 $90,000 APPLICATIONS WITHDRAWN 7 $206,143 3 $201,667 0 $0 FILES CLOSED FOR INCOMPLETENESS 0 $0 0 $0 0 $0
Aggregated Statistics For Year 2003(Based on 11 full tracts) A) Conventional B) Refinancings C) Non-occupant Loans on Number Average Value Number Average Value Number Average Value
LOANS ORIGINATED 73 $154,562 59 $167,373 15 $120,867 APPLICATIONS APPROVED, NOT ACCEPTED 17 $148,235 25 $152,920 2 $115,000 APPLICATIONS DENIED 1 $198,000 3 $188,667 0 $0 APPLICATIONS WITHDRAWN 6 $189,667 11 $163,000 2 $219,000 FILES CLOSED FOR INCOMPLETENESS 1 $44,000 0 $0 1 $44,000
Aggregated Statistics For Year 2002(Based on 11 full tracts) A) Conventional B) Refinancings C) Non-occupant Loans on Number Average Value Number Average Value Number Average Value
LOANS ORIGINATED 93 $153,419 51 $169,255 17 $133,765 APPLICATIONS APPROVED, NOT ACCEPTED 14 $141,143 21 $175,143 3 $102,667 APPLICATIONS DENIED 1 $203,000 4 $179,750 2 $189,500 APPLICATIONS WITHDRAWN 5 $122,000 5 $135,400 0 $0 FILES CLOSED FOR INCOMPLETENESS 0 $0 2 $109,500 0 $0
Aggregated Statistics For Year 2001(Based on 11 full tracts) A) Conventional B) Refinancings C) Non-occupant Loans on Number Average Value Number Average Value Number Average Value
LOANS ORIGINATED 105 $155,610 62 $160,581 10 $120,400 APPLICATIONS APPROVED, NOT ACCEPTED 21 $119,143 15 $138,600 5 $109,000 APPLICATIONS DENIED 1 $194,000 1 $198,000 1 $198,000 APPLICATIONS WITHDRAWN 4 $187,000 2 $141,000 0 $0 FILES CLOSED FOR INCOMPLETENESS 1 $103,000 0 $0 0 $0
Aggregated Statistics For Year 2000(Based on 11 full tracts) A) Conventional B) Refinancings C) Non-occupant Loans on Number Average Value Number Average Value Number Average Value
LOANS ORIGINATED 116 $151,043 14 $134,500 10 $110,100 APPLICATIONS APPROVED, NOT ACCEPTED 15 $142,133 5 $95,800 0 $0 APPLICATIONS DENIED 2 $147,000 2 $139,500 1 $95,000 APPLICATIONS WITHDRAWN 2 $85,500 1 $190,000 0 $0 FILES CLOSED FOR INCOMPLETENESS 3 $154,667 0 $0 0 $0
Aggregated Statistics For Year 1999(Based on 11 full tracts) A) Conventional B) Refinancings C) Non-occupant Loans on Number Average Value Number Average Value Number Average Value
LOANS ORIGINATED 153 $153,331 29 $161,434 18 $112,157 APPLICATIONS APPROVED, NOT ACCEPTED 18 $147,173 6 $153,378 2 $138,520 APPLICATIONS DENIED 11 $99,371 2 $78,135 3 $59,777 APPLICATIONS WITHDRAWN 2 $118,500 0 $0 1 $106,000 FILES CLOSED FOR INCOMPLETENESS 5 $116,674 2 $272,575 3 $116,687
Shaker Heights compared to Ohio state average:
Unemployed percentage significantly below state average. Black race population percentage significantly above state average. Foreign-born population percentage above state average. House age above state average. Percentage of population with a bachelor's degree or higher significantly above state average. Shaker Heights on our top lists :
#25 on the list of "Top 101 cities with the largest racial income disparity between any two races with at least 2,000 householders"
#43 on the list of "Top 101 cities with largest percentage of males in occupations: health diagnosing and treating practitioners and other technical occupations (population 5,000+)"
#46 on the list of "Top 101 cities with largest percentage of males in industries: health care and social assistance (population 5,000+)"
#89 on the list of "Top 101 cities with largest percentage of males in occupations: legal occupations (population 5,000+)"
#91 on the list of "Top 101 cities with largest percentage of females in occupations: education, training, and library occupations (population 5,000+)"
#93 (44120) on the list of "Top 101 zip codes with the largest percentage of Hungarian first ancestries (pop 5,000+)"
#5 on the list of "Top 101 counties with the most Orthodox congregations"
#9 on the list of "Top 101 counties with the most Catholic congregations"
#9 on the list of "Top 101 counties with the most Orthodox adherents"
#10 on the list of "Top 101 counties with the most Black Protestant congregations"
#11 on the list of "Top 101 counties with the most Mainline Protestant congregations (pop. 50,000+)"
Top Patent Applicants
Mark Griswold (39)
Mark A. Griswold (37)
Benjamin D. Burge (23)
Geoffrey B. Thrope (21)
Matthew A. Silverman (20)
Douglas R. Bodmann (19)
Bahman Taheri (18)
Nathan J. Molnar (17)
Youssef L. Bennani (15)
Francis M. Sherwin (15)
Total of 1023 patent applications in 2008-2024.
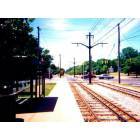
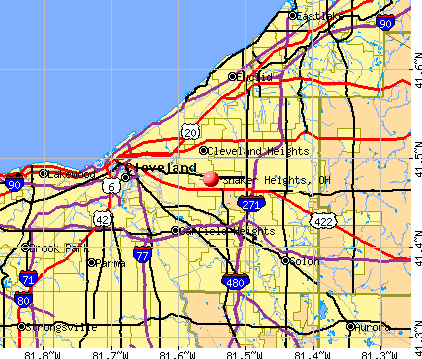


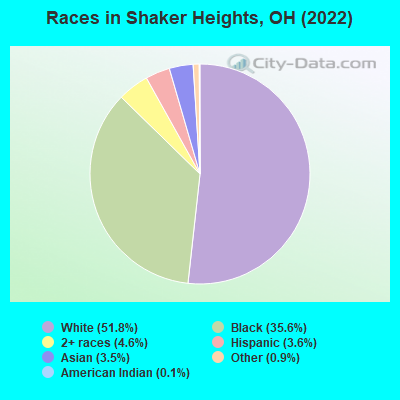
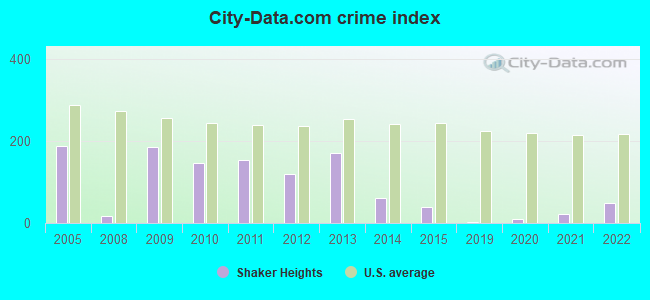
 Recent articles from our blog. Our writers, many of them Ph.D. graduates or candidates, create easy-to-read articles on a wide variety of topics.

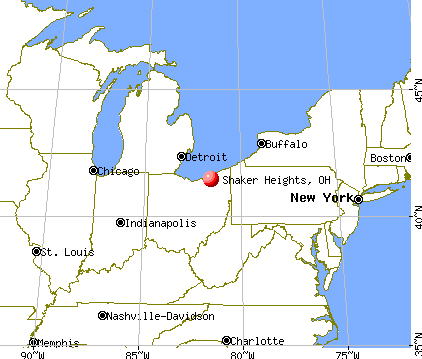
 (6.1 miles
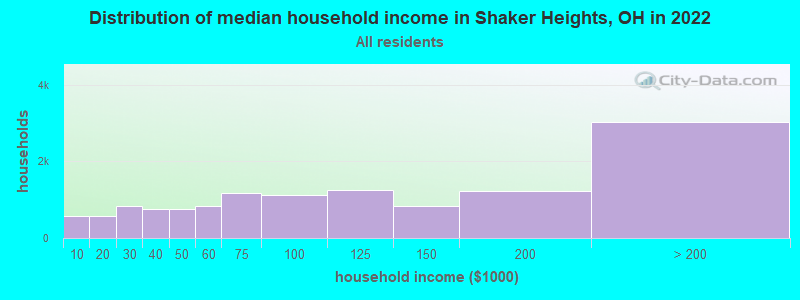
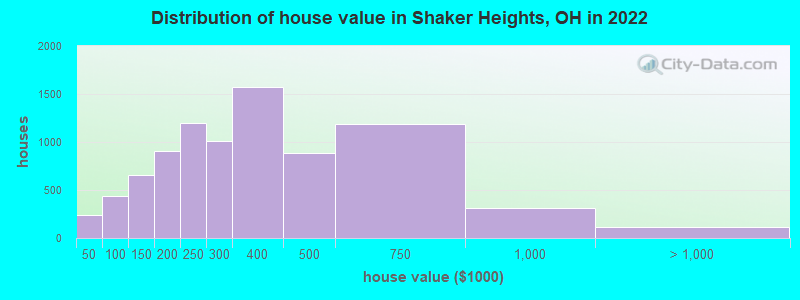

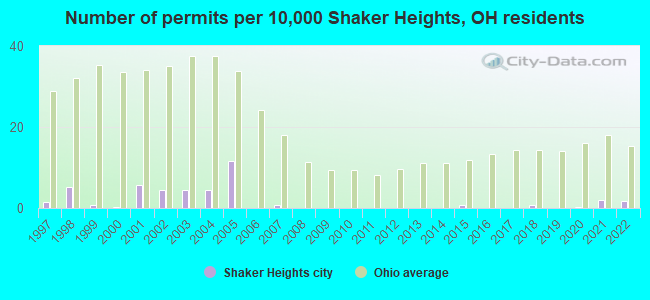
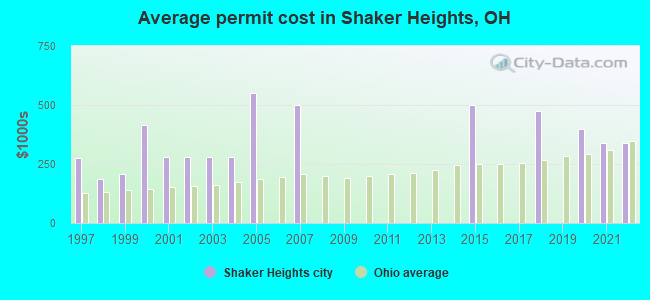
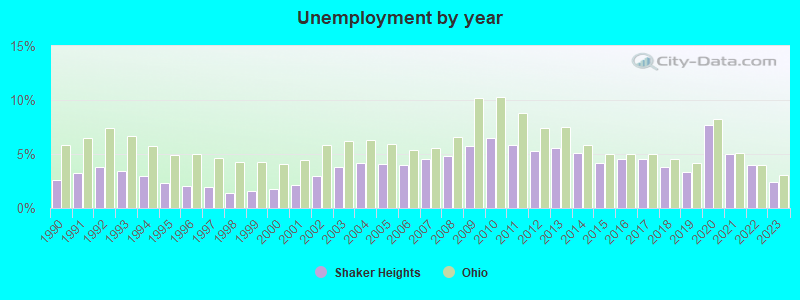
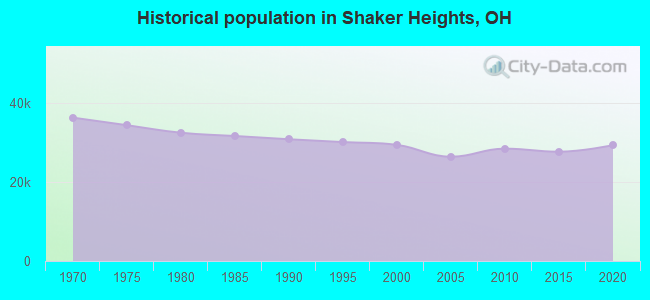
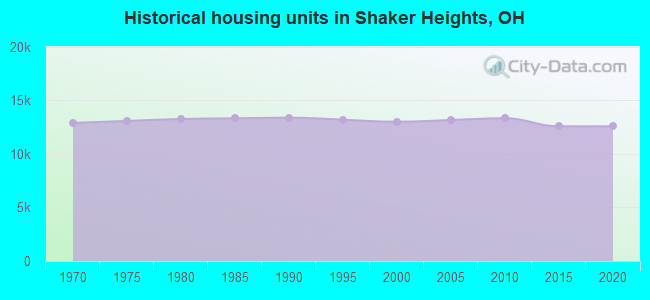
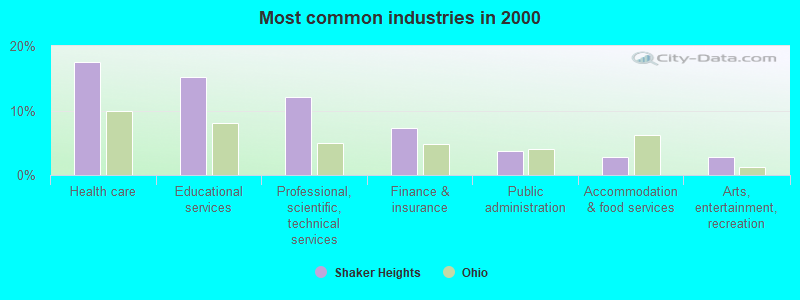
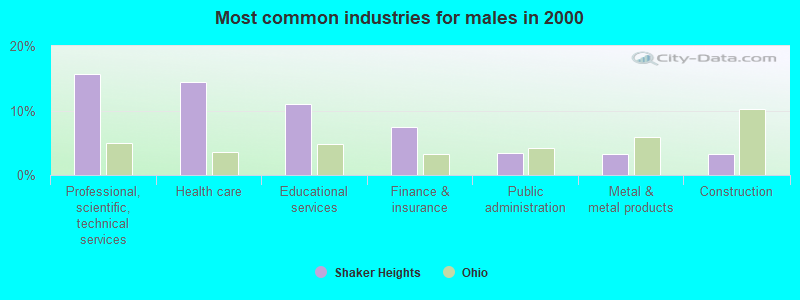
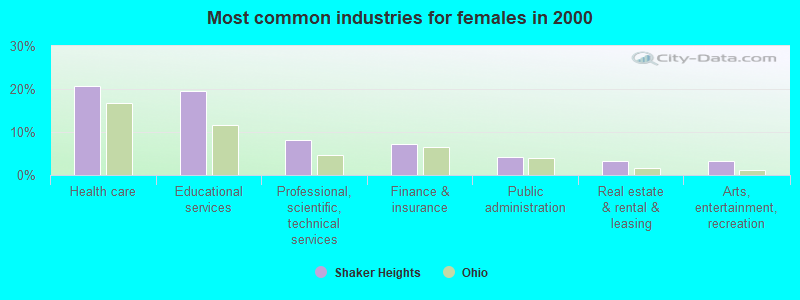
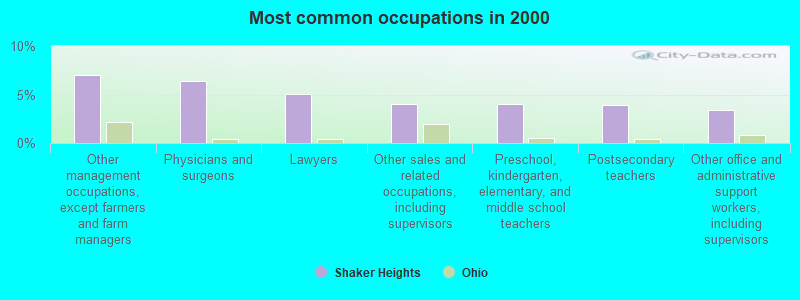
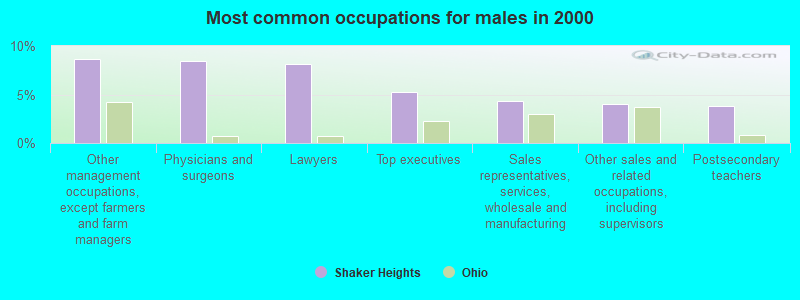
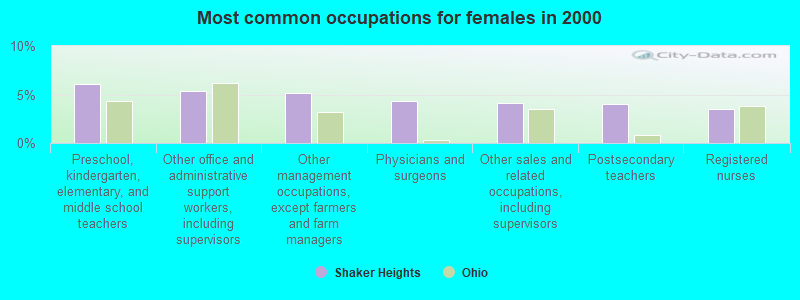


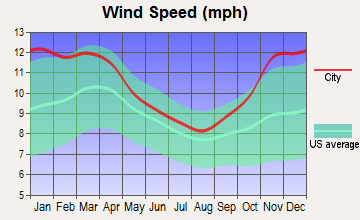


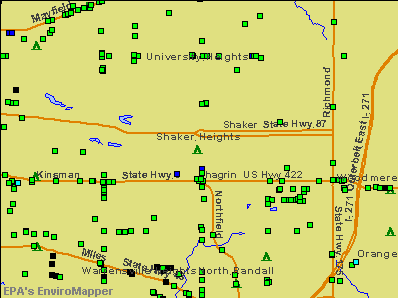

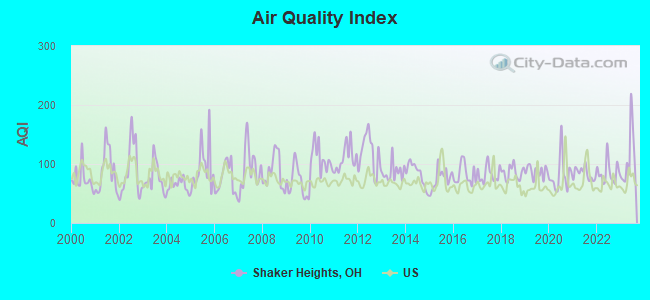
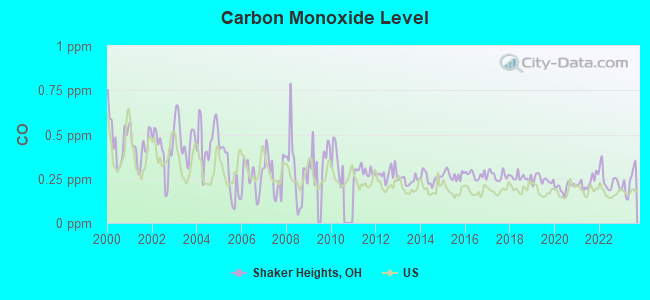
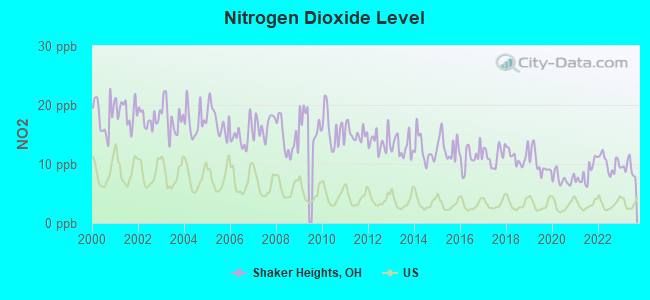
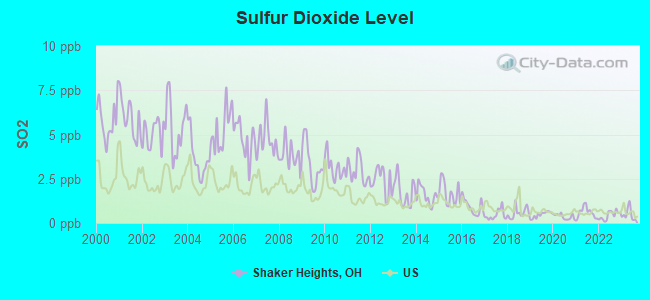
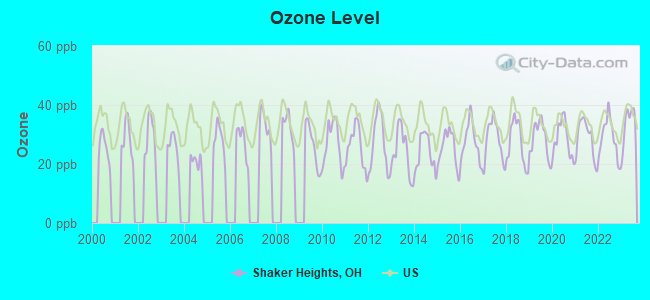
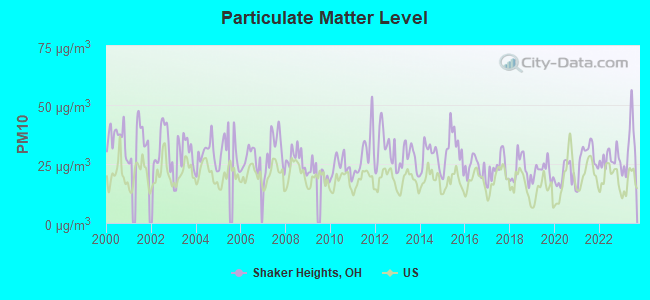
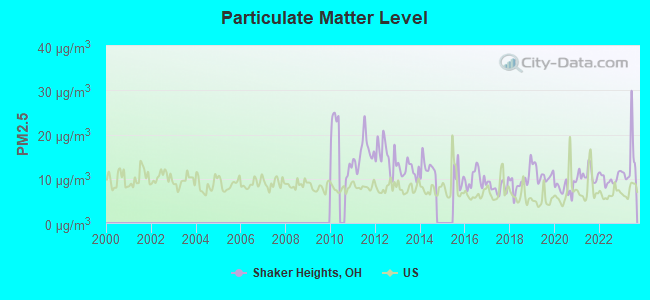

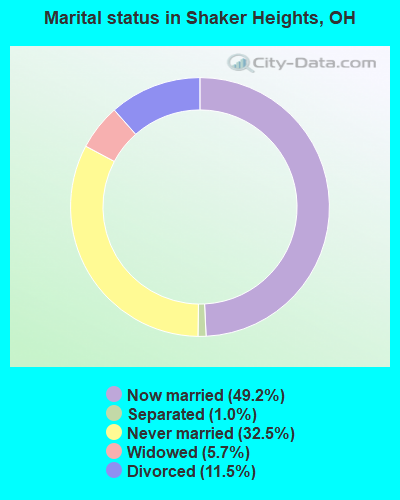
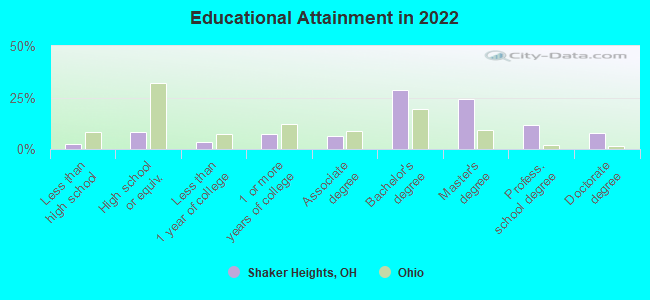
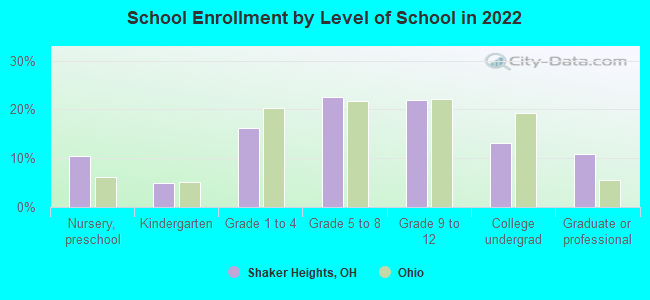
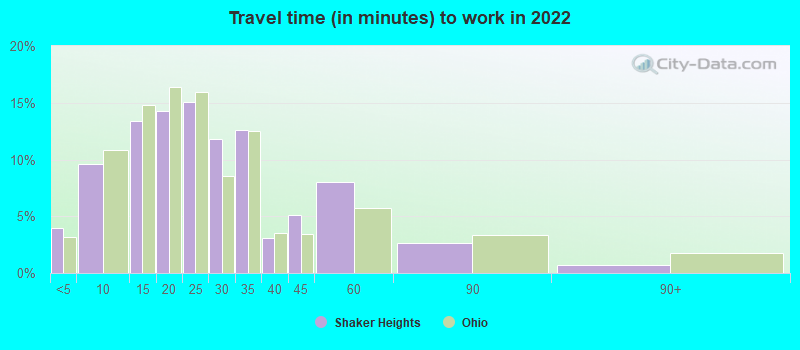
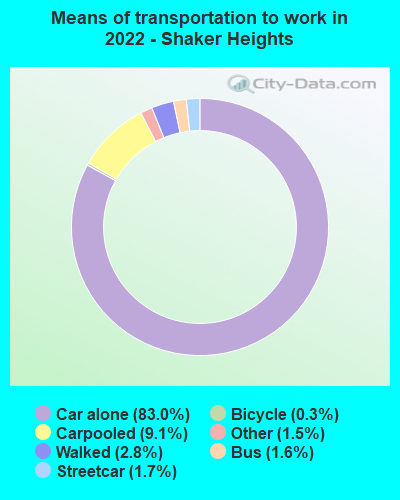
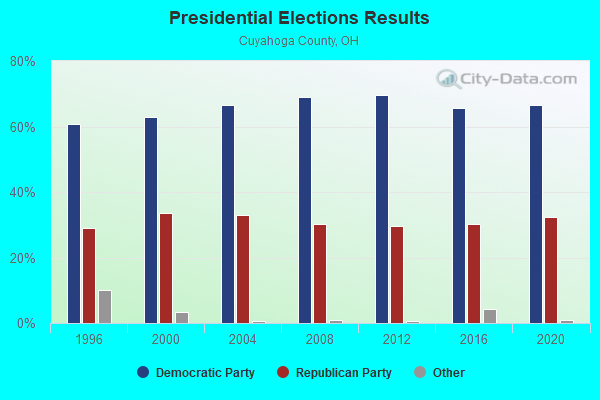
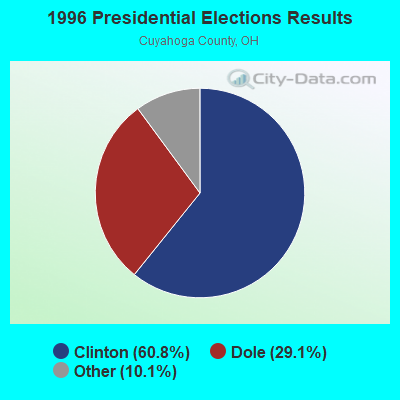
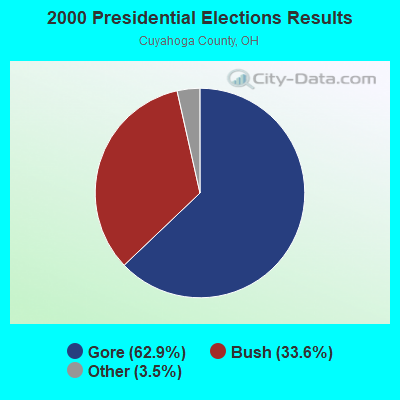
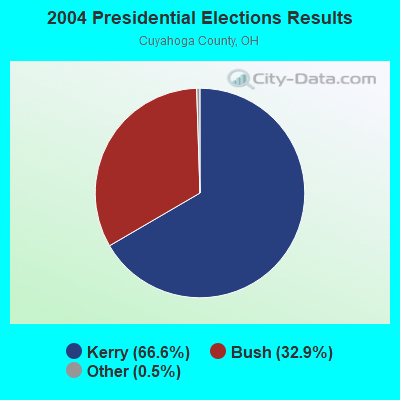
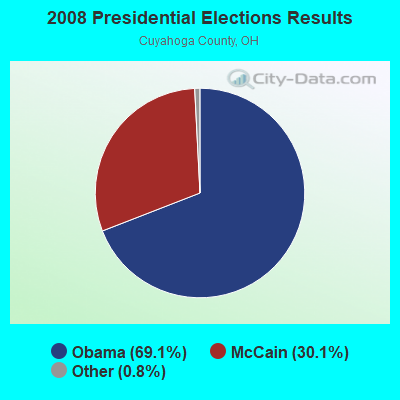
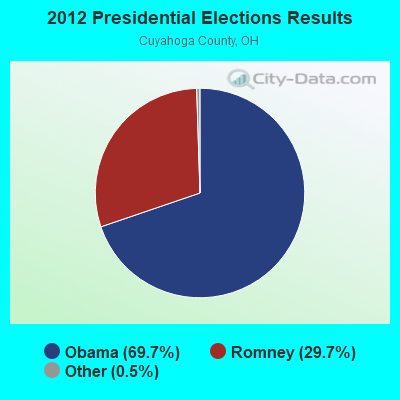
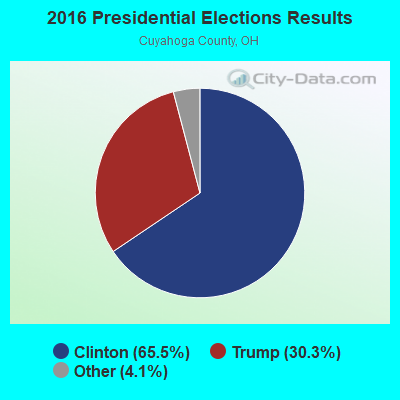
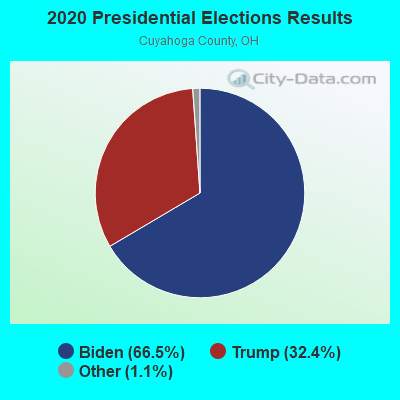
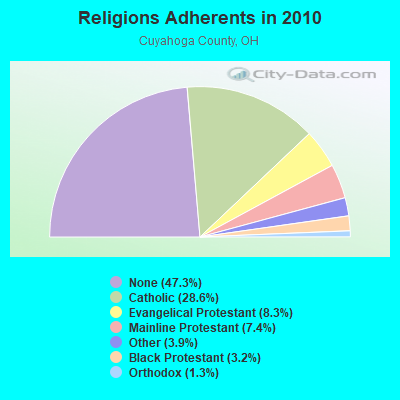
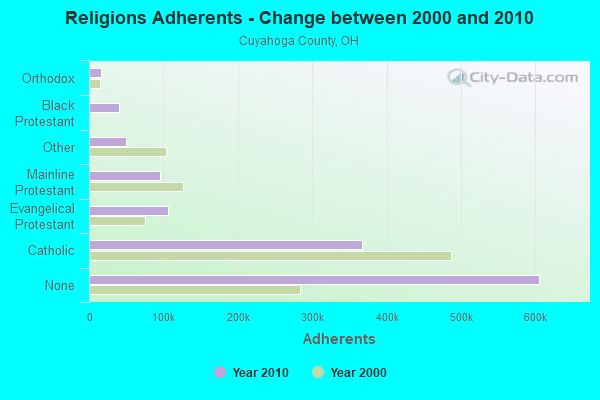
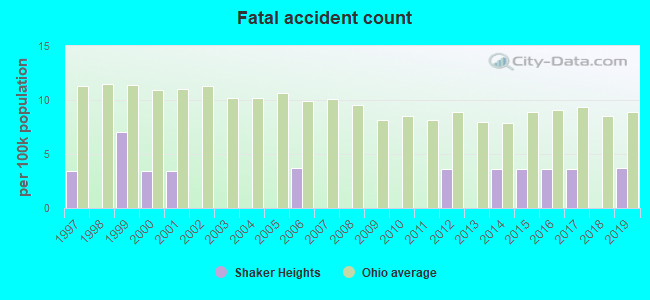
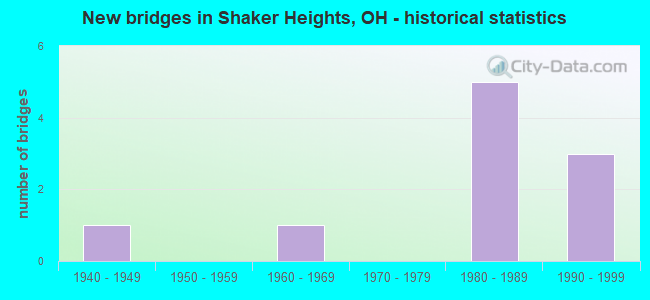
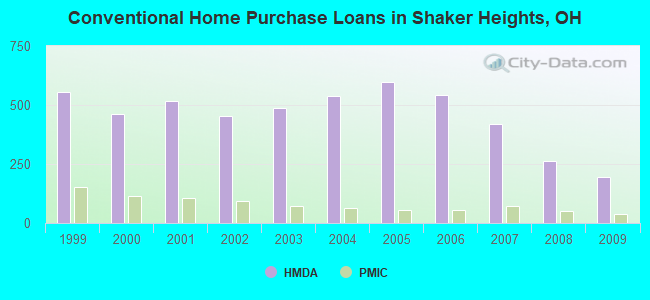
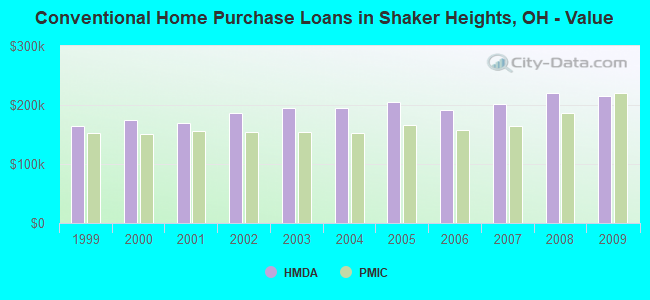
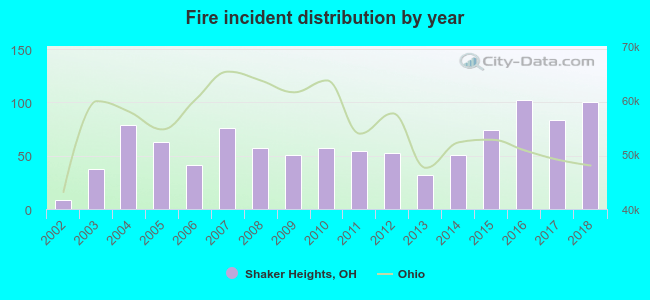 Based on the data from the years 2002 - 2018 the average number of fires per year is 60. The highest number of fires - 102 took place in 2016, and the least - 8 in 2002. The data has an increasing trend.
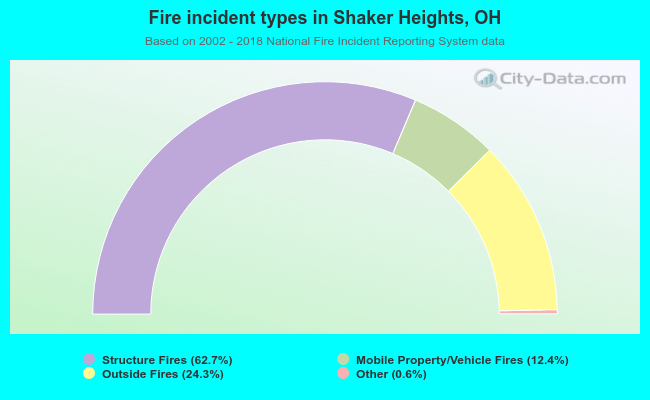 When looking into fire subcategories, the most reports belonged to: Structure Fires (62.7%), and Outside Fires (24.3%).