Estimated zip code population in 2022: 40,144 Zip code population in 2010: 38,282 Zip code population in 2000: 40,334
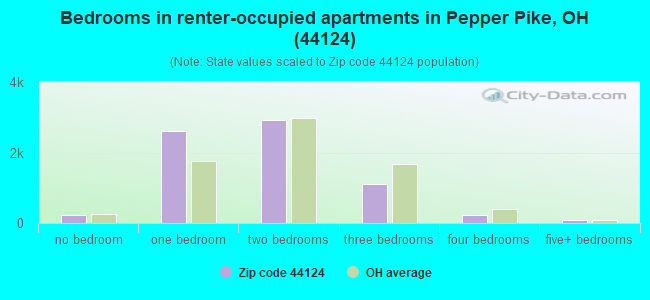
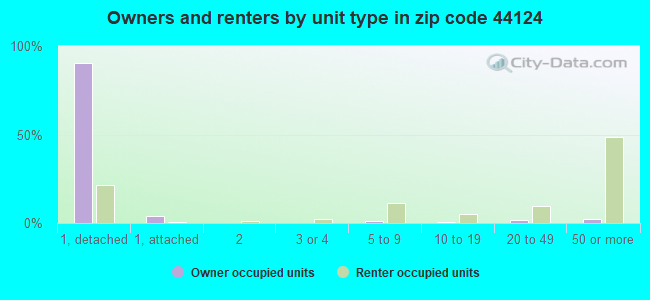
Houses and condos: 20,490 Renter-occupied apartments: 7,104
% of renters here:
37%
State:
33%
March 2022 cost of living index in zip code 44124: 95.7 (near average, U.S. average is 100)
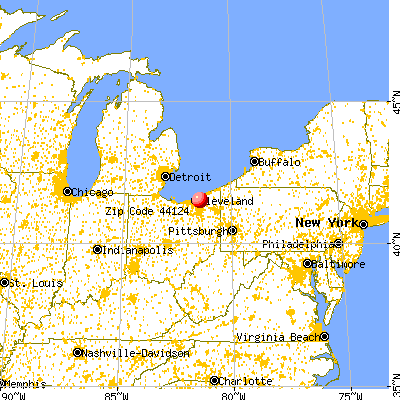
Land area: 14.6 sq. mi. Water area: 0.0 sq. mi.
Population density: 2,758 people per square mile
(average).
OSM Map
General Map
Google Map
MSN Map
OSM Map
General Map
Google Map
MSN Map
OSM Map
General Map
Google Map
MSN Map
OSM Map
General Map
Google Map
MSN Map
Please wait while loading the map...
Real estate property taxes paid for housing units in 2022:
This zip code:
2.1% ($4,457)
Ohio:
1.3% ($2,639)
Median real estate property taxes paid for housing units with mortgages in 2022: $4,401 (2.0%) Median real estate property taxes paid for housing units with no mortgage in 2022: $4,603 (2.2%)
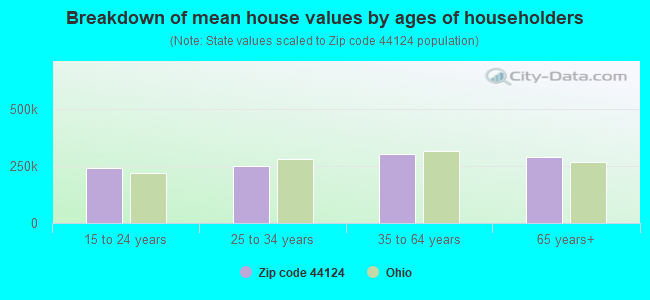
Estimated median house/condo value in 2022: $217,350
44124:
$217,350
Ohio:
$204,100
According to our research of Ohio and other state lists, there were 8 registered sex offenders living in 44124 zip code as of April 27, 2024. The ratio of all residents to sex offenders in zip code 44124 is 4,765 to 1. The ratio of registered sex offenders to all residents in this zip code is much lower than the state average.
Median resident age:
This zip code:
43.1 years
Ohio median age:
39.9 years
Average household size:
This zip code:
2.0 people
Ohio:
2.4 people
Averages for the 2020 tax year for zip code 44124, filed in 2021:
Average Adjusted Gross Income (AGI) in 2020: $102,274 (Individual Income Tax Returns)
Here:
$102,274
State:
$67,288
Salary/wage: $76,910 (reported on 79.1% of returns)
Here:
$76,910
State:
$55,628
(% of AGI for various income ranges: 1130.3% for AGIs below $25k, 3891.7% for AGIs $25k-50k, 6888.8% for AGIs $50k-75k, 10490.0% for AGIs $75k-100k, 18956.7% for AGIs $100k-200k, 127725.4% for AGIs over 200k)
Taxable interest for individuals: $3,523 (reported on 34.9% of returns)
This zip code:
$3,523
Ohio:
$1,518
(% of AGI for various income ranges: 33.2% for AGIs below $25k, 46.7% for AGIs $25k-50k, 66.1% for AGIs $50k-75k, 147.5% for AGIs $75k-100k, 284.8% for AGIs $100k-200k, 3809.5% for AGIs over 200k)
Ordinary dividends: $20,439 (reported on 29.6% of returns)
Here:
$20,439
State:
$7,167
(% of AGI for various income ranges: 71.7% for AGIs below $25k, 91.9% for AGIs $25k-50k, 170.9% for AGIs $50k-75k, 327.1% for AGIs $75k-100k, 830.9% for AGIs $100k-200k, 25140.0% for AGIs over 200k)
Net capital gain/loss in AGI: +$32,657 (reported on 26.5% of returns)
Here:
+$32,657
State:
+$18,919
(% of AGI for various income ranges: 20.1% for AGIs below $25k, 55.7% for AGIs $25k-50k, 134.8% for AGIs $50k-75k, 293.7% for AGIs $75k-100k, 894.1% for AGIs $100k-200k, 39762.0% for AGIs over 200k)
Profit/loss from business: +$16,400 (reported on 16.7% of returns)
Here:
+$16,400
State:
+$13,744
(% of AGI for various income ranges: 119.2% for AGIs below $25k, 140.7% for AGIs $25k-50k, 194.1% for AGIs $50k-75k, 262.1% for AGIs $75k-100k, 847.4% for AGIs $100k-200k, 6948.3% for AGIs over 200k)
Taxable individual retirement arrangement distribution: $23,194 (reported on 12.4% of returns)
44124:
$23,194
Ohio:
$18,876
(% of AGI for various income ranges: 115.2% for AGIs below $25k, 152.4% for AGIs $25k-50k, 255.4% for AGIs $50k-75k, 429.3% for AGIs $75k-100k, 1111.1% for AGIs $100k-200k, 5626.3% for AGIs over 200k)
Self-employed (Keogh) retirement plans: $27,688 (reported on 1.2% of returns)
44124:
$27,688
Ohio:
$24,898
(% of AGI for various income ranges: 13.6% for AGIs $50k-75k, 49.4% for AGIs $100k-200k, 1422.9% for AGIs over 200k)
Total itemized deductions: $50,441 (reported on 10.2% of returns)
Here:
$50,441
State:
$33,869
(% of AGI for various income ranges: 77.4% for AGIs below $25k, 121.4% for AGIs $25k-50k, 313.5% for AGIs $50k-75k, 559.4% for AGIs $75k-100k, 956.3% for AGIs $100k-200k, 17849.5% for AGIs over 200k)
Charity contributions: $32,352 (reported on 8.4% of returns)
Here:
$32,352
State:
$14,577
(% of AGI for various income ranges: 5.5% for AGIs below $25k, 16.0% for AGIs $25k-50k, 41.6% for AGIs $50k-75k, 80.1% for AGIs $75k-100k, 244.0% for AGIs $100k-200k, 12662.9% for AGIs over 200k)
Taxes paid: $8,556 (reported on 10.1% of returns)
44124:
$8,556
State:
$7,681
(% of AGI for various income ranges: 13.4% for AGIs below $25k, 27.4% for AGIs $25k-50k, 85.9% for AGIs $50k-75k, 188.8% for AGIs $75k-100k, 310.1% for AGIs $100k-200k, 1877.8% for AGIs over 200k)
Earned income credit: $1,859 (reported on 9.2% of returns)
Here:
$1,859
State:
$2,304
(% of AGI for various income ranges: 61.3% for AGIs below $25k, 41.2% for AGIs $25k-50k, 0.6% for AGIs $50k-75k)
Percentage of individuals using paid preparers for their 2020 taxes: 91.3%
Here:
91%
State:
94%
(% for various income ranges: 89.3% for AGIs below $25k, 91.5% for AGIs $25k-50k, 92.2% for AGIs $50k-75k, 91.7% for AGIs $75k-100k, 91.6% for AGIs $100k-200k, 94.1% for AGIs over 200k)
Averages for the 2012 tax year for zip code 44124, filed in 2013:
Average Adjusted Gross Income (AGI) in 2012: $88,303 (Individual Income Tax Returns)
Here:
$88,303
State:
$54,926
Salary/wage: $63,891 (reported on 79.3% of returns)
Here:
$63,891
State:
$45,869
(% of AGI for various income ranges: 65.6% for AGIs below $25k, 76.7% for AGIs $25k-50k, 73.6% for AGIs $50k-75k, 74.8% for AGIs $75k-100k, 70.5% for AGIs $100k-200k, 40.3% for AGIs over 200k)
Taxable interest for individuals: $3,128 (reported on 44.3% of returns)
This zip code:
$3,128
Ohio:
$1,297
(% of AGI for various income ranges: 2.8% for AGIs below $25k, 1.1% for AGIs $25k-50k, 1.0% for AGIs $50k-75k, 1.0% for AGIs $75k-100k, 1.6% for AGIs $100k-200k, 1.8% for AGIs over 200k)
Ordinary dividends: $17,196 (reported on 32.9% of returns)
Here:
$17,196
State:
$5,821
(% of AGI for various income ranges: 4.9% for AGIs below $25k, 2.1% for AGIs $25k-50k, 2.4% for AGIs $50k-75k, 2.7% for AGIs $75k-100k, 3.5% for AGIs $100k-200k, 10.2% for AGIs over 200k)
Net capital gain/loss in AGI: +$21,453 (reported on 26.0% of returns)
Here:
+$21,453
State:
+$11,232
(% of AGI for various income ranges: 0.2% for AGIs below $25k, 0.4% for AGIs $25k-50k, 0.6% for AGIs $50k-75k, 0.8% for AGIs $75k-100k, 2.0% for AGIs $100k-200k, 12.2% for AGIs over 200k)
Profit/loss from business: +$19,461 (reported on 14.6% of returns)
Here:
+$19,461
State:
+$12,773
(% of AGI for various income ranges: 6.8% for AGIs below $25k, 2.7% for AGIs $25k-50k, 2.4% for AGIs $50k-75k, 3.0% for AGIs $75k-100k, 3.2% for AGIs $100k-200k, 3.3% for AGIs over 200k)
Taxable individual retirement arrangement distribution: $21,171 (reported on 15.7% of returns)
44124:
$21,171
Ohio:
$14,511
(% of AGI for various income ranges: 6.1% for AGIs below $25k, 3.4% for AGIs $25k-50k, 3.6% for AGIs $50k-75k, 4.0% for AGIs $75k-100k, 5.2% for AGIs $100k-200k, 3.1% for AGIs over 200k)
Self-employment retirement plans: $29,865 (reported on 1.3% of returns)
44124:
$29,865
Ohio:
$20,257
(% of AGI for various income ranges: 0.2% for AGIs $75k-100k, 0.3% for AGIs $100k-200k, 0.7% for AGIs over 200k)
Total itemized deductions: $30,305 (19% of AGI, reported on 42.8% of returns)
Here:
$30,305
State:
$21,278
Here:
18.6% of AGI
State:
18.8% of AGI
(% of AGI for various income ranges: 14.1% for AGIs below $25k, 10.8% for AGIs $25k-50k, 14.2% for AGIs $50k-75k, 14.9% for AGIs $75k-100k, 16.7% for AGIs $100k-200k, 14.9% for AGIs over 200k)
Charity contributions: $7,116 (reported on 35.2% of returns)
Here:
$7,116
State:
$3,943
(% of AGI for various income ranges: 1.0% for AGIs below $25k, 1.0% for AGIs $25k-50k, 1.5% for AGIs $50k-75k, 1.6% for AGIs $75k-100k, 2.2% for AGIs $100k-200k, 4.2% for AGIs over 200k)
Taxes paid: $15,209 (reported on 42.5% of returns)
44124:
$15,209
State:
$9,568
(% of AGI for various income ranges: 4.2% for AGIs below $25k, 4.2% for AGIs $25k-50k, 6.0% for AGIs $50k-75k, 7.0% for AGIs $75k-100k, 8.8% for AGIs $100k-200k, 8.1% for AGIs over 200k)
Earned income credit: $1,791 (reported on 9.3% of returns)
Here:
$1,791
State:
$2,285
(% of AGI for various income ranges: 3.3% for AGIs below $25k, 0.5% for AGIs $25k-50k)
Percentage of individuals using paid preparers for their 2012 taxes: 54.8%
Here:
55%
State:
51%
(% for various income ranges: 49.9% for AGIs below $25k, 51.3% for AGIs $25k-50k, 54.0% for AGIs $50k-75k, 57.4% for AGIs $75k-100k, 59.2% for AGIs $100k-200k, 83.5% for AGIs over 200k)
Averages for the 2004 tax year for zip code 44124, filed in 2005:
Average Adjusted Gross Income (AGI) in 2004: $69,395 (Individual Income Tax Returns)
Here:
$69,395
State:
$44,480
Salary/wage: $53,740 (reported on 76.6% of returns)
Here:
$53,740
State:
$39,198
(% of AGI for various income ranges: 90.5% for AGIs below $10k, 61.4% for AGIs $10k-25k, 75.5% for AGIs $25k-50k, 73.7% for AGIs $50k-75k, 75.8% for AGIs $75k-100k, 48.2% for AGIs over 100k)
Taxable interest for individuals: $3,708 (reported on 63.2% of returns)
This zip code:
$3,708
Ohio:
$1,532
(% of AGI for various income ranges: 14.4% for AGIs below $10k, 6.2% for AGIs $10k-25k, 3.1% for AGIs $25k-50k, 2.6% for AGIs $50k-75k, 2.6% for AGIs $75k-100k, 3.3% for AGIs over 100k)
Taxable dividends: $8,192 (reported on 42.4% of returns)
Here:
$8,192
State:
$3,496
(% of AGI for various income ranges: 11.7% for AGIs below $10k, 4.1% for AGIs $10k-25k, 2.6% for AGIs $25k-50k, 2.7% for AGIs $50k-75k, 2.9% for AGIs $75k-100k, 6.5% for AGIs over 100k)
Net capital gain/loss: +$19,841 (reported on 33.3% of returns)
Here:
+$19,841
State:
+$8,582
(% of AGI for various income ranges: 1.7% for AGIs below $10k, 0.4% for AGIs $10k-25k, 1.0% for AGIs $25k-50k, 0.9% for AGIs $50k-75k, 1.6% for AGIs $75k-100k, 16.0% for AGIs over 100k)
Profit/loss from business: +$17,774 (reported on 14.4% of returns)
Here:
+$17,774
State:
+$10,813
(% of AGI for various income ranges: 10.4% for AGIs below $10k, 5.4% for AGIs $10k-25k, 2.5% for AGIs $25k-50k, 2.7% for AGIs $50k-75k, 3.2% for AGIs $75k-100k, 4.1% for AGIs over 100k)
IRA payment deduction: $3,153 (reported on 3.5% of returns)
44124:
$3,153
Ohio:
$2,794
(% of AGI for various income ranges: 0.3% for AGIs below $10k, 0.4% for AGIs $10k-25k, 0.4% for AGIs $25k-50k, 0.2% for AGIs $50k-75k, 0.2% for AGIs $75k-100k, 0.1% for AGIs over 100k)
Self-employed pension: $18,533 (reported on 1.5% of returns)
Here:
$18,533
Ohio:
$13,981
(% of AGI for various income ranges: 0.1% for AGIs $25k-50k, 0.1% for AGIs $50k-75k, 0.2% for AGIs $75k-100k, 0.6% for AGIs over 100k)
Total itemized deductions: $24,440 (20% of AGI, reported on 45.9% of returns)
Here:
$24,440
State:
$17,503
Here:
20.1% of AGI
State:
20.8% of AGI
(% of AGI for various income ranges: 24.8% for AGIs below $10k, 15.8% for AGIs $10k-25k, 14.4% for AGIs $25k-50k, 16.7% for AGIs $50k-75k, 17.8% for AGIs $75k-100k, 16.1% for AGIs over 100k)
Charity contributions deductions: $5,155 (4% of AGI, reported on 40.4% of returns)
Here:
$5,155
State:
$3,087
Here:
3.9% of AGI
State:
3.4% of AGI
(% of AGI for various income ranges: 1.4% for AGIs below $10k, 1.4% for AGIs $10k-25k, 1.4% for AGIs $25k-50k, 1.9% for AGIs $50k-75k, 1.9% for AGIs $75k-100k, 4.0% for AGIs over 100k)
Total tax: $13,367 (reported on 81.4% of returns)
44124:
$13,367
State:
$6,781
(% of AGI for various income ranges: 3.6% for AGIs below $10k, 4.6% for AGIs $10k-25k, 7.9% for AGIs $25k-50k, 10.0% for AGIs $50k-75k, 11.0% for AGIs $75k-100k, 20.9% for AGIs over 100k)
Earned income credit: $1,317 (reported on 5.6% of returns)
Here:
$1,317
State:
$1,696
Percentage of individuals using paid preparers for their 2004 taxes: 59.0%
Here:
59%
State:
55%
(% for various income ranges: 54.3% for AGIs below $10k, 59.1% for AGIs $10k-25k, 56.7% for AGIs $25k-50k, 58.2% for AGIs $50k-75k, 55.0% for AGIs $75k-100k, 74.2% for AGIs over 100k)
Likely homosexual households (counted as self-reported same-sex unmarried-partner households)
Lesbian couples: 0.0% of all households
Gay men: 0.1% of all households
Household received Food Stamps/SNAP in the past 12 months: 1,303 Household did not receive Food Stamps/SNAP in the past 12 months: 18,000
Women who had a birth in the past 12 months: 496 (461 now married, 43 unmarried) Women who did not have a birth in the past 12 months: 8,113 (3,663 now married, 4,448 unmarried)
Housing units in zip code 44124 with a mortgage: 7,662 (806 second mortgage, 16 home equity loan, 736 both second mortgage and home equity loan) Houses without a mortgage: 534
Median monthly owner costs for units with a mortgage: $1,540 Median monthly owner costs for units without a mortgage: $772
Residents with income below the poverty level in 2022:
This zip code:
6.0%
Whole state:
13.4%
Residents with income below 50% of the poverty level in 2022:
This zip code:
2.5%
Whole state:
7.0%
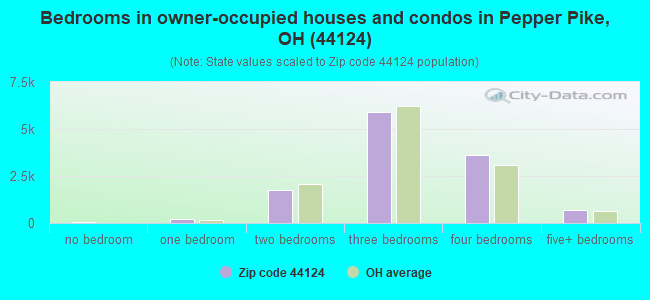
Median number of rooms in houses and condos:
Here:
6.9
State:
6.7
Median number of rooms in apartments:
Here:
4.1
State:
4.4
Notable locations in this zip code not listed on our city pages
Notable locations in zip code 44124: Lander Haven Country Club (A), Lander Circle (B), Lyndhurst Golf Course (C), Pepper Pike Country Club (D), Lyndhurst Fire Department (E), Mayfield Heights Fire Department (F), Pepper Pike Fire Department (G), Wasmer Gallery (H), Ursuline Educational Center (I), Sophia Center (J), Sister Dorothy Kazel Global Awareness Center (K), Saint Mark Center (L), Ralph M Besse Library (M), Pilla Center (N), Murphy Hall (O), Mullen Academic Building (P), Matthew O'Brien Campus Center (Q), Grace Hall (R), Fritzsche Center (S), Dauby Science Center (T). Display/hide their locations on the map
Shopping Centers: La Place Shopping Center (1), Landerwood Plaza Shopping Center (2), Maymore Shopping Center (3), Mayland Shopping Center (4), Golden Gate Shopping Center (5), East Gate Shopping Center (6). Display/hide their locations on the map
Churches in zip code 44124 include: Saint Clares Catholic Church (A), Garfield Church (B), Temple Brith Emeth (C), Trinity Church (D). Display/hide their locations on the map
Cemeteries: Acacia Park Cemetery (1), Jackson Family Plot (2), Kinsman Road Cemetery (3), Knollwood Cemetery (4), Orange Cemetery (5), Orange Hill Cemetery (6). Display/hide their locations on the map
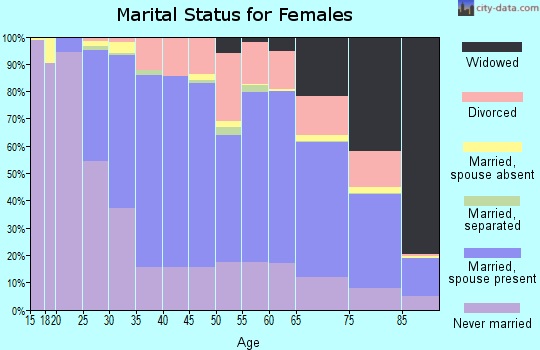
5,548 married couples with children.
1,586 single-parent households (380 men, 1,206 women).
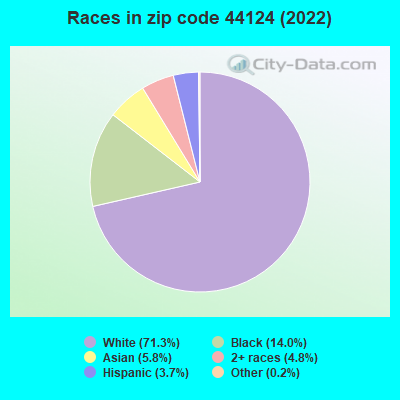
82.5% of residents of 44124 zip code speak English at home.
2.6% of residents speak Spanish at home (84% very well, 6% well, 10% not well).
11.5% of residents speak other Indo-European language at home (52% very well, 32% well, 15% not well, 1% not at all).
2.7% of residents speak Asian or Pacific Island language at home (56% very well, 24% well, 20% not well).
1.7% of residents speak other language at home (84% very well, 16% well).
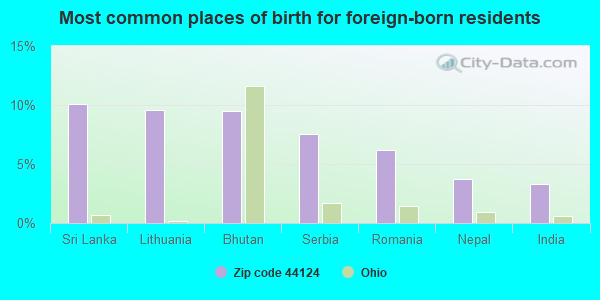
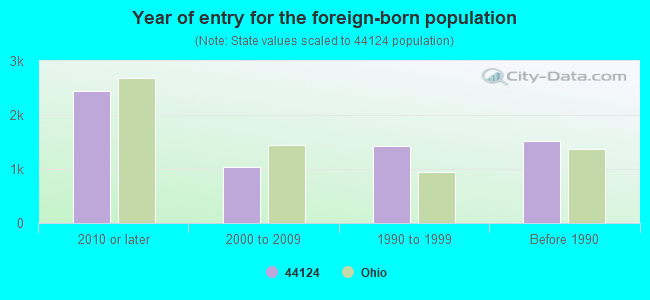
Foreign born population: 6,115 (15.2%) (66.0% of them are naturalized citizens)
Facilities with environmental interests located in this zip code:
BP OIL CO SITE 02158 * (5615 MAYFIELD RD in LYNDHURST, OH)
AIR MINOR (AIRS/AFS) STATE MASTER (Ohio general info) - RCRA-OHD987026390, HAZARDOUS WASTE PROGRAM STATE MASTER (Ohio general info) - EPCRA, AIR MAJOR Small Quantity Generators, between 100 kg and 1000 kg of hazardous waste/month (Resource Conservation and Recovery Act (tracking hazardous waste)) - notification Business SIC classification: GASOLINE SERVICE STATIONS Organizations: BP OIL COMPANY (CONTACT/OWNER)
, CITGO OF LYNDHURST (CONTACT/OWNER)
Alternative names: BP OF LYNDHURST *, CITGO OF LYNDHURST
BP OIL CO SITE 04806 * (6680 MAYFIELD RD in MAYFIELD HEIGHTS, OH)
AIR MINOR (AIRS/AFS) STATE MASTER (Ohio general info) - RCRA-OHD987026408, HAZARDOUS WASTE PROGRAM STATE MASTER (Ohio general info) - -18-5541-905-36, EPCRA Conditionally Exempt Small Quantity Generators, less than 100 kg/month of hazardous waste (Resource Conservation and Recovery Act (tracking hazardous waste)) - notification Business SIC classification: GASOLINE SERVICE STATIONS Organizations: BP OIL COMPANY (CONTACT/OWNER)
Alternative names: BP AMOCO # 22390, BP OIL CO NO 04806 *, BP OIL COMPANY #04806
BOLTON SCHOOL (9803 QUEBEC AVE in MAYFIELD HEIGHTS, OH)
(Geographic Names Information System) (National Center for Education Statistics) - STATE ID-003137 STATE MASTER (Ohio general info) - AIR MAJOR Organizations: CLEVELAND MUNICIPAL SD (SCHOOL DISTRICT)
Alternative names: BOLTON ELE SCHOOL NO 041, BOLTON ELEMENTARY SCHOOL
BP OIL CO SITE 04893 (30299 CHAGRIN RD in PEPPER PIKE, OH)
AIR MINOR (AIRS/AFS) STATE MASTER (Ohio general info) - RCRA-OHD987026416, HAZARDOUS WASTE PROGRAM, AIR MAJOR, EPCRA Conditionally Exempt Small Quantity Generators, less than 100 kg/month of hazardous waste (Resource Conservation and Recovery Act (tracking hazardous waste)) - notification Business SIC classification: GASOLINE SERVICE STATIONS Organizations: BP OIL COMPANY (CONTACT/OWNER)
Alternative names: BP AMOCO # 22419 WAS #04893REPLACED BY, BP OIL COMPANY#04893
AL & FRAN CLEANERS (1471 SOM CENTER RD in MAYFIELD HEIGHTS, OH)
STATE MASTER (Ohio general info) - RCRA-OHR000001719, HAZARDOUS WASTE PROGRAM Small Quantity Generators, between 100 kg and 1000 kg of hazardous waste/month (Resource Conservation and Recovery Act (tracking hazardous waste)) - notification Organizations: GATE CLEANERS INC (CONTACT/OWNER)
BALLARD BRADY MIDDLE SCHOOL (32000 CHAGRIN BLVD in PEPPER PIKE, OH)
(Geographic Names Information System) (National Center for Education Statistics) - STATE ID-003400 Organizations: ORANGE CITY SD (SCHOOL DISTRICT)
BEECHBROOK ORPHANAGE (3737 LANDER RD. in PEPPER PIKE, OH)
(Geographic Names Information System) (National Center for Education Statistics) - STATE ID-065144 Organizations: ORANGE CITY SD (SCHOOL DISTRICT)
Alternative names: BEECH BROOK SPECIAL NEEDS SCH
BOLGER DAVID F TRUST (13400 BROOKPARK in CLEVELAND, OH)
ASPEN DENTAL (1300 SOM CENTER RD in MAYFIELD HEIGHTS, OH)
Conditionally Exempt Small Quantity Generators, less than 100 kg/month of hazardous waste (Resource Conservation and Recovery Act (tracking hazardous waste)) Organizations: RUBINS NOEL (CONTACT/OPERATOR)
APEX PEST CONTROL SERVICES (6107 MAYFIELD RD in MAYFIELD HEIGHTS, OH)
Conditionally Exempt Small Quantity Generators, less than 100 kg/month of hazardous waste (Resource Conservation and Recovery Act (tracking hazardous waste)) - notification Organizations: STOCKER JAMES (CONTACT/OWNER)
CHEMMARK OF OHIO (5213 GRANT AVENUE in CLEVELAND, OH)
COMPLIANCE ACTIVITY (Tracking inspections of insecticide, fungicide, and rodenticide, and toxic substances)
ALCON ALUMINUM CORP (6060 PARKLAND BLVD in CLEVELAND, OH)
COMPLIANCE ACTIVITY (Tracking inspections of insecticide, fungicide, and rodenticide, and toxic substances)
Housing units lacking complete plumbing facilities: 0.5% Housing units lacking complete kitchen facilities: 0.8%
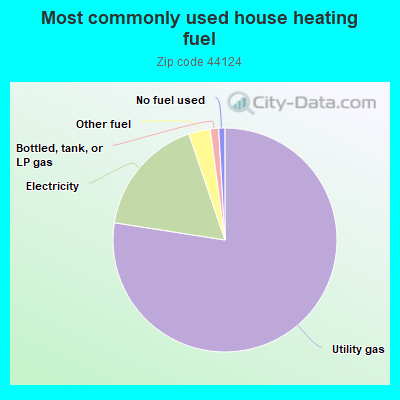
77.4%Utility gas
17.3%Electricity
3.1%Other fuel
1.2%Bottled, tank, or LP gas
0.9%No fuel used
Population in 1990: 41,699.
Place of birth for U.S.-born residents:
This state: 26,526
Northeast: 3,100
Midwest: 1,706
South: 1,666
West: 815
68% of the 44124 zip code residents lived in the same house 5 years ago. Out of people who lived in different houses, 71% lived in this county. Out of people who lived in different counties, 50% lived in Ohio.
89% of the 44124 zip code residents lived in the same house 1 year ago. Out of people who lived in different houses, 55% moved from this county. Out of people who lived in different houses, 24% moved from different county within same state. Out of people who lived in different houses, 13% moved from different state. Out of people who lived in different houses, 8% moved from abroad.
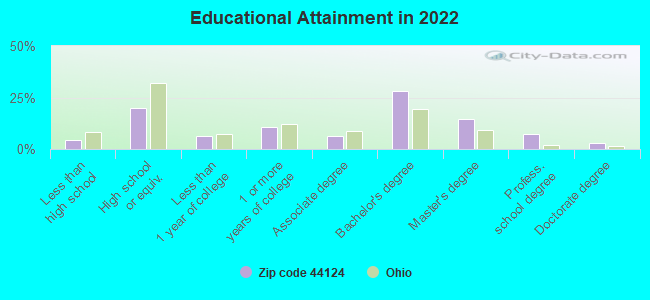
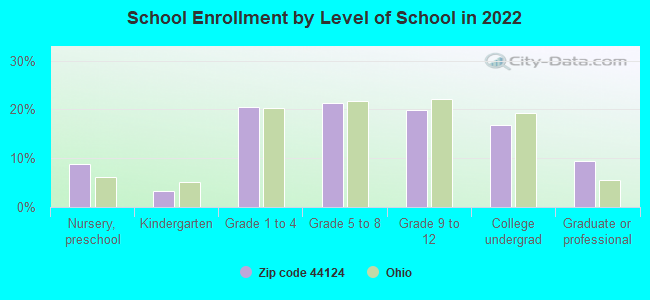
Private vs. public school enrollment:
Students in private schools in grades 1 to 8 (elementary and middle school): 713
Here:
22.1%
Ohio:
16.0%
Students in private schools in grades 9 to 12 (high school): 391
Here:
25.3%
Ohio:
13.1%
Students in private undergraduate colleges: 371
Here:
28.6%
Ohio:
22.3%
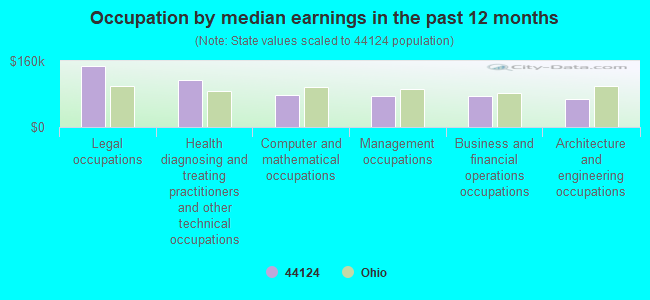
Occupation by median earnings in the past 12 months ($)
147,669Legal occupations
113,957Health diagnosing and treating practitioners and other technical occupations
78,735Computer and mathematical occupations
75,744Management occupations
75,404Business and financial operations occupations
67,466Architecture and engineering occupations
Companies with federal contracts located in this zip code:
ROCKWELL AUTOMATION, INC (1 ALLEN BRADLEY DR in CLEVELAND, OH) : $7,276,818 in 96 contractsfrom 1999 to 2006
Contracts for ADP Components, Miscellaneous Communication Equipment, Liquid and Gas Flow, Liquid Level, and Mechanical Motion Measuring Instruments, ADPE System Configuration, and moreby Navy, U.S. Army Corps of Engineers - civil program financing only, Defense Logistics Agency Signed by year:2000: $2,460,684; 2001: $1,373,612; 2002: $1,322,765; 2003: $752,662; 2004: $445,757; 2005: $874,169; 2006: $14,119.
Biggest contracts:
$956,218 with Navy for ADP Components. Signed on 2000-09-28. Completion date: 2003-09-28.
$750,669, same as above.Signed on 2002-06-03. Completion date: 2002-11-30.
$719,393 with Navy for Miscellaneous Communication Equipment. Signed on 2003-04-03. Completion date: 2003-04-17.
$718,409 with Navy for ADP Components. Signed on 2001-09-05. Completion date: 2001-04-30.
APPLICATION DESIGN CONSULTANTS (30150 BRYCE RD in CLEVELAND, OH; small business) : $2,640,770 in 8 contractsfrom 1999 to 2004
Contracts for Construction of Structures and Facilities -- Electronic and Communications Facilities, Other Professional Services, Other ADP and Telecommunications Services (includes data storage on tapes, compact disks, etc.), Systems Engineering Services by Department of Defense, Defense Finance and Accounting Service Signed by year:2000: $156,000; 2001: $0; 2002: $858,590; 2003: $777,601; 2004: $345,724; 2005: $0; 2006: $0.
Biggest contracts:
$858,590 with Department of Defense for Construction of Structures and Facilities -- Electronic and Communications Facilities. Signed on 2002-12-16. Completion date: 2003-09-30.
$502,855 with Department of Defense for Other Professional Services. Signed on 1999-10-18. Completion date: 2000-09-30.
$444,243 with Defense Finance and Accounting Service for Other ADP and Telecommunications Services (includes data storage on tapes, compact disks, etc.). Signed on 2003-10-20. Completion date: 2003-09-30.
$257,256 with Defense Finance and Accounting Service for Construction of Structures and Facilities -- Electronic and Communications Facilities. Signed on 2004-02-13. Completion date: 2003-09-30.
RELIANCE ELECTRIC INDUSTRIAL C (1 ALLEN BRADLEY DR in CLEVELAND, OH) : $1,858,238 in 4 contractsin 2000
$614,858 with Navy for ADP Components. Signed on 2000-06-20. Completion date: 2000-11-08.
$614,857, same as above.Signed on 2000-01-10. Completion date: 2000-03-10.
$588,773, same as above.Signed on 2000-01-10. Completion date: 2000-03-10.
$39,750, same as above.Signed on 2000-01-10. Completion date: 2000-01-31.
MARCONI COMMUNICATIONS INC (5900 LANDERBROOK DR, SUITE in CLEVELAND, PA) : $162,244 in 15 contractsfrom 2001 to 2005
Contracts for Telephone and Telegraph Equipment, Maintenance, Repair and Rebuilding of Equipment -- Instruments and Laboratory Equipment, Electrical and Electronic Properties Measuring and Testing Instruments, Electrical Control Equipment, and moreby Army, Navy, Air Force, NASA, and others Signed by year:2000: $0; 2001: $31,486; 2002: $41,458; 2003: $56,274; 2004: $11,103; 2005: $21,923; 2006: $0.
Biggest contracts:
$43,050 with Army for Telephone and Telegraph Equipment. Taking place in MI. Signed on 2003-03-28. Completion date: 2003-04-15.
$41,458 with Navy for Maintenance, Repair and Rebuilding of Equipment -- Instruments and Laboratory Equipment. Taking place in CA. Signed on 2002-04-26. Completion date: 2003-05-01.
$26,889 with Air Force for Electrical and Electronic Properties Measuring and Testing Instruments. Taking place in CO. Signed on 2001-06-08. Completion date: 2001-07-19.
$16,595 with NASA for Electrical Control Equipment. Signed on 2005-06-27. Effective on 2005-06-24. Completion date: 2005-08-05.
IRVING BELL, ESQ (5171 MAYFIELD RD in CLEVELAND, OH; small business) : $24,600 in 13 contractsfrom 2001 to 2005
Contracts for Other Professional Services, Other Administrative Support Services by Army Signed by year:2000: $0; 2001: $2,400; 2002: $9,500; 2003: $7,200; 2004: $7,900; 2005: -$2,400; 2006: $0.
Biggest contracts:
$2,500 with Army for Other Professional Services. Taking place in CA. Signed on 2004-06-07. Completion date: 2004-07-07.
$2,500 with Army for Other Professional Services. Signed on 2004-04-30. Completion date: 2004-06-30.
$2,400 with Army for Other Professional Services. Taking place in MO. Signed on 2003-09-11. Completion date: 2003-11-03.
$2,400 with Army for Other Professional Services. Taking place in MT. Signed on 2003-07-08. Completion date: 2003-09-12.
EUGENE SEVIN (1782 KENTON CIRCLE in LYNDHURST, OH; small business)
$5,000 with U.S. Army Corps of Engineers - civil program financing only for Environmental Studies and Assessments. Signed on 2002-12-10. Completion date: 2003-02-27.
ASTRO-TEX REFINING CO INC (28626 EDGEDALE RD in CLEVELAND, OH; small business)
$2,845 with Air Force for Chemicals. Signed on 2005-04-05. Completion date: 2005-04-15.
AAA COMMERCIAL PRODUCTS (5815 LANDER BROOK DR in CLEVELAND, OH; small business)
-$360 with Navy for Kitchen Equipment and Appliances. Signed on 2005-05-31. Completion date: 2004-10-12.
Top industries in this zip code by the number of employees in 2005:
2002 - 2018 National Fire Incident Reporting System (NFIRS) incidents
Based on the data from the years 2002 - 2018 the average number of fire incidents per year is 123. The highest number of reported fires - 203 took place in 2012, and the least - 83 in 2010. The data has a dropping trend.
When looking into fire subcategories, the most reports belonged to: Structure Fires (53.7%), and Outside Fires (23.4%).
Fire incident types reported to NFIRS in Zip Code 44124


 Nearest zip codes: 44122, 44143, 44040, 44121, 44022, 44118.
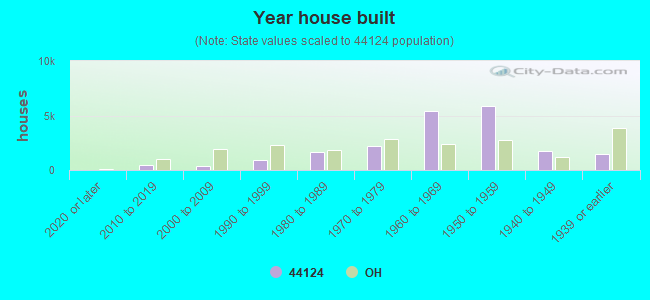


 Based on the data from the years 2002 - 2018 the average number of fire incidents per year is 123. The highest number of reported fires - 203 took place in 2012, and the least - 83 in 2010. The data has a dropping trend.
 When looking into fire subcategories, the most reports belonged to: Structure Fires (53.7%), and Outside Fires (23.4%).