Estimated zip code population in 2022: 36,464 Zip code population in 2010: 34,057 Zip code population in 2000: 34,883
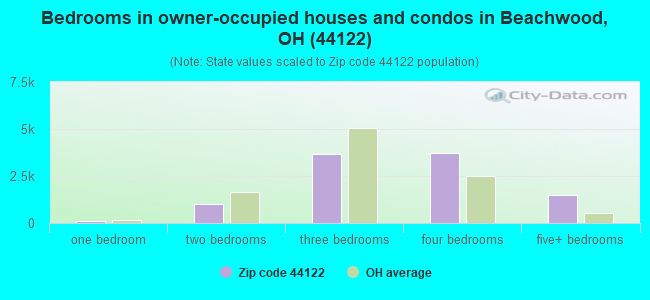
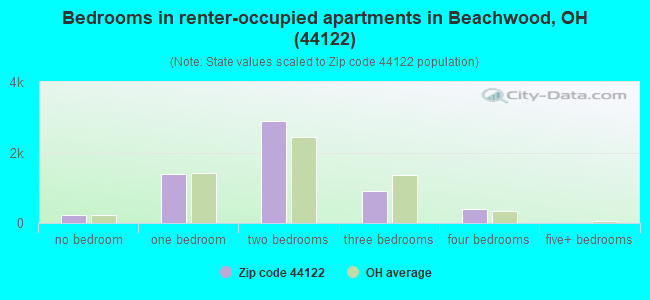
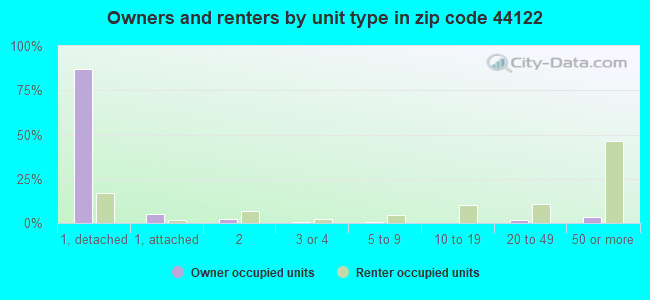
Houses and condos: 17,388 Renter-occupied apartments: 5,823
% of renters here:
37%
State:
33%
March 2022 cost of living index in zip code 44122: 97.5 (near average, U.S. average is 100)
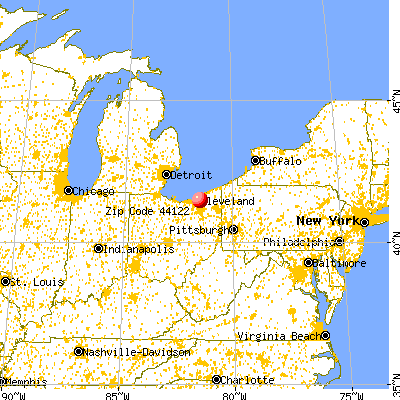
Land area: 13.2 sq. mi. Water area: 0.0 sq. mi.
Population density: 2,766 people per square mile
(average).
OSM Map
General Map
Google Map
MSN Map
OSM Map
General Map
Google Map
MSN Map
OSM Map
General Map
Google Map
MSN Map
OSM Map
General Map
Google Map
MSN Map
Please wait while loading the map...
Real estate property taxes paid for housing units in 2022:
This zip code:
2.1% ($6,848)
Ohio:
1.3% ($2,639)
Median real estate property taxes paid for housing units with mortgages in 2022: $7,212 (2.0%) Median real estate property taxes paid for housing units with no mortgage in 2022: $6,256 (2.3%)
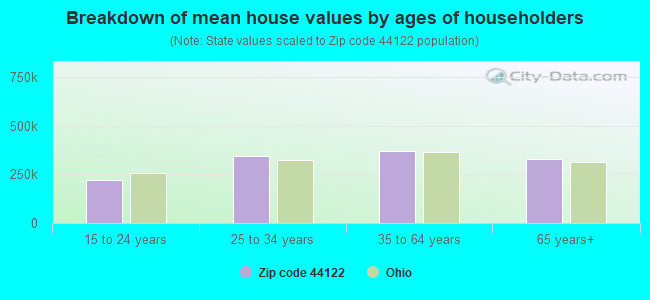
Estimated median house/condo value in 2022: $333,263
44122:
$333,263
Ohio:
$204,100
According to our research of Ohio and other state lists, there were 14 registered sex offenders living in 44122 zip code as of April 27, 2024. The ratio of all residents to sex offenders in zip code 44122 is 2,467 to 1. The ratio of registered sex offenders to all residents in this zip code is much lower than the state average.
Median resident age:
This zip code:
46.2 years
Ohio median age:
39.9 years
Average household size:
This zip code:
2.3 people
Ohio:
2.4 people
Averages for the 2020 tax year for zip code 44122, filed in 2021:
Average Adjusted Gross Income (AGI) in 2020: $143,565 (Individual Income Tax Returns)
Here:
$143,565
State:
$67,288
Salary/wage: $104,082 (reported on 75.4% of returns)
Here:
$104,082
State:
$55,628
(% of AGI for various income ranges: 1110.8% for AGIs below $25k, 3573.5% for AGIs $25k-50k, 6615.1% for AGIs $50k-75k, 10165.3% for AGIs $75k-100k, 20780.2% for AGIs $100k-200k, 119882.3% for AGIs over 200k)
Taxable interest for individuals: $4,720 (reported on 40.9% of returns)
This zip code:
$4,720
Ohio:
$1,518
(% of AGI for various income ranges: 27.8% for AGIs below $25k, 37.9% for AGIs $25k-50k, 82.8% for AGIs $50k-75k, 124.8% for AGIs $75k-100k, 362.3% for AGIs $100k-200k, 3745.3% for AGIs over 200k)
Ordinary dividends: $19,093 (reported on 38.6% of returns)
Here:
$19,093
State:
$7,167
(% of AGI for various income ranges: 92.2% for AGIs below $25k, 121.6% for AGIs $25k-50k, 295.6% for AGIs $50k-75k, 540.8% for AGIs $75k-100k, 1515.9% for AGIs $100k-200k, 14160.2% for AGIs over 200k)
Net capital gain/loss in AGI: +$41,290 (reported on 35.8% of returns)
Here:
+$41,290
State:
+$18,919
(% of AGI for various income ranges: 43.0% for AGIs below $25k, 87.7% for AGIs $25k-50k, 239.8% for AGIs $50k-75k, 456.9% for AGIs $75k-100k, 1429.1% for AGIs $100k-200k, 34252.3% for AGIs over 200k)
Profit/loss from business: +$26,672 (reported on 21.0% of returns)
Here:
+$26,672
State:
+$13,744
(% of AGI for various income ranges: 79.2% for AGIs below $25k, 119.6% for AGIs $25k-50k, 285.8% for AGIs $50k-75k, 484.5% for AGIs $75k-100k, 1442.8% for AGIs $100k-200k, 9792.1% for AGIs over 200k)
Taxable individual retirement arrangement distribution: $33,922 (reported on 13.4% of returns)
44122:
$33,922
Ohio:
$18,876
(% of AGI for various income ranges: 78.5% for AGIs below $25k, 148.1% for AGIs $25k-50k, 365.9% for AGIs $50k-75k, 771.7% for AGIs $75k-100k, 1653.0% for AGIs $100k-200k, 5990.2% for AGIs over 200k)
Self-employed (Keogh) retirement plans: $30,060 (reported on 2.6% of returns)
44122:
$30,060
Ohio:
$24,898
(% of AGI for various income ranges: 21.4% for AGIs $50k-75k, 132.4% for AGIs $100k-200k, 1742.0% for AGIs over 200k)
Total itemized deductions: $52,324 (reported on 15.1% of returns)
Here:
$52,324
State:
$33,869
(% of AGI for various income ranges: 105.7% for AGIs below $25k, 203.2% for AGIs $25k-50k, 543.6% for AGIs $50k-75k, 890.2% for AGIs $75k-100k, 1531.5% for AGIs $100k-200k, 14216.7% for AGIs over 200k)
Charity contributions: $29,203 (reported on 13.4% of returns)
Here:
$29,203
State:
$14,577
(% of AGI for various income ranges: 7.2% for AGIs below $25k, 22.6% for AGIs $25k-50k, 100.3% for AGIs $50k-75k, 172.8% for AGIs $75k-100k, 392.6% for AGIs $100k-200k, 8903.0% for AGIs over 200k)
Taxes paid: $8,458 (reported on 14.9% of returns)
44122:
$8,458
State:
$7,681
(% of AGI for various income ranges: 17.0% for AGIs below $25k, 41.1% for AGIs $25k-50k, 126.2% for AGIs $50k-75k, 244.6% for AGIs $75k-100k, 404.4% for AGIs $100k-200k, 1712.6% for AGIs over 200k)
Earned income credit: $2,116 (reported on 9.6% of returns)
Here:
$2,116
State:
$2,304
(% of AGI for various income ranges: 78.3% for AGIs below $25k, 55.3% for AGIs $25k-50k, 0.9% for AGIs $50k-75k)
Percentage of individuals using paid preparers for their 2020 taxes: 92.0%
Here:
92%
State:
94%
(% for various income ranges: 90.5% for AGIs below $25k, 91.8% for AGIs $25k-50k, 91.5% for AGIs $50k-75k, 90.9% for AGIs $75k-100k, 92.4% for AGIs $100k-200k, 95.2% for AGIs over 200k)
Averages for the 2012 tax year for zip code 44122, filed in 2013:
Average Adjusted Gross Income (AGI) in 2012: $132,597 (Individual Income Tax Returns)
Here:
$132,597
State:
$54,926
Salary/wage: $84,748 (reported on 75.9% of returns)
Here:
$84,748
State:
$45,869
(% of AGI for various income ranges: 66.6% for AGIs below $25k, 68.5% for AGIs $25k-50k, 64.6% for AGIs $50k-75k, 63.1% for AGIs $75k-100k, 66.1% for AGIs $100k-200k, 39.1% for AGIs over 200k)
Taxable interest for individuals: $5,150 (reported on 47.0% of returns)
This zip code:
$5,150
Ohio:
$1,297
(% of AGI for various income ranges: 3.3% for AGIs below $25k, 1.3% for AGIs $25k-50k, 1.6% for AGIs $50k-75k, 1.4% for AGIs $75k-100k, 1.4% for AGIs $100k-200k, 2.0% for AGIs over 200k)
Ordinary dividends: $19,980 (reported on 40.0% of returns)
Here:
$19,980
State:
$5,821
(% of AGI for various income ranges: 5.6% for AGIs below $25k, 3.2% for AGIs $25k-50k, 4.0% for AGIs $50k-75k, 4.0% for AGIs $75k-100k, 4.1% for AGIs $100k-200k, 7.1% for AGIs over 200k)
Net capital gain/loss in AGI: +$35,979 (reported on 34.6% of returns)
Here:
+$35,979
State:
+$11,232
(% of AGI for various income ranges: 5.8% for AGIs below $25k, 0.6% for AGIs $25k-50k, 0.5% for AGIs $50k-75k, 2.0% for AGIs $75k-100k, 1.8% for AGIs $100k-200k, 13.6% for AGIs over 200k)
Profit/loss from business: +$31,210 (reported on 19.2% of returns)
Here:
+$31,210
State:
+$12,773
(% of AGI for various income ranges: 7.7% for AGIs below $25k, 3.4% for AGIs $25k-50k, 2.9% for AGIs $50k-75k, 3.7% for AGIs $75k-100k, 4.9% for AGIs $100k-200k, 4.6% for AGIs over 200k)
Taxable individual retirement arrangement distribution: $30,472 (reported on 16.6% of returns)
44122:
$30,472
Ohio:
$14,511
(% of AGI for various income ranges: 5.0% for AGIs below $25k, 4.0% for AGIs $25k-50k, 4.4% for AGIs $50k-75k, 4.9% for AGIs $75k-100k, 5.4% for AGIs $100k-200k, 3.2% for AGIs over 200k)
Self-employment retirement plans: $28,296 (reported on 2.9% of returns)
44122:
$28,296
Ohio:
$20,257
(% of AGI for various income ranges: 0.3% for AGIs $25k-50k, 0.2% for AGIs $75k-100k, 0.6% for AGIs $100k-200k, 0.8% for AGIs over 200k)
Total itemized deductions: $40,314 (17% of AGI, reported on 48.9% of returns)
Here:
$40,314
State:
$21,278
Here:
16.9% of AGI
State:
18.8% of AGI
(% of AGI for various income ranges: 16.8% for AGIs below $25k, 13.5% for AGIs $25k-50k, 16.8% for AGIs $50k-75k, 17.6% for AGIs $75k-100k, 18.4% for AGIs $100k-200k, 13.6% for AGIs over 200k)
Charity contributions: $10,459 (reported on 43.3% of returns)
Here:
$10,459
State:
$3,943
(% of AGI for various income ranges: 1.3% for AGIs below $25k, 1.8% for AGIs $25k-50k, 2.4% for AGIs $50k-75k, 2.4% for AGIs $75k-100k, 2.6% for AGIs $100k-200k, 4.0% for AGIs over 200k)
Taxes paid: $20,160 (reported on 48.7% of returns)
44122:
$20,160
State:
$9,568
(% of AGI for various income ranges: 4.3% for AGIs below $25k, 5.2% for AGIs $25k-50k, 7.0% for AGIs $50k-75k, 7.9% for AGIs $75k-100k, 9.6% for AGIs $100k-200k, 7.2% for AGIs over 200k)
Earned income credit: $2,157 (reported on 10.6% of returns)
Here:
$2,157
State:
$2,285
(% of AGI for various income ranges: 5.3% for AGIs below $25k, 0.6% for AGIs $25k-50k)
Percentage of individuals using paid preparers for their 2012 taxes: 60.6%
Here:
61%
State:
51%
(% for various income ranges: 54.2% for AGIs below $25k, 51.8% for AGIs $25k-50k, 60.6% for AGIs $50k-75k, 64.4% for AGIs $75k-100k, 65.5% for AGIs $100k-200k, 80.9% for AGIs over 200k)
Averages for the 2004 tax year for zip code 44122, filed in 2005:
Average Adjusted Gross Income (AGI) in 2004: $98,868 (Individual Income Tax Returns)
Here:
$98,868
State:
$44,480
Salary/wage: $75,480 (reported on 73.4% of returns)
Here:
$75,480
State:
$39,198
(% of AGI for various income ranges: 61.4% for AGIs $10k-25k, 67.5% for AGIs $25k-50k, 62.5% for AGIs $50k-75k, 65.1% for AGIs $75k-100k, 51.5% for AGIs over 100k)
Taxable interest for individuals: $5,749 (reported on 62.8% of returns)
This zip code:
$5,749
Ohio:
$1,532
(% of AGI for various income ranges: 6.3% for AGIs $10k-25k, 3.7% for AGIs $25k-50k, 3.7% for AGIs $50k-75k, 2.9% for AGIs $75k-100k, 3.4% for AGIs over 100k)
Taxable dividends: $11,332 (reported on 49.2% of returns)
Here:
$11,332
State:
$3,496
(% of AGI for various income ranges: 5.2% for AGIs $10k-25k, 3.6% for AGIs $25k-50k, 4.3% for AGIs $50k-75k, 4.3% for AGIs $75k-100k, 5.9% for AGIs over 100k)
Net capital gain/loss: +$28,214 (reported on 42.6% of returns)
Here:
+$28,214
State:
+$8,582
(% of AGI for various income ranges: 1.3% for AGIs $10k-25k, 0.8% for AGIs $25k-50k, 2.3% for AGIs $50k-75k, 1.7% for AGIs $75k-100k, 15.5% for AGIs over 100k)
Profit/loss from business: +$24,230 (reported on 17.9% of returns)
Here:
+$24,230
State:
+$10,813
(% of AGI for various income ranges: 5.3% for AGIs $10k-25k, 2.8% for AGIs $25k-50k, 4.1% for AGIs $50k-75k, 4.8% for AGIs $75k-100k, 4.4% for AGIs over 100k)
IRA payment deduction: $3,353 (reported on 2.5% of returns)
44122:
$3,353
Ohio:
$2,794
(% of AGI for various income ranges: 0.2% for AGIs $10k-25k, 0.2% for AGIs $25k-50k, 0.2% for AGIs $50k-75k, 0.2% for AGIs $75k-100k, 0.0% for AGIs over 100k)
Self-employed pension: $21,269 (reported on 3.7% of returns)
Here:
$21,269
Ohio:
$13,981
(% of AGI for various income ranges: 0.1% for AGIs $25k-50k, 0.3% for AGIs $50k-75k, 0.4% for AGIs $75k-100k, 1.0% for AGIs over 100k)
Total itemized deductions: $34,328 (20% of AGI, reported on 52.0% of returns)
Here:
$34,328
State:
$17,503
Here:
19.8% of AGI
State:
20.8% of AGI
(% of AGI for various income ranges: 20.4% for AGIs $10k-25k, 17.3% for AGIs $25k-50k, 22.2% for AGIs $50k-75k, 21.5% for AGIs $75k-100k, 16.8% for AGIs over 100k)
Charity contributions deductions: $8,846 (5% of AGI, reported on 47.9% of returns)
Here:
$8,846
State:
$3,087
Here:
4.8% of AGI
State:
3.4% of AGI
(% of AGI for various income ranges: 2.1% for AGIs $10k-25k, 2.7% for AGIs $25k-50k, 3.5% for AGIs $50k-75k, 3.3% for AGIs $75k-100k, 4.6% for AGIs over 100k)
Total tax: $23,706 (reported on 78.4% of returns)
44122:
$23,706
State:
$6,781
(% of AGI for various income ranges: 4.0% for AGIs $10k-25k, 7.4% for AGIs $25k-50k, 10.1% for AGIs $50k-75k, 11.3% for AGIs $75k-100k, 21.7% for AGIs over 100k)
Earned income credit: $1,682 (reported on 8.0% of returns)
Here:
$1,682
State:
$1,696
Percentage of individuals using paid preparers for their 2004 taxes: 66.2%
Here:
66%
State:
55%
(% for various income ranges: 64.1% for AGIs below $10k, 64.0% for AGIs $10k-25k, 61.1% for AGIs $25k-50k, 64.9% for AGIs $50k-75k, 63.6% for AGIs $75k-100k, 75.7% for AGIs over 100k)
Likely homosexual households (counted as self-reported same-sex unmarried-partner households)
Lesbian couples: 0.3% of all households
Gay men: 0.1% of all households
Household received Food Stamps/SNAP in the past 12 months: 1,025 Household did not receive Food Stamps/SNAP in the past 12 months: 14,688
Women who had a birth in the past 12 months: 310 (308 now married, 9 unmarried) Women who did not have a birth in the past 12 months: 7,109 (2,952 now married, 4,157 unmarried)
Housing units in zip code 44122 with a mortgage: 6,044 (956 second mortgage, 919 both second mortgage and home equity loan) Houses without a mortgage: 241
Median monthly owner costs for units with a mortgage: $2,165 Median monthly owner costs for units without a mortgage: $1,010
Residents with income below the poverty level in 2022:
This zip code:
8.3%
Whole state:
13.4%
Residents with income below 50% of the poverty level in 2022:
This zip code:
4.8%
Whole state:
7.0%
Median number of rooms in houses and condos:
Here:
7.9
State:
6.7
Median number of rooms in apartments:
Here:
4.4
State:
4.4
Notable locations in this zip code not listed on our city pages
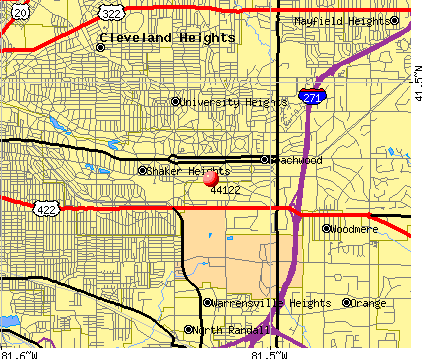
Notable locations in zip code 44122: Lyman Circle (A), Beechmont Country Club (B), Canterbury Golf Club (C), Mayfield Country Club (D), Shaker Heights Country Club (E), Acacia Country Club (F), Woodmere Fire Department (G), Highland Hills Fire Department (H), Shaker Heights Fire Department Station 2 (I), Gries Library (J), Rabbi Enoch H Kronheim Memorial Library (K), Water Tower Plaza Building (L), Villa Sancta Anna Home (M), Orangewood Place Office Building (N), Prestige Center (O), Mercantile Exchange Building North (P), Mercantile Building (Q), Gunderson Building (R), Darwood Building (S), Darling Building (T). Display/hide their locations on the map
Shopping Centers: Van Aken Shopping Center (1), Pavilion Shopping Center (2), Beechwood Place Shopping Center (3), Village Square Shopping Center (4), Eton Square Shopping Center (5). Display/hide their locations on the map
Churches in zip code 44122 include: Church of the Good Shepherd (A), Saint Dominics Catholic Church (B), Century Church (C), Congregation Shaarey Tikvah (D), Suburban Temple (E), Green Road Synagogue (F), Trinity Presbyterian Church (G). Display/hide their locations on the map
5,831 married couples with children.
1,423 single-parent households (195 men, 1,228 women).
85.2% of residents of 44122 zip code speak English at home.
4.4% of residents speak Spanish at home (77% very well, 13% well, 10% not well).
7.1% of residents speak other Indo-European language at home (71% very well, 23% well, 4% not well, 2% not at all).
2.2% of residents speak Asian or Pacific Island language at home (68% very well, 23% well, 6% not well, 3% not at all).
2.1% of residents speak other language at home (79% very well, 16% well, 5% not well).
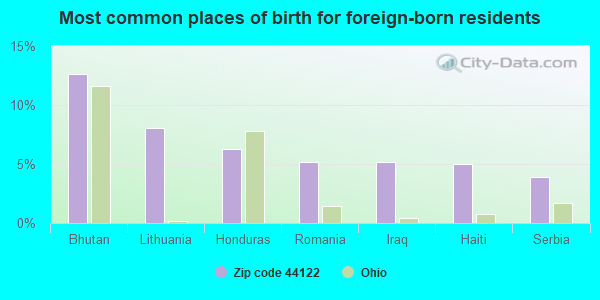
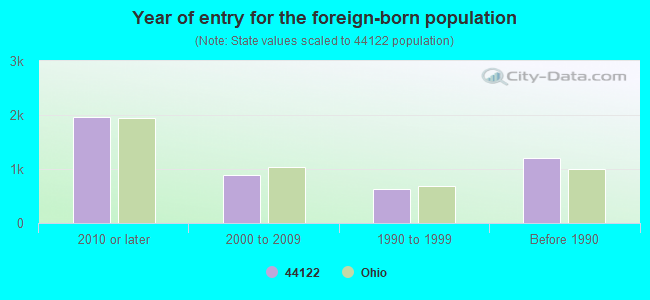
Foreign born population: 4,359 (12.0%) (58.0% of them are naturalized citizens)
Major facilities with environmental interests located in this zip code:
BEACHWOOD HIGH SCH (25100 FAIRMOUNT BLVD in BEACHWOOD, OH)
(Geographic Names Information System) (National Center for Education Statistics) - STATE ID-001842 STATE MASTER (Ohio general info) - AIR MAJOR Organizations: BEACHWOOD CITY SD (SCHOOL DISTRICT)
BCHWD SCHS MIDDLE SCH (2860 RICHMOND RD in BEACHWOOD, OH)
(National Center for Education Statistics) - STATE ID-042614 STATE MASTER (Ohio general info) - AIR MAJOR Organizations: BEACHWOOD CITY SD (SCHOOL DISTRICT)
BP AMOCO CO 22425 * (20420 CHAGRIN BOULEVARD in SHAKER HEIGHTS, OH)
AIR MINOR (AIRS/AFS) STATE MASTER (Ohio general info) - RCRA-OHD987026374, HAZARDOUS WASTE PROGRAM, AIR MAJOR, -18-5541-168-6, EPCRA Conditionally Exempt Small Quantity Generators, less than 100 kg/month of hazardous waste (Resource Conservation and Recovery Act (tracking hazardous waste)) - notification Business SIC classification: GASOLINE SERVICE STATIONS Organizations: BP OIL CO (CONTACT/OWNER)
, BP OIL COMPANY (CONTACT/OWNER)
Alternative names: BP OIL COMPANY #04931, BP OIL CO SITE 04931
AMERITECH (3445 RICHMOND RD in BEACHWOOD, OH)
STATE MASTER (Ohio general info) - -18-4811-227-26, EPCRA (Resource Conservation and Recovery Act (tracking hazardous waste)) Organizations: OHIO BELL TELEPHONE COMPANY (CONTACT/OWNER)
Alternative names: OHIO BELL TEL CO TERRANCE 831 CE OFF
ATOTECH USA INC (23800 MERCANTILE ROAD in BEACHWOOD, OH)
STATE MASTER (Ohio general info) - RCRA-OHD987041001, HAZARDOUS WASTE PROGRAM (Resource Conservation and Recovery Act (tracking hazardous waste)) Business SIC classification: TESTING LABORATORIES Organizations: ELF ATOCHEM SA (CONTACT/OWNER)
ACCUSPRAY INC (23350 MERCANTILE RD in BEACHWOOD, OH)
STATE MASTER (Ohio general info) - AIR MAJOR, RCRA-OH0000923789, HAZARDOUS WASTE PROGRAM Conditionally Exempt Small Quantity Generators, less than 100 kg/month of hazardous waste (Resource Conservation and Recovery Act (tracking hazardous waste)) - notification Organizations: KEN MARG (CONTACT/OWNER)
ADLAI STEVENSON SCHOOL (3938 JO ANN DR in CLEVELAND, OH)
STATE MASTER (Ohio general info) - AIR MAJOR, RCRA-OHD986984789, HAZARDOUS WASTE PROGRAM Small Quantity Generators, between 100 kg and 1000 kg of hazardous waste/month (Resource Conservation and Recovery Act (tracking hazardous waste)) - notification Organizations: CLEVELAND BD OF ED (CONTACT/OWNER)
Alternative names: ADLAI STEVENSON ELEMENTARY SC, ADLAI STEVENSON ELEMENTARY SCHOOL, STEVENSON ADLAI
BP OIL CO SITE 04009 * (25705 RICHMOND RD in BEACHWOOD, OH)
STATE MASTER (Ohio general info) - RCRA-OHD987026366, HAZARDOUS WASTE PROGRAM, -18-5541-905-67, EPCRA Conditionally Exempt Small Quantity Generators, less than 100 kg/month of hazardous waste (Resource Conservation and Recovery Act (tracking hazardous waste)) - notification Organizations: BP OIL COMPANY (CONTACT/OWNER)
BEACHWOOD CITY SD (24601 FAIRMOUNT BLVD in BEACHWOOD, OH)
COMPLIANCE ACTIVITY (Tracking inspections of insecticide, fungicide, and rodenticide, and toxic substances) (National Center for Education Statistics) - STATE ID-043554 Alternative names: BEACHWOOD CITY SCHOOL DIST
ALCAN CHEMICALS (3690 ORANGE PLACE in CLEVELAND, OH)
COMPLIANCE ACTIVITY (Tracking inspections of insecticide, fungicide, and rodenticide, and toxic substances)
A BEE C SERVICE INC (21012 AURORA RD in WARRENSVILLE HEIGHTS, OH)
Small Quantity Generators, between 100 kg and 1000 kg of hazardous waste/month (Resource Conservation and Recovery Act (tracking hazardous waste)) - notification Organizations: SUTTON GERALD (CONTACT/OWNER)
ANCAS CORP THE (3570 WARRENVILLE CENTER RD in CLEVELAND, OH)
TRANSPORTER (Resource Conservation and Recovery Act (tracking hazardous waste))
BEACHOOD SCHOOLS - HIGH SCHOOL (25100 FAIRMOUNT BLVD. in BEACHWOOD, OH)
AIR MINOR (AIRS/AFS) Business SIC classification: ELEMENTARY AND SECONDARY SCHOOLS
Housing units lacking complete plumbing facilities: 1.3% Housing units lacking complete kitchen facilities: 2.6%
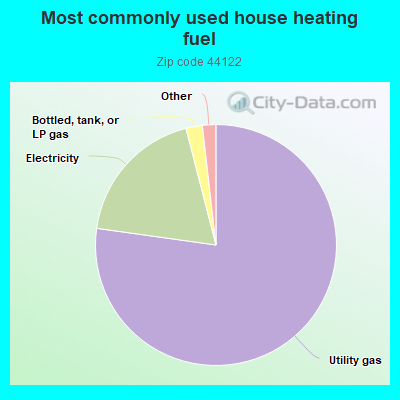
77.3%Utility gas
18.8%Electricity
2.2%Bottled, tank, or LP gas
0.9%No fuel used
0.7%Other fuel
Population in 1990: 35,115.
Place of birth for U.S.-born residents:
This state: 21,932
Northeast: 3,455
Midwest: 2,455
South: 3,184
West: 840
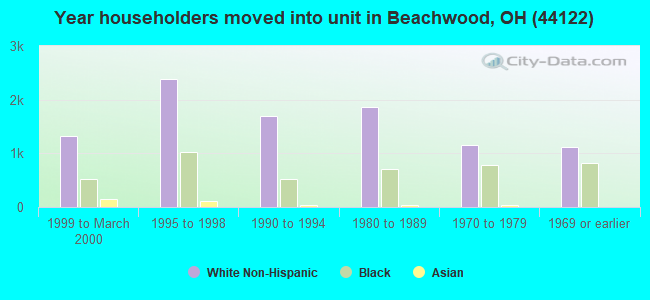
64% of the 44122 zip code residents lived in the same house 5 years ago. Out of people who lived in different houses, 73% lived in this county. Out of people who lived in different counties, 50% lived in Ohio.
86% of the 44122 zip code residents lived in the same house 1 year ago. Out of people who lived in different houses, 62% moved from this county. Out of people who lived in different houses, 8% moved from different county within same state. Out of people who lived in different houses, 13% moved from different state. Out of people who lived in different houses, 15% moved from abroad.
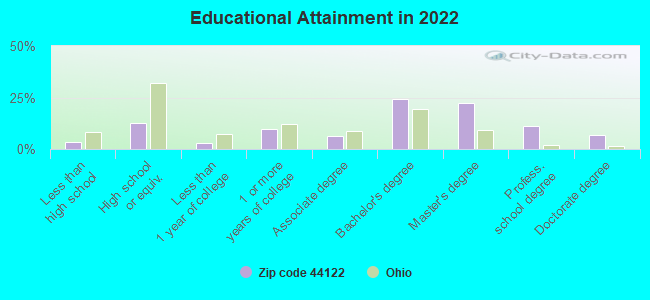
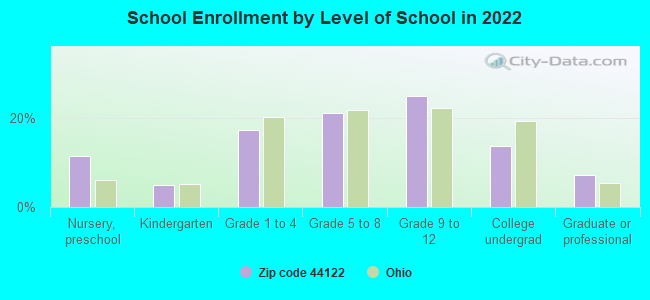
Private vs. public school enrollment:
Students in private schools in grades 1 to 8 (elementary and middle school): 1,112
Here:
35.4%
Ohio:
16.0%
Students in private schools in grades 9 to 12 (high school): 396
Here:
19.7%
Ohio:
13.1%
Students in private undergraduate colleges: 298
Here:
27.1%
Ohio:
22.3%
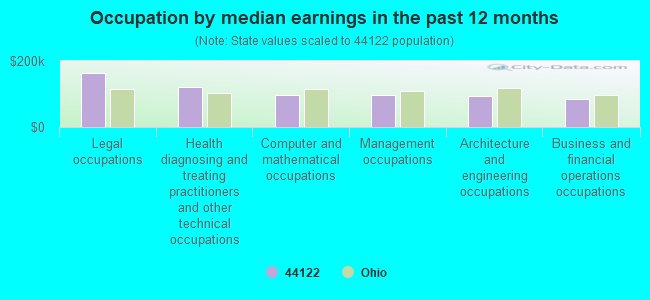
Occupation by median earnings in the past 12 months ($)
162,721Legal occupations
120,949Health diagnosing and treating practitioners and other technical occupations
96,974Computer and mathematical occupations
96,222Management occupations
93,384Architecture and engineering occupations
85,055Business and financial operations occupations
Companies with biggest federal contracts located in this zip code:
JDD, INC (22901 MILLCREEK BLVD in HIGHLAND HILLS, OH; small business) : $11,011,447 in 61 contractsfrom 2001 to 2006
Contracts for Construction of Structures and Facilities -- Maintenance Buildings, Other Housekeeping Services, Maintenance, Repair or Alteration of Real Property -- Hospitals and Infirmaries, Custodial Janitorial Services by Defense Logistics Agency, NASA, Department of Veterans Affairs, Army, and others Signed by year:2000: $0; 2001: $4,650,500; 2002: $0; 2003: $223,500; 2004: $2,617,804; 2005: $3,195,169; 2006: $324,474.
Biggest contracts:
$4,650,500 with Defense Logistics Agency for Construction of Structures and Facilities -- Maintenance Buildings. Signed on 2001-02-09. Completion date: 2001-12-08.
$2,103,302 with NASA for Other Housekeeping Services. Signed on 2005-11-15. Completion date: 2008-12-01.
$2,066,526, same as above.Signed on 2004-09-21. Completion date: 2008-01-31.
$448,353, same as above.Signed on 2005-01-20. Completion date: 2008-01-31.
PPM INC (23500 MERCANTILE RD STE I in CLEVELAND, OH; small business) : $2,989,449 in 70 contractsfrom 2000 to 2006
Contracts for Electrical and Electronic Properties Measuring and Testing Instruments, Measuring Tools, Craftsmen's, Combination and Miscellaneous Instruments, Converters, Electrical, Nonrotating, and moreby Navy, Air Force, Defense Logistics Agency, Army, and others Signed by year:2000: $71,540; 2001: $175,280; 2002: $765,735; 2003: $337,850; 2004: $338,029; 2005: $693,661; 2006: $607,354.
Biggest contracts:
$496,128 with Navy for Electrical and Electronic Properties Measuring and Testing Instruments. Signed on 2006-03-10. Completion date: 2006-06-10.
$289,591, same as above.Signed on 2002-07-30. Completion date: 2002-10-28.
$231,000, same as above.Signed on 2005-08-11. Completion date: 2005-11-11.
$210,000, same as above.Signed on 2002-04-02. Completion date: 2002-04-02.
HECKAMAN, MARIA (2952 FALMOUTH RD in SHAKER HEIGHTS, OH; small business)
$1,800,000 with Army for Collectors. and/or Historical Items. Taking place in PA. Signed on 2005-04-18. Completion date: 2005-05-31.
R O SORDS CO (24050 COMMERCE PARK ROAD in CLEVELAND, OH; small business) : $1,231,377 in 32 contractsfrom 1999 to 2006
Contracts for Converters, Electrical, Nonrotating, Waste Disposal Equipment, Pressure, Temperature, and Humidity Measuring and Controlling Instruments, Switches, and moreby Defense Logistics Agency, Army, Navy Signed by year:2000: $139,813; 2001: $490,798; 2002: $31,500; 2003: $119,132; 2004: $135,776; 2005: $148,506; 2006: $84,888.
Biggest contracts:
$138,447 with Defense Logistics Agency for Converters, Electrical, Nonrotating. Signed on 2001-11-05. Completion date: 2002-05-24.
$98,625 with Defense Logistics Agency for Waste Disposal Equipment. Signed on 2001-11-01. Completion date: 2002-01-04.
$84,888 with Army for Pressure, Temperature, and Humidity Measuring and Controlling Instruments. Signed on 2006-02-02. Completion date: 2006-07-15.
$80,964 with Defense Logistics Agency for Switches. Signed on 1999-11-03. Completion date: 2000-02-01.
BSA ENVIRONMENTAL SERVICES, IN (21403 CHAGRIN BLVD , SUITE in BEACHWOOD, OH; small business) : $973,890 in 11 contractsfrom 2002 to 2005
Contracts for Other Professional Services, Engineering and Technical Services, Water Quality Studies by Army, U.S. Army Corps of Engineers - civil program financing only Signed by year:2000: $0; 2001: $0; 2002: $16,000; 2003: $3,040; 2004: $59,592; 2005: $895,258; 2006: $0.
Biggest contracts:
$729,303 with Army for Other Professional Services. Taking place in MD. Signed on 2005-04-25. Completion date: 2007-05-31.
$89,615 with Army for Engineering and Technical Services. Taking place in MD. Signed on 2005-01-04. Completion date: 2004-11-24.
$74,833, same as above.Signed on 2005-03-08. Completion date: 2004-11-24.
$49,800, same as above.Signed on 2004-08-24. Completion date: 2004-11-24.
THINK-A-MOVE, LTD (23715 MERCANTILE RD in CLEVELAND, OH; small business) : $482,330 in 3 contractsfrom 2005 to 2006
$362,570 with Army for Defense Tank - Automotive -- Engineering Development (R&D). Signed on 2006-03-15. Completion date: 2008-03-31.
$69,866 with Army for Defense Tank - Automotive -- Operational Systems Development (R&D). Signed on 2005-01-31. Completion date: 2005-06-30.
$49,894, same as above.Signed on 2005-09-26. Completion date: 2006-10-31.
III WILLIAMS LLC (29425 CHAGRIN BLVD # 300 in CLEVELAND, OH; small business) : $458,418 in 68 contractsfrom 2003 to 2006
Contracts for Water Purification Equipment, Hardware, Commercial, Valves, Nonpowered, Engine Electrical System Components, Nonaircraft, and moreby Defense Logistics Agency, U.S. Special Operations Command Signed by year:2000: $0; 2001: $0; 2002: $0; 2003: $45,150; 2004: $68,490; 2005: $191,696; 2006: $153,082.
Biggest contracts:
$45,150 with Defense Logistics Agency for Water Purification Equipment. Signed on 2003-10-16. Completion date: 2003-11-19.
$31,028 with U.S. Special Operations Command for Hardware, Commercial. Signed on 2004-03-30. Completion date: 2004-06-30.
$25,213 with Defense Logistics Agency for Valves, Nonpowered. Signed on 2005-11-19. Completion date: 2006-03-24.
$25,213, same as above.Signed on 2006-01-04. Completion date: 2006-05-09.
MERCURY IRON & STEEL (3401 VIRGINIA RD in CLEVELAND, OH; small business) : $382,121 in 6 contractsfrom 2001 to 2004
Contracts for Chemical Analysis Instruments by Defense Logistics Agency Signed by year:2000: $0; 2001: $57,493; 2002: $38,493; 2003: $82,362; 2004: $203,773; 2005: $0; 2006: $0.
Biggest contracts:
$102,634 with Defense Logistics Agency for Chemical Analysis Instruments. Signed on 2004-07-31. Completion date: 2004-10-25.
$82,362, same as above.Signed on 2003-12-17. Completion date: 2004-03-15.
$57,493, same as above.Signed on 2001-11-20. Completion date: 2002-03-19.
$55,834, same as above.Signed on 2004-02-11. Completion date: 2004-05-10.
STEPHEN CAMPBELL & ASSOCIATES (2418 ALLEN BLVD in BEACHWOOD, OH) : $77,021 in 4 contractsfrom 2001 to 2005
$32,798 with Defense Logistics Agency for ADPE System Configuration. Signed on 2001-01-08. Completion date: 2001-01-30.
$25,209 with Air Force for Sound Recording and Reproducing Equipment. Signed on 2005-09-22. Completion date: 2005-11-06.
$13,694 with Army for Miscellaneous Items. Signed on 2004-07-15. Completion date: 2004-08-16.
$5,320 with Army for Radio and Television Communication Equipment, Except Airborne. Signed on 2005-08-12. Completion date: 2005-09-11.
ULTRAGUIDE INC (ONE CHAGRIN HIGLANDS in BEACHWOOD, CO; small business) : $73,530 in 2 contractsfrom 2000 to 2002
$39,600 with Navy for Medical and Surgical Instruments, Equipment, and Supplies. Taking place in CO. Signed on 2000-07-17. Completion date: 2000-08-04.
$33,930 with Army for Medical and Surgical Instruments, Equipment, and Supplies. Taking place in CO. Signed on 2002-03-11. Completion date: 2002-05-10.
Top industries in this zip code by the number of employees in 2005:
Health Care and Social Assistance: Nursing Care Facilities (500-999 employees: 2 establishments, 250-499 employees: 2 establishments, 100-249 employees: 6 establishments, 50-99 employees: 1 establishment, 20-49 employees: 1 establishment, 1-4 employees: 1 establishment)
Management of Companies and Enterprises: Corporate, Subsidiary, and Regional Managing Offices (500-999: 1, 250-499: 2, 100-249: 4, 50-99: 3, 20-49: 6, 10-19: 2, 5-9: 3, 1-4: 1)
2002 - 2018 National Fire Incident Reporting System (NFIRS) incidents
Based on the data from the years 2002 - 2018 the average number of fire incidents per year is 92. The highest number of reported fires - 143 took place in 2008, and the least - 61 in 2014. The data has a growing trend.
When looking into fire subcategories, the most reports belonged to: Structure Fires (53.1%), and Outside Fires (29.5%).
Fire incident types reported to NFIRS in Zip Code 44122


 Nearest zip codes: 44128, 44124, 44118, 44121, 44120, 44137.


 Based on the data from the years 2002 - 2018 the average number of fire incidents per year is 92. The highest number of reported fires - 143 took place in 2008, and the least - 61 in 2014. The data has a growing trend.
 When looking into fire subcategories, the most reports belonged to: Structure Fires (53.1%), and Outside Fires (29.5%).