Estimated zip code population in 2022: 32,583 Zip code population in 2010: 33,579 Zip code population in 2000: 35,298
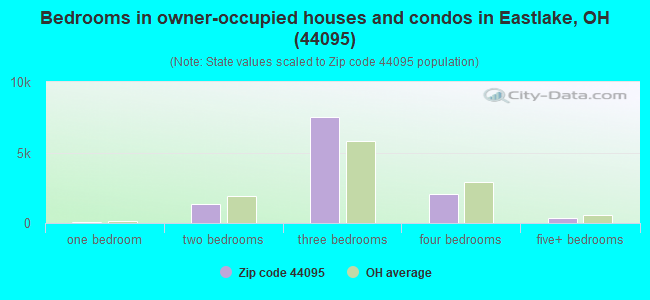
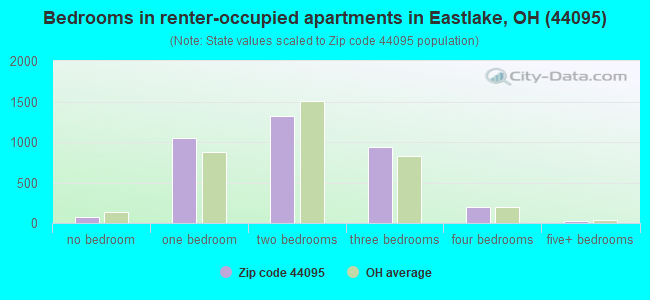
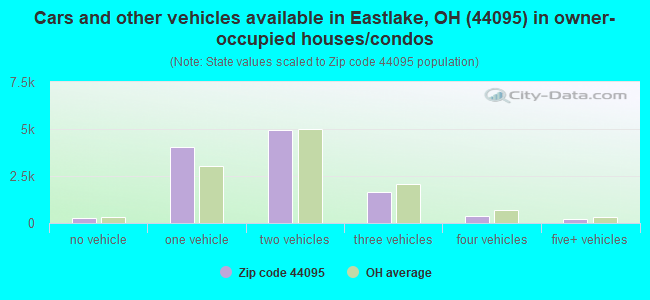
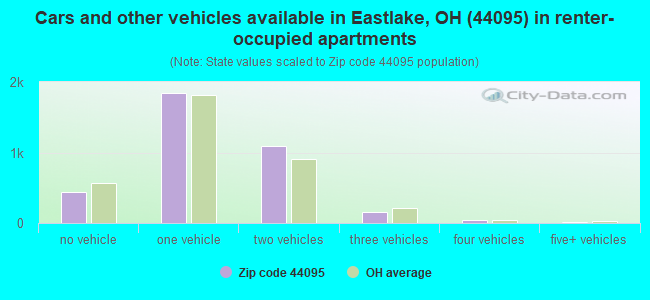
Houses and condos: 15,569 Renter-occupied apartments: 3,582
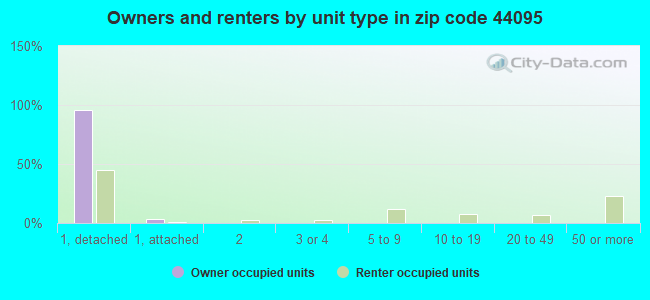
% of renters here:
24%
State:
33%
March 2022 cost of living index in zip code 44095: 93.6 (less than average, U.S. average is 100)
Land area: 9.1 sq. mi. Water area: 0.1 sq. mi.
Population density: 3,590 people per square mile
(average).
OSM Map
General Map
Google Map
MSN Map
OSM Map
General Map
Google Map
MSN Map
OSM Map
General Map
Google Map
MSN Map
OSM Map
General Map
Google Map
MSN Map
Please wait while loading the map...
Real estate property taxes paid for housing units in 2022:
This zip code:
1.7% ($2,938)
Ohio:
1.3% ($2,639)
Median real estate property taxes paid for housing units with mortgages in 2022: $3,048 (1.7%) Median real estate property taxes paid for housing units with no mortgage in 2022: $2,830 (1.8%)
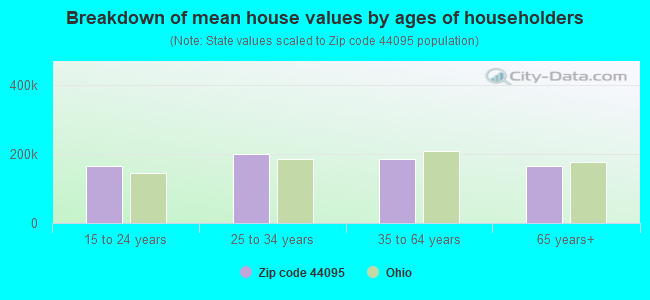
Estimated median house/condo value in 2022: $170,362
44095:
$170,362
Ohio:
$204,100
According to our research of Ohio and other state lists, there were 32 registered sex offenders living in 44095 zip code as of April 27, 2024. The ratio of all residents to sex offenders in zip code 44095 is 1,057 to 1. The ratio of registered sex offenders to all residents in this zip code is lower than the state average.
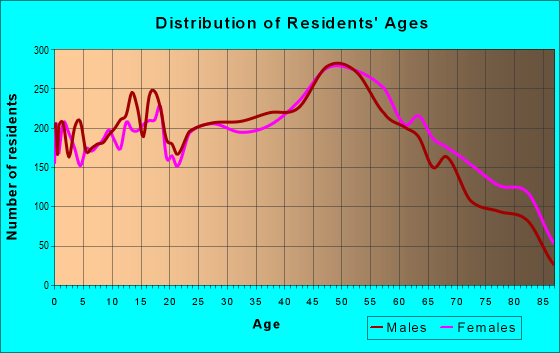
Median resident age:
This zip code:
44.5 years
Ohio median age:
39.9 years
Average household size:
This zip code:
2.2 people
Ohio:
2.4 people
Averages for the 2020 tax year for zip code 44095, filed in 2021:
Average Adjusted Gross Income (AGI) in 2020: $50,579 (Individual Income Tax Returns)
Here:
$50,579
State:
$67,288
Salary/wage: $45,601 (reported on 83.3% of returns)
Here:
$45,601
State:
$55,628
(% of AGI for various income ranges: 1136.9% for AGIs below $25k, 3733.3% for AGIs $25k-50k, 6713.0% for AGIs $50k-75k, 9736.0% for AGIs $75k-100k, 16574.1% for AGIs $100k-200k, 60286.7% for AGIs over 200k)
Taxable interest for individuals: $856 (reported on 23.1% of returns)
This zip code:
$856
Ohio:
$1,518
(% of AGI for various income ranges: 16.5% for AGIs below $25k, 13.9% for AGIs $25k-50k, 29.9% for AGIs $50k-75k, 44.7% for AGIs $75k-100k, 83.0% for AGIs $100k-200k, 391.7% for AGIs over 200k)
Ordinary dividends: $3,041 (reported on 15.7% of returns)
Here:
$3,041
State:
$7,167
(% of AGI for various income ranges: 20.3% for AGIs below $25k, 27.3% for AGIs $25k-50k, 57.5% for AGIs $50k-75k, 95.7% for AGIs $75k-100k, 231.9% for AGIs $100k-200k, 2986.7% for AGIs over 200k)
Net capital gain/loss in AGI: +$5,602 (reported on 13.0% of returns)
Here:
+$5,602
State:
+$18,919
(% of AGI for various income ranges: 11.7% for AGIs below $25k, 14.5% for AGIs $25k-50k, 71.8% for AGIs $50k-75k, 153.2% for AGIs $75k-100k, 396.6% for AGIs $100k-200k, 7551.7% for AGIs over 200k)
Profit/loss from business: +$8,283 (reported on 11.0% of returns)
Here:
+$8,283
State:
+$13,744
(% of AGI for various income ranges: 76.4% for AGIs below $25k, 83.3% for AGIs $25k-50k, 133.1% for AGIs $50k-75k, 182.3% for AGIs $75k-100k, 307.9% for AGIs $100k-200k, 2211.7% for AGIs over 200k)
Taxable individual retirement arrangement distribution: $14,968 (reported on 10.5% of returns)
44095:
$14,968
Ohio:
$18,876
(% of AGI for various income ranges: 98.2% for AGIs below $25k, 115.6% for AGIs $25k-50k, 245.0% for AGIs $50k-75k, 358.9% for AGIs $75k-100k, 683.9% for AGIs $100k-200k, 4293.3% for AGIs over 200k)
Self-employed (Keogh) retirement plans: $16,967 (reported on 0.2% of returns)
44095:
$16,967
Ohio:
$24,898
(% of AGI for various income ranges: 51.4% for AGIs $100k-200k)
Total itemized deductions: $24,738 (reported on 3.5% of returns)
Here:
$24,738
State:
$33,869
(% of AGI for various income ranges: 22.8% for AGIs below $25k, 47.4% for AGIs $25k-50k, 126.8% for AGIs $50k-75k, 217.2% for AGIs $75k-100k, 440.2% for AGIs $100k-200k, 4356.7% for AGIs over 200k)
Charity contributions: $5,002 (reported on 2.5% of returns)
Here:
$5,002
State:
$14,577
(% of AGI for various income ranges: 2.0% for AGIs below $25k, 5.3% for AGIs $25k-50k, 14.8% for AGIs $50k-75k, 35.4% for AGIs $75k-100k, 63.3% for AGIs $100k-200k, 888.3% for AGIs over 200k)
Taxes paid: $6,970 (reported on 3.5% of returns)
44095:
$6,970
State:
$7,681
(% of AGI for various income ranges: 4.6% for AGIs below $25k, 8.8% for AGIs $25k-50k, 36.9% for AGIs $50k-75k, 82.4% for AGIs $75k-100k, 152.5% for AGIs $100k-200k, 738.3% for AGIs over 200k)
Earned income credit: $2,013 (reported on 12.6% of returns)
Here:
$2,013
State:
$2,304
(% of AGI for various income ranges: 66.1% for AGIs below $25k, 44.5% for AGIs $25k-50k, 0.5% for AGIs $50k-75k)
Percentage of individuals using paid preparers for their 2020 taxes: 92.7%
Here:
93%
State:
94%
(% for various income ranges: 91.5% for AGIs below $25k, 93.9% for AGIs $25k-50k, 93.7% for AGIs $50k-75k, 91.5% for AGIs $75k-100k, 92.2% for AGIs $100k-200k, 90.0% for AGIs over 200k)
Averages for the 2012 tax year for zip code 44095, filed in 2013:
Average Adjusted Gross Income (AGI) in 2012: $43,274 (Individual Income Tax Returns)
Here:
$43,274
State:
$54,926
Salary/wage: $39,760 (reported on 84.8% of returns)
Here:
$39,760
State:
$45,869
(% of AGI for various income ranges: 70.4% for AGIs below $25k, 82.3% for AGIs $25k-50k, 82.3% for AGIs $50k-75k, 81.4% for AGIs $75k-100k, 81.4% for AGIs $100k-200k, 38.6% for AGIs over 200k)
Taxable interest for individuals: $760 (reported on 30.8% of returns)
This zip code:
$760
Ohio:
$1,297
(% of AGI for various income ranges: 1.2% for AGIs below $25k, 0.6% for AGIs $25k-50k, 0.4% for AGIs $50k-75k, 0.4% for AGIs $75k-100k, 0.4% for AGIs $100k-200k, 0.3% for AGIs over 200k)
Ordinary dividends: $2,203 (reported on 17.8% of returns)
Here:
$2,203
State:
$5,821
(% of AGI for various income ranges: 1.5% for AGIs below $25k, 0.6% for AGIs $25k-50k, 0.7% for AGIs $50k-75k, 0.7% for AGIs $75k-100k, 1.0% for AGIs $100k-200k, 2.1% for AGIs over 200k)
Net capital gain/loss in AGI: +$2,635 (reported on 11.1% of returns)
Here:
+$2,635
State:
+$11,232
(% of AGI for various income ranges: 0.1% for AGIs $25k-50k, 0.3% for AGIs $50k-75k, 0.4% for AGIs $75k-100k, 1.0% for AGIs $100k-200k, 5.9% for AGIs over 200k)
Profit/loss from business: +$8,035 (reported on 10.0% of returns)
Here:
+$8,035
State:
+$12,773
(% of AGI for various income ranges: 4.8% for AGIs below $25k, 2.0% for AGIs $25k-50k, 1.3% for AGIs $50k-75k, 1.0% for AGIs $75k-100k, 2.0% for AGIs $100k-200k)
Taxable individual retirement arrangement distribution: $10,796 (reported on 11.5% of returns)
44095:
$10,796
Ohio:
$14,511
(% of AGI for various income ranges: 5.4% for AGIs below $25k, 2.5% for AGIs $25k-50k, 2.3% for AGIs $50k-75k, 2.8% for AGIs $75k-100k, 3.1% for AGIs $100k-200k, 1.6% for AGIs over 200k)
Self-employment retirement plans: $14,925 (reported on 0.2% of returns)
44095:
$14,925
Ohio:
$20,257
(% of AGI for various income ranges: 0.2% for AGIs below $25k, 0.3% for AGIs $75k-100k)
Total itemized deductions: $15,171 (22% of AGI, reported on 30.5% of returns)
Here:
$15,171
State:
$21,278
Here:
21.9% of AGI
State:
18.8% of AGI
(% of AGI for various income ranges: 8.4% for AGIs below $25k, 8.7% for AGIs $25k-50k, 11.4% for AGIs $50k-75k, 12.3% for AGIs $75k-100k, 13.2% for AGIs $100k-200k, 9.1% for AGIs over 200k)
Charity contributions: $1,803 (reported on 22.6% of returns)
Here:
$1,803
State:
$3,943
(% of AGI for various income ranges: 0.6% for AGIs below $25k, 0.7% for AGIs $25k-50k, 0.9% for AGIs $50k-75k, 1.2% for AGIs $75k-100k, 1.4% for AGIs $100k-200k, 1.0% for AGIs over 200k)
Taxes paid: $6,333 (reported on 30.5% of returns)
44095:
$6,333
State:
$9,568
(% of AGI for various income ranges: 1.9% for AGIs below $25k, 3.1% for AGIs $25k-50k, 4.7% for AGIs $50k-75k, 5.4% for AGIs $75k-100k, 6.7% for AGIs $100k-200k, 4.9% for AGIs over 200k)
Earned income credit: $1,937 (reported on 13.3% of returns)
Here:
$1,937
State:
$2,285
(% of AGI for various income ranges: 4.0% for AGIs below $25k, 0.6% for AGIs $25k-50k)
Percentage of individuals using paid preparers for their 2012 taxes: 50.1%
Here:
50%
State:
51%
(% for various income ranges: 43.5% for AGIs below $25k, 52.3% for AGIs $25k-50k, 56.1% for AGIs $50k-75k, 55.8% for AGIs $75k-100k, 54.6% for AGIs $100k-200k, 80.0% for AGIs over 200k)
Averages for the 2004 tax year for zip code 44095, filed in 2005:
Average Adjusted Gross Income (AGI) in 2004: $36,349 (Individual Income Tax Returns)
Here:
$36,349
State:
$44,480
Salary/wage: $35,047 (reported on 86.1% of returns)
Here:
$35,047
State:
$39,198
(% of AGI for various income ranges: 81.6% for AGIs below $10k, 71.0% for AGIs $10k-25k, 85.2% for AGIs $25k-50k, 86.3% for AGIs $50k-75k, 87.3% for AGIs $75k-100k, 76.1% for AGIs over 100k)
Taxable interest for individuals: $1,039 (reported on 47.9% of returns)
This zip code:
$1,039
Ohio:
$1,532
(% of AGI for various income ranges: 4.5% for AGIs below $10k, 3.0% for AGIs $10k-25k, 1.2% for AGIs $25k-50k, 0.9% for AGIs $50k-75k, 0.8% for AGIs $75k-100k, 1.3% for AGIs over 100k)
Taxable dividends: $1,339 (reported on 22.8% of returns)
Here:
$1,339
State:
$3,496
(% of AGI for various income ranges: 2.7% for AGIs below $10k, 1.3% for AGIs $10k-25k, 0.5% for AGIs $25k-50k, 0.6% for AGIs $50k-75k, 0.6% for AGIs $75k-100k, 1.6% for AGIs over 100k)
Net capital gain/loss: +$2,307 (reported on 14.8% of returns)
Here:
+$2,307
State:
+$8,582
(% of AGI for various income ranges: -1.9% for AGIs below $10k, 0.3% for AGIs $10k-25k, 0.4% for AGIs $25k-50k, 0.7% for AGIs $50k-75k, 1.2% for AGIs $75k-100k, 3.7% for AGIs over 100k)
Profit/loss from business: +$6,596 (reported on 9.5% of returns)
Here:
+$6,596
State:
+$10,813
(% of AGI for various income ranges: 5.2% for AGIs below $10k, 3.1% for AGIs $10k-25k, 1.5% for AGIs $25k-50k, 1.3% for AGIs $50k-75k, 1.3% for AGIs $75k-100k, 1.8% for AGIs over 100k)
IRA payment deduction: $2,555 (reported on 2.4% of returns)
44095:
$2,555
Ohio:
$2,794
(% of AGI for various income ranges: 0.2% for AGIs below $10k, 0.2% for AGIs $10k-25k, 0.2% for AGIs $25k-50k, 0.1% for AGIs $50k-75k, 0.1% for AGIs $75k-100k, 0.1% for AGIs over 100k)
Self-employed pension: $5,886 (reported on 0.2% of returns)
Here:
$5,886
Ohio:
$13,981
(% of AGI for various income ranges: 0.0% for AGIs $10k-25k, 0.0% for AGIs $50k-75k, 0.1% for AGIs $75k-100k)
Total itemized deductions: $13,100 (23% of AGI, reported on 37.8% of returns)
Here:
$13,100
State:
$17,503
Here:
23.3% of AGI
State:
20.8% of AGI
(% of AGI for various income ranges: 8.8% for AGIs below $10k, 9.7% for AGIs $10k-25k, 13.0% for AGIs $25k-50k, 15.5% for AGIs $50k-75k, 15.4% for AGIs $75k-100k, 13.4% for AGIs over 100k)
Charity contributions deductions: $1,450 (2% of AGI, reported on 30.9% of returns)
Here:
$1,450
State:
$3,087
Here:
2.4% of AGI
State:
3.4% of AGI
(% of AGI for various income ranges: 0.4% for AGIs below $10k, 0.7% for AGIs $10k-25k, 1.0% for AGIs $25k-50k, 1.4% for AGIs $50k-75k, 1.5% for AGIs $75k-100k, 1.8% for AGIs over 100k)
Total tax: $4,038 (reported on 79.4% of returns)
44095:
$4,038
State:
$6,781
(% of AGI for various income ranges: 2.0% for AGIs below $10k, 4.5% for AGIs $10k-25k, 7.5% for AGIs $25k-50k, 8.7% for AGIs $50k-75k, 10.0% for AGIs $75k-100k, 16.5% for AGIs over 100k)
Earned income credit: $1,428 (reported on 9.1% of returns)
Here:
$1,428
State:
$1,696
Percentage of individuals using paid preparers for their 2004 taxes: 50.4%
Here:
50%
State:
55%
(% for various income ranges: 39.3% for AGIs below $10k, 51.7% for AGIs $10k-25k, 54.2% for AGIs $25k-50k, 52.8% for AGIs $50k-75k, 51.4% for AGIs $75k-100k, 53.4% for AGIs over 100k)
Likely homosexual households (counted as self-reported same-sex unmarried-partner households)
Lesbian couples: 0.3% of all households
Gay men: 0.0% of all households
Household received Food Stamps/SNAP in the past 12 months: 1,221 Household did not receive Food Stamps/SNAP in the past 12 months: 13,702
Women who had a birth in the past 12 months: 263 (189 now married, 74 unmarried) Women who did not have a birth in the past 12 months: 6,855 (2,467 now married, 4,389 unmarried)
Housing units in zip code 44095 with a mortgage: 7,074 (637 second mortgage, 541 both second mortgage and home equity loan) Houses without a mortgage: 675
Median monthly owner costs for units with a mortgage: $1,256 Median monthly owner costs for units without a mortgage: $526
Residents with income below the poverty level in 2022:
This zip code:
6.8%
Whole state:
13.4%
Residents with income below 50% of the poverty level in 2022:
This zip code:
3.8%
Whole state:
7.0%
Median number of rooms in houses and condos:
Here:
6.3
State:
6.7
Median number of rooms in apartments:
Here:
4.5
State:
4.4
Notable locations in this zip code not listed on our city pages
Notable locations in zip code 44095: Chargin Lagoons Yacht Club (A), Chargin River Yacht Club (B), Chargin Boat Club (C), West Channel Yacht Club (D), Lakeshore Marina (E), Chagrin Lagoons Yacht Club (F), Chagrin Harbor Beach Yacht Club (G), Lake County Yacht Club (H), Chagrin Boating Club (I), Chagrin River Yacht Club (J), Eastlake Fire Department (K), Willowick Fire Department (L), Timberlake Village Hall (M), Lakeline Village Hall (N), Eastlake City Hall (O). Display/hide their locations on the map
Shopping Centers: Shoregate Shopping Center (1), North Shore Mall Shopping Center (2), The Vineyards Shopping Center (3). Display/hide their locations on the map
Churches in zip code 44095 include: Erieside Church (A), Bethel Lutheran Church (B), First Baptist Church of Willowick (C), First United Church of Christ (D), Willo-Lake Church of the Nazarene (E), Shoregate United Methodist Church (F). Display/hide their locations on the map
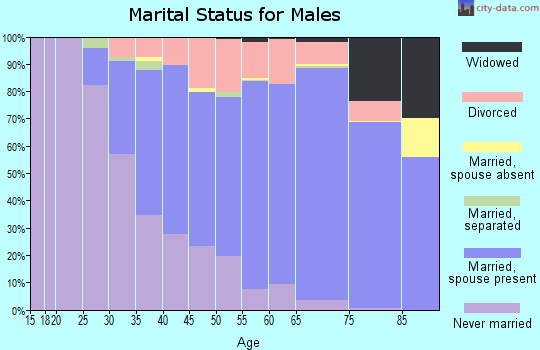
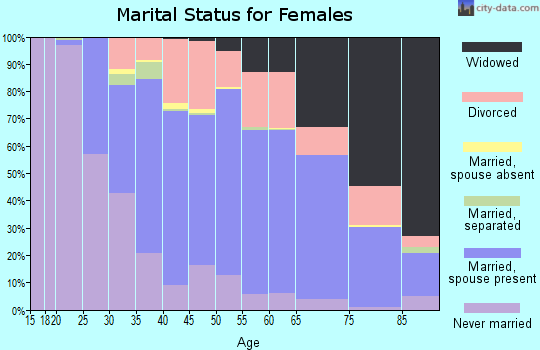
3,533 married couples with children.
1,485 single-parent households (365 men, 1,120 women).
93.5% of residents of 44095 zip code speak English at home.
1.5% of residents speak Spanish at home (81% very well, 15% well, 4% not well).
5.1% of residents speak other Indo-European language at home (67% very well, 18% well, 11% not well, 4% not at all).
0.1% of residents speak Asian or Pacific Island language at home (21% very well, 39% well, 39% not well).
0.1% of residents speak other language at home (100% very well).
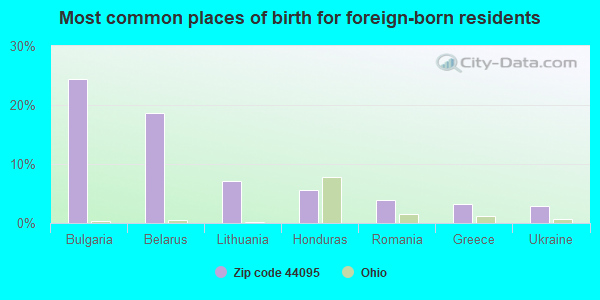
Foreign born population: 1,202 (3.7%) (85.8% of them are naturalized citizens)
This zip code:
3.7%
Whole state:
5.0%
24%Bulgaria
19%Belarus
7%Lithuania
6%Honduras
4%Romania
3%Greece
3%Ukraine
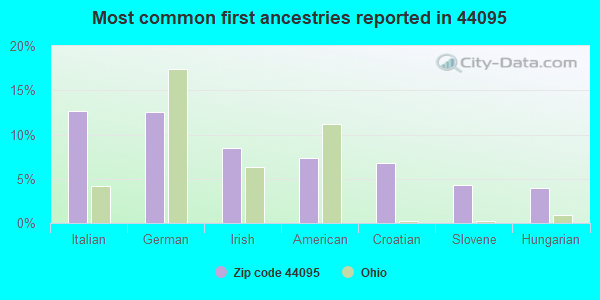
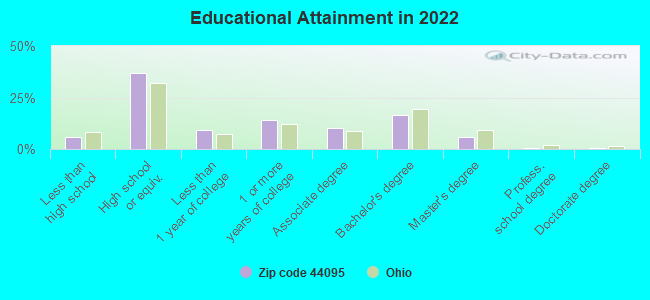
13%Italian
13%German
8%Irish
7%American
7%Croatian
4%Slovene
4%Hungarian
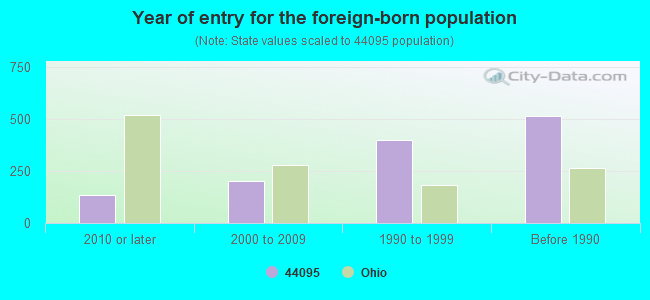
Year of entry for the foreign-born population
1332010 or later
2012000 to 2009
3971990 to 1999
514Before 1990
Facilities with environmental interests located in this zip code:
BP OIL CO SITE 04687 (35068 VINE ST in EASTLAKE, OH)
AIR MINOR (AIRS/AFS) STATE MASTER (Ohio general info) - RCRA-OHD987025947, HAZARDOUS WASTE PROGRAM, AIR MAJOR, -43-5541-168-3, EPCRA Conditionally Exempt Small Quantity Generators, less than 100 kg/month of hazardous waste (Resource Conservation and Recovery Act (tracking hazardous waste)) - notification Business SIC classification: GASOLINE SERVICE STATIONS Organizations: BP OIL COMPANY (CONTACT/OWNER)
Alternative names: BP OIL COMPANY #4687, BP PRODUCTS NORTH AMERICA #22384/04687
ASTRO MODEL DEVELOPMENT (35280 LAKELAND BLVD in EASTLAKE, OH)
STATE MASTER (Ohio general info) - AIR MAJOR, RCRA-OHD086656717, HAZARDOUS WASTE PROGRAM Small Quantity Generators, between 100 kg and 1000 kg of hazardous waste/month (Resource Conservation and Recovery Act (tracking hazardous waste)) - notification Organizations: WATTS MYRON (CONTACT/OWNER)
ASTRO MODEL DEVELOPMENT (34459 CURTIS BLVD in EASTLAKE, OH)
AIR MAJOR (AIRS/AFS) STATE MASTER (Ohio general info) - RCRA-OHR000026120, HAZARDOUS WASTE PROGRAM Small Quantity Generators, between 100 kg and 1000 kg of hazardous waste/month (Resource Conservation and Recovery Act (tracking hazardous waste)) - notification Business SIC classification: MACHINE TOOLS, METAL CUTTING TYPES Organizations: DAVID E CLUCAS (CONTACT/OWNER)
AIR TOOL SERVICE CO (1440 E 357TH ST in EASTLAKE, OH)
STATE MASTER (Ohio general info) - AIR MAJOR Small Quantity Generators, between 100 kg and 1000 kg of hazardous waste/month (Resource Conservation and Recovery Act (tracking hazardous waste)) - notification
AERO WELDING INC (34820 LAKELAND BLVD. in EASTLAKE, OH)
(Resource Conservation and Recovery Act (tracking hazardous waste)) TRI REPORTER (Tracking of toxic chemicals releasing facilities) Business SIC classification: FABRICATED PLATE WORK (BOILER SHOPS) Organizations: DICK & DELORES ZAFERATOS -PROPERTY (CONTACT/OWNER)
AIR NUCLEAR INDUSTRIES, INC (34820 LAKELAND BLVD SUITE B in EASTLAKE, OH)
(Resource Conservation and Recovery Act (tracking hazardous waste)) Organizations: AIR NUCLEAR INDUSTRIES INC (CONTACT/OWNER)
, MR & MRS DICK ZAFERATOS (CONTACT/OWNER)
BP OIL CO (35760 LAKESHORE BLVD in EASTLAKE, OH)
(Resource Conservation and Recovery Act (tracking hazardous waste))
Housing units lacking complete plumbing facilities: 0.3% Housing units lacking complete kitchen facilities: 0.7%
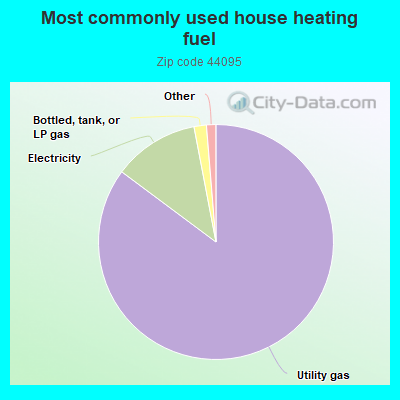
85.1%Utility gas
11.8%Electricity
1.7%Bottled, tank, or LP gas
0.6%No fuel used
0.5%Other fuel
Population in 1990: 37,473.
Place of birth for U.S.-born residents:
This state: 27,441
Northeast: 1,837
Midwest: 616
South: 951
West: 428
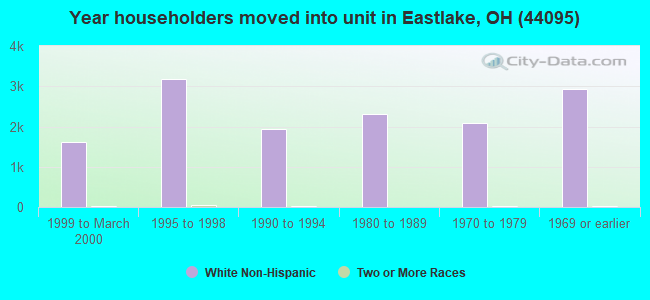
69% of the 44095 zip code residents lived in the same house 5 years ago. Out of people who lived in different houses, 61% lived in this county. Out of people who lived in different counties, 50% lived in Ohio.
92% of the 44095 zip code residents lived in the same house 1 year ago. Out of people who lived in different houses, 55% moved from this county. Out of people who lived in different houses, 44% moved from different county within same state. Out of people who lived in different houses, 2% moved from different state. Out of people who lived in different houses, 1% moved from abroad.
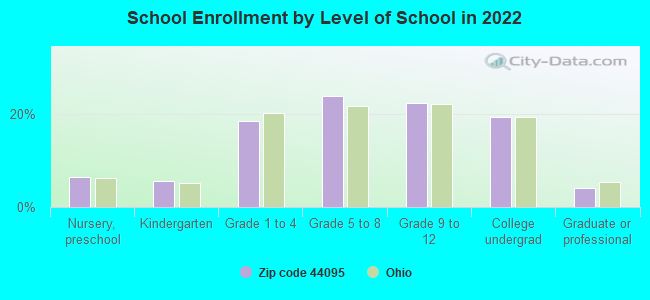
Private vs. public school enrollment:
Students in private schools in grades 1 to 8 (elementary and middle school): 247
Here:
9.6%
Ohio:
16.0%
Students in private schools in grades 9 to 12 (high school): 187
Here:
13.7%
Ohio:
13.1%
Students in private undergraduate colleges: 144
Here:
12.2%
Ohio:
22.3%
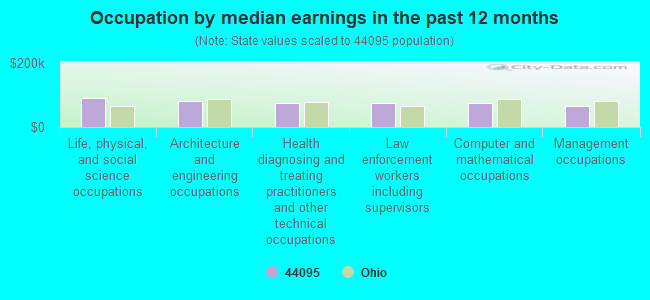
Occupation by median earnings in the past 12 months ($)
91,886Life, physical, and social science occupations
81,214Architecture and engineering occupations
76,726Health diagnosing and treating practitioners and other technical occupations
74,537Law enforcement workers including supervisors
73,758Computer and mathematical occupations
67,249Management occupations
Companies with biggest federal contracts located in this zip code:
J & L CAPITAL, INC (1517 E 367TH ST in WILLOUGHBY, OH; small business) 1000 employees, $0 revenue. Veteran Owned Business: $1,538,852 in 17 contractsfrom 1999 to 2006
Contracts for Gas Turbines and Jet Engines, Aircraft; Prime Moving, and Components by Navy, Defense Logistics Agency Signed by year:2000: $350,133; 2001: $588,169; 2002: $200,905; 2003: $233,149; 2004: $34,372; 2005: $43,375; 2006: $31,549.
Biggest contracts:
$261,875 with Navy for Gas Turbines and Jet Engines, Aircraft; Prime Moving, and Components. Signed on 2000-11-16. Completion date: 2001-11-16.
$234,499, same as above.Signed on 2001-05-14. Completion date: 2002-05-31.
$233,149, same as above.Signed on 2003-07-16. Completion date: 2004-01-12.
$201,927 with Defense Logistics Agency for Gas Turbines and Jet Engines, Aircraft; Prime Moving, and Components. Signed on 2001-06-18. Completion date: 2001-09-16.
STARGATE DEFENSE SYSTEMS CORPO (35585 CURTIS BLVD in EASTLAKE, OH; small business)
$1,250,000 with Army for Other Research and Development -- Basic Research (R&D). Signed on 2004-11-05. Completion date: 2005-10-31.
EUCLID MACHINE COMPANY INC (34201 MELINZ PKWY STE B in WILLOUGHBY, OH; small business) : $388,918 in 10 contractsfrom 2002 to 2004
Contracts for Aircraft Landing Gear Components, Aircraft Hydraulic, Vacuum, and De-icing System Components, Bearings, Plain, Unmounted, Vehicular Brake, Steering, Axle, Wheel, and Track Components, and moreby Defense Logistics Agency Signed by year:2000: $0; 2001: $0; 2002: $344,908; 2003: $0; 2004: $44,010; 2005: $0; 2006: $0.
Biggest contracts:
$120,872 with Defense Logistics Agency for Aircraft Landing Gear Components. Signed on 2002-06-05. Completion date: 2003-04-16.
$45,948 with Defense Logistics Agency for Aircraft Hydraulic, Vacuum, and De-icing System Components. Signed on 2002-05-05. Completion date: 2003-01-30.
$44,360 with Defense Logistics Agency for Bearings, Plain, Unmounted. Signed on 2002-04-18. Completion date: 2002-07-17.
$44,010 with Defense Logistics Agency for Aircraft Hydraulic, Vacuum, and De-icing System Components. Signed on 2004-06-30. Completion date: 2004-11-20.
PROFESSIONAL ELECTRIC PRODUCTS (33210 LAKELAND BLVD in EASTLAKE, OH; small business) : $263,066 in 4 contractsfrom 2000 to 2004
$148,575 with Air Force for Transformers: Distribution and Power Station. Taking place in TN. Signed on 2001-09-21. Completion date: 2002-03-25.
$119,416 with Air Force for Pipe, Tube and Rigid Tubing. Signed on 2000-05-25. Completion date: 2000-05-25.
$3,075 with NASA for . Signed on 2004-04-07. Completion date: 2004-04-21.
-$8,000 with NASA for Miscellaneous Electrical and Electronic Components. Taking place in NM. Signed on 2000-03-15. Completion date: 2000-03-15.
SMART BUSINESS MACHINES (34201 MELINZ PARKWAY/ VOKE in EASTLAKE, OH; small business) : $180,746 in 4 contractsin 2003
$61,535 with Defense Logistics Agency for Vehicular Brake, Steering, Axle, Wheel, and Track Components. Signed on 2003-11-25. Completion date: 2004-03-30.
$49,758 with Defense Logistics Agency for Miscellaneous Power Transmission Equipment. Signed on 2003-11-29. Completion date: 2004-05-27.
$42,579 with Defense Logistics Agency for Vehicular Brake, Steering, Axle, Wheel, and Track Components. Signed on 2003-11-12. Completion date: 2004-05-10.
$26,874 with Defense Logistics Agency for Bearings, Antifriction, Unmounted. Signed on 2003-11-06. Completion date: 2004-05-04.
ABLE CONTRACTING GROUP INC (33100 LAKELAND BLVD in EASTLAKE, OH; small business) : $133,390 in 3 contractsfrom 2001 to 2005
$78,000 with Bureau of Prisoners/Federal Prison System for Maintenance, Repair or Alteration of Real Property -- Other Non-Building Facilities. Signed on 2001-07-15. Completion date: 2001-09-15.
$27,695 with Army for Fencing, Fences, Gates and Components. Signed on 2005-07-11. Completion date: 2005-06-08.
$27,695 with U.S. Army Corps of Engineers - civil program financing only for Fencing, Fences, Gates and Components. Signed on 2005-07-11. Completion date: 2005-06-08.
HIGHLAND PRECISION (34201 MELINZ PKWY UNIT B in EASTLAKE, OH; small business)
$78,406 with Defense Logistics Agency for Vehicular Furniture and Accessories. Signed on 2004-02-22. Completion date: 2004-08-20.
NCD MEDICAL CORP (33801 CURTIS BLVD SUITE 10 in WILLOUGHBY, OH; small business) : $29,361 in 2 contractsfrom 2004 to 2005
$14,900 with Navy for Medical and Surgical Instruments, Equipment, and Supplies. Signed on 2005-04-28. Completion date: 2005-05-05.
$14,461 with Army for X-Ray Equipment and Supplies: Medical, Dental, Veterinary. Signed on 2004-09-27. Completion date: 2004-10-30.
PROVIDIAN MEDICAL INC (30510 LAKELAND BLVD UNIT A in WILLOUGHBY, OH; small business)
$14,700 with Navy for Medical and Surgical Instruments, Equipment, and Supplies. Signed on 2005-01-28. Completion date: 2005-02-10.
OAKWOOD GROUP INC, THE (35585 CURTIS BLVD STE K in EASTLAKE, OH; small business)
$14,389 with Army for Miscellaneous Items. Taking place in MD. Signed on 2002-09-25. Completion date: 2002-09-30.
Top industries in this zip code by the number of employees in 2005:
Utilities: Fossil Fuel Electric Power Generation (250-499 employees: 1 establishment)
2002 - 2018 National Fire Incident Reporting System (NFIRS) incidents
Based on the data from the years 2002 - 2018 the average number of fire incidents per year is 119. The highest number of fires - 161 took place in 2016, and the least - 82 in 2002. The data has an increasing trend.
When looking into fire subcategories, the most reports belonged to: Structure Fires (64.9%), and Outside Fires (23.6%).
Fire incident types reported to NFIRS in Zip Code 44095


 Nearest zip codes: 44092, 44132, 44094, 44123, 44143, 44117.
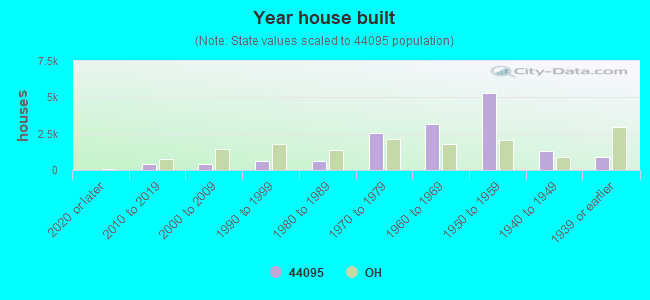


 Based on the data from the years 2002 - 2018 the average number of fire incidents per year is 119. The highest number of fires - 161 took place in 2016, and the least - 82 in 2002. The data has an increasing trend.
 When looking into fire subcategories, the most reports belonged to: Structure Fires (64.9%), and Outside Fires (23.6%).