Willowick, Ohio Submit your own pictures of this city and show them to the world
OSM Map
General Map
Google Map
MSN Map
OSM Map
General Map
Google Map
MSN Map
OSM Map
General Map
Google Map
MSN Map
OSM Map
General Map
Google Map
MSN Map
Please wait while loading the map...
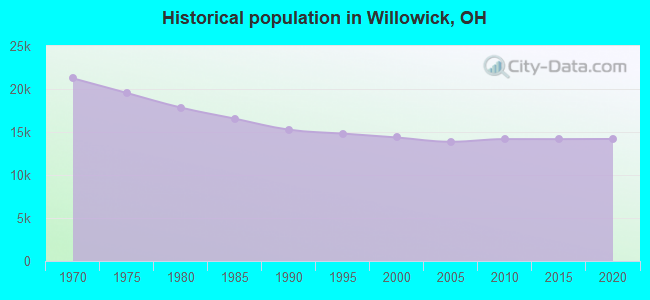
Population in 2022: 14,139 (100% urban, 0% rural). Population change since 2000: -1.5%Males: 6,945 Females: 7,194
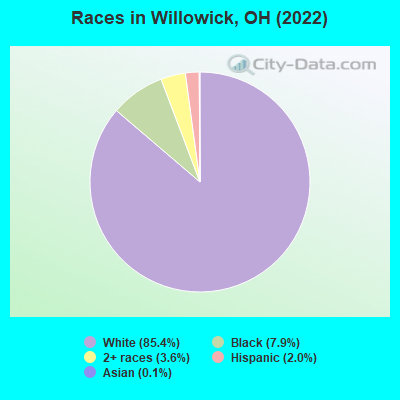
March 2022 cost of living index in Willowick: 93.5 (less than average, U.S. average is 100) Percentage of residents living in poverty in 2022: 6.1%for White Non-Hispanic residents , 14.0% for Black residents , 2.0% for two or more races residents )Business Search - 14 Million verified businesses
Data:
Median household income ($)
Median household income (% change since 2000)
Household income diversity
Ratio of average income to average house value (%)
Ratio of average income to average rent
Median household income ($) - White
Median household income ($) - Black or African American
Median household income ($) - Asian
Median household income ($) - Hispanic or Latino
Median household income ($) - American Indian and Alaska Native
Median household income ($) - Multirace
Median household income ($) - Other Race
Median household income for houses/condos with a mortgage ($)
Median household income for apartments without a mortgage ($)
Races - White alone (%)
Races - White alone (% change since 2000)
Races - Black alone (%)
Races - Black alone (% change since 2000)
Races - American Indian alone (%)
Races - American Indian alone (% change since 2000)
Races - Asian alone (%)
Races - Asian alone (% change since 2000)
Races - Hispanic (%)
Races - Hispanic (% change since 2000)
Races - Native Hawaiian and Other Pacific Islander alone (%)
Races - Native Hawaiian and Other Pacific Islander alone (% change since 2000)
Races - Two or more races (%)
Races - Two or more races (% change since 2000)
Races - Other race alone (%)
Races - Other race alone (% change since 2000)
Racial diversity
Unemployment (%)
Unemployment (% change since 2000)
Unemployment (%) - White
Unemployment (%) - Black or African American
Unemployment (%) - Asian
Unemployment (%) - Hispanic or Latino
Unemployment (%) - American Indian and Alaska Native
Unemployment (%) - Multirace
Unemployment (%) - Other Race
Population density (people per square mile)
Population - Males (%)
Population - Females (%)
Population - Males (%) - White
Population - Males (%) - Black or African American
Population - Males (%) - Asian
Population - Males (%) - Hispanic or Latino
Population - Males (%) - American Indian and Alaska Native
Population - Males (%) - Multirace
Population - Males (%) - Other Race
Population - Females (%) - White
Population - Females (%) - Black or African American
Population - Females (%) - Asian
Population - Females (%) - Hispanic or Latino
Population - Females (%) - American Indian and Alaska Native
Population - Females (%) - Multirace
Population - Females (%) - Other Race
Coronavirus confirmed cases (Apr 27, 2024)
Deaths caused by coronavirus (Apr 27, 2024)
Coronavirus confirmed cases (per 100k population) (Apr 27, 2024)
Deaths caused by coronavirus (per 100k population) (Apr 27, 2024)
Daily increase in number of cases (Apr 27, 2024)
Weekly increase in number of cases (Apr 27, 2024)
Cases doubled (in days) (Apr 27, 2024)
Hospitalized patients (Apr 18, 2022)
Negative test results (Apr 18, 2022)
Total test results (Apr 18, 2022)
COVID Vaccine doses distributed (per 100k population) (Sep 19, 2023)
COVID Vaccine doses administered (per 100k population) (Sep 19, 2023)
COVID Vaccine doses distributed (Sep 19, 2023)
COVID Vaccine doses administered (Sep 19, 2023)
Likely homosexual households (%)
Likely homosexual households (% change since 2000)
Likely homosexual households - Lesbian couples (%)
Likely homosexual households - Lesbian couples (% change since 2000)
Likely homosexual households - Gay men (%)
Likely homosexual households - Gay men (% change since 2000)
Cost of living index
Median gross rent ($)
Median contract rent ($)
Median monthly housing costs ($)
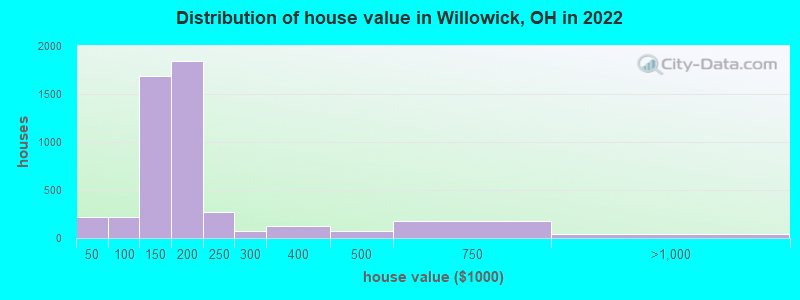
Median house or condo value ($)
Median house or condo value ($ change since 2000)
Mean house or condo value by units in structure - 1, detached ($)
Mean house or condo value by units in structure - 1, attached ($)
Mean house or condo value by units in structure - 2 ($)
Mean house or condo value by units in structure by units in structure - 3 or 4 ($)
Mean house or condo value by units in structure - 5 or more ($)
Mean house or condo value by units in structure - Boat, RV, van, etc. ($)
Mean house or condo value by units in structure - Mobile home ($)
Median house or condo value ($) - White
Median house or condo value ($) - Black or African American
Median house or condo value ($) - Asian
Median house or condo value ($) - Hispanic or Latino
Median house or condo value ($) - American Indian and Alaska Native
Median house or condo value ($) - Multirace
Median house or condo value ($) - Other Race
Median resident age
Resident age diversity
Median resident age - Males
Median resident age - Females
Median resident age - White
Median resident age - Black or African American
Median resident age - Asian
Median resident age - Hispanic or Latino
Median resident age - American Indian and Alaska Native
Median resident age - Multirace
Median resident age - Other Race
Median resident age - Males - White
Median resident age - Males - Black or African American
Median resident age - Males - Asian
Median resident age - Males - Hispanic or Latino
Median resident age - Males - American Indian and Alaska Native
Median resident age - Males - Multirace
Median resident age - Males - Other Race
Median resident age - Females - White
Median resident age - Females - Black or African American
Median resident age - Females - Asian
Median resident age - Females - Hispanic or Latino
Median resident age - Females - American Indian and Alaska Native
Median resident age - Females - Multirace
Median resident age - Females - Other Race
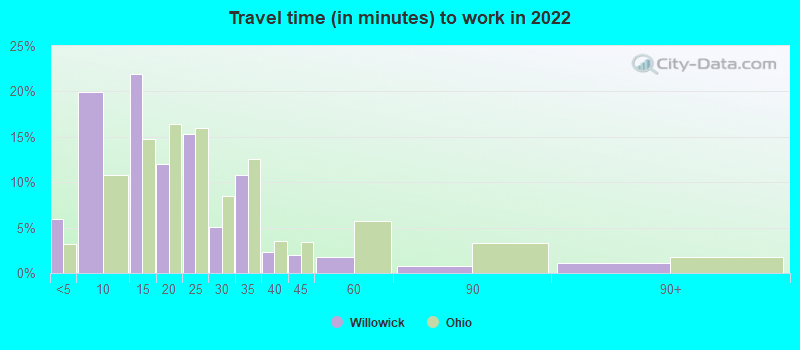
Commute - mean travel time to work (minutes)
Travel time to work - Less than 5 minutes (%)
Travel time to work - Less than 5 minutes (% change since 2000)
Travel time to work - 5 to 9 minutes (%)
Travel time to work - 5 to 9 minutes (% change since 2000)
Travel time to work - 10 to 19 minutes (%)
Travel time to work - 10 to 19 minutes (% change since 2000)
Travel time to work - 20 to 29 minutes (%)
Travel time to work - 20 to 29 minutes (% change since 2000)
Travel time to work - 30 to 39 minutes (%)
Travel time to work - 30 to 39 minutes (% change since 2000)
Travel time to work - 40 to 59 minutes (%)
Travel time to work - 40 to 59 minutes (% change since 2000)
Travel time to work - 60 to 89 minutes (%)
Travel time to work - 60 to 89 minutes (% change since 2000)
Travel time to work - 90 or more minutes (%)
Travel time to work - 90 or more minutes (% change since 2000)
Marital status - Never married (%)
Marital status - Now married (%)
Marital status - Separated (%)
Marital status - Widowed (%)
Marital status - Divorced (%)
Median family income ($)
Median family income (% change since 2000)
Median non-family income ($)
Median non-family income (% change since 2000)
Median per capita income ($)
Median per capita income (% change since 2000)
Median family income ($) - White
Median family income ($) - Black or African American
Median family income ($) - Asian
Median family income ($) - Hispanic or Latino
Median family income ($) - American Indian and Alaska Native
Median family income ($) - Multirace
Median family income ($) - Other Race
Median year house/condo built
Median year apartment built
Year house built - Built 2005 or later (%)
Year house built - Built 2000 to 2004 (%)
Year house built - Built 1990 to 1999 (%)
Year house built - Built 1980 to 1989 (%)
Year house built - Built 1970 to 1979 (%)
Year house built - Built 1960 to 1969 (%)
Year house built - Built 1950 to 1959 (%)
Year house built - Built 1940 to 1949 (%)
Year house built - Built 1939 or earlier (%)
Average household size
Household density (households per square mile)
Average household size - White
Average household size - Black or African American
Average household size - Asian
Average household size - Hispanic or Latino
Average household size - American Indian and Alaska Native
Average household size - Multirace
Average household size - Other Race
Occupied housing units (%)
Vacant housing units (%)
Owner occupied housing units (%)
Renter occupied housing units (%)
Vacancy status - For rent (%)
Vacancy status - For sale only (%)
Vacancy status - Rented or sold, not occupied (%)
Vacancy status - For seasonal, recreational, or occasional use (%)
Vacancy status - For migrant workers (%)
Vacancy status - Other vacant (%)
Residents with income below the poverty level (%)
Residents with income below 50% of the poverty level (%)
Children below poverty level (%)
Poor families by family type - Married-couple family (%)
Poor families by family type - Male, no wife present (%)
Poor families by family type - Female, no husband present (%)
Poverty status for native-born residents (%)
Poverty status for foreign-born residents (%)
Poverty among high school graduates not in families (%)
Poverty among people who did not graduate high school not in families (%)
Residents with income below the poverty level (%) - White
Residents with income below the poverty level (%) - Black or African American
Residents with income below the poverty level (%) - Asian
Residents with income below the poverty level (%) - Hispanic or Latino
Residents with income below the poverty level (%) - American Indian and Alaska Native
Residents with income below the poverty level (%) - Multirace
Residents with income below the poverty level (%) - Other Race
Air pollution - Air Quality Index (AQI)
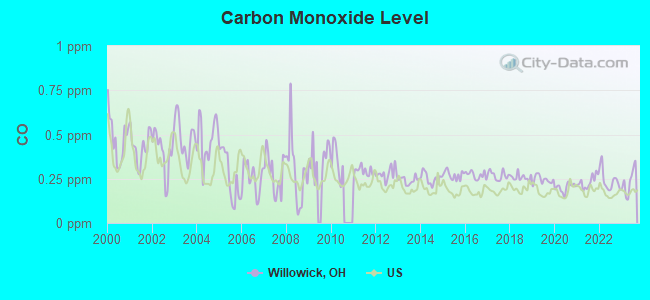
Air pollution - CO
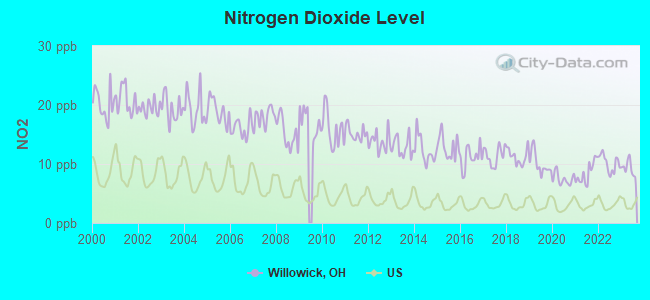
Air pollution - NO2
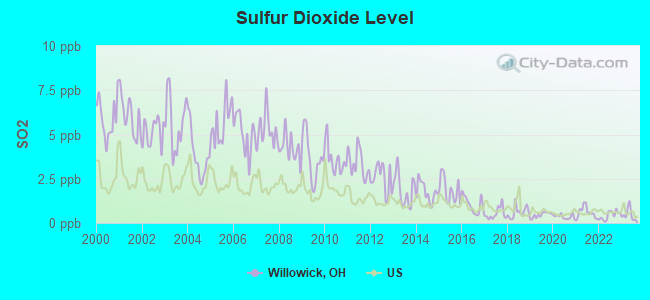
Air pollution - SO2
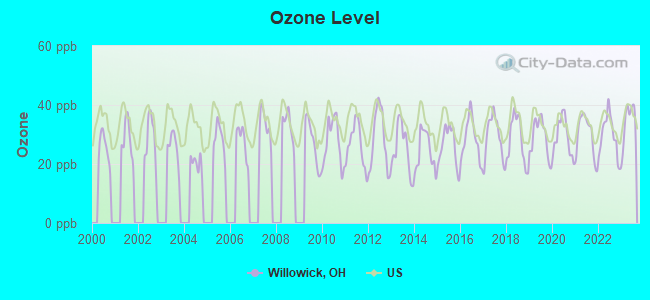
Air pollution - Ozone
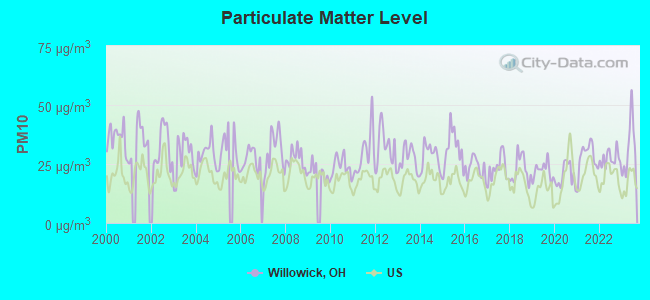
Air pollution - PM10
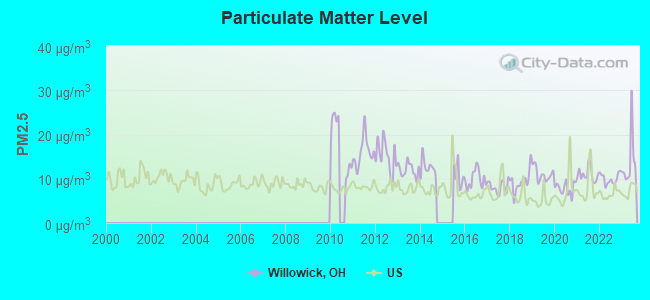
Air pollution - PM25
Air pollution - Pb
Crime - Murders per 100,000 population
Crime - Rapes per 100,000 population
Crime - Robberies per 100,000 population
Crime - Assaults per 100,000 population
Crime - Burglaries per 100,000 population
Crime - Thefts per 100,000 population
Crime - Auto thefts per 100,000 population
Crime - Arson per 100,000 population
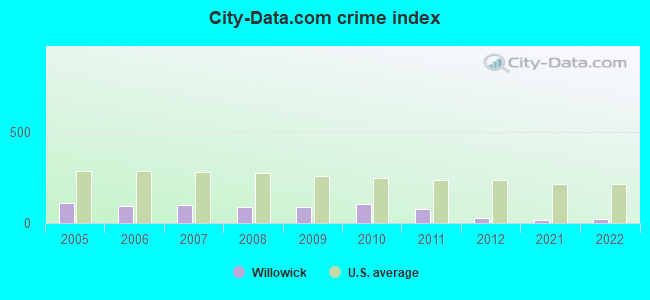
Crime - City-data.com crime index
Crime - Violent crime index
Crime - Property crime index
Crime - Murders per 100,000 population (5 year average)
Crime - Rapes per 100,000 population (5 year average)
Crime - Robberies per 100,000 population (5 year average)
Crime - Assaults per 100,000 population (5 year average)
Crime - Burglaries per 100,000 population (5 year average)
Crime - Thefts per 100,000 population (5 year average)
Crime - Auto thefts per 100,000 population (5 year average)
Crime - Arson per 100,000 population (5 year average)
Crime - City-data.com crime index (5 year average)
Crime - Violent crime index (5 year average)
Crime - Property crime index (5 year average)
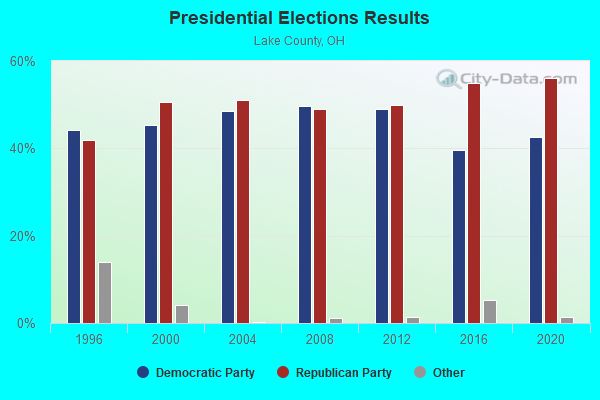
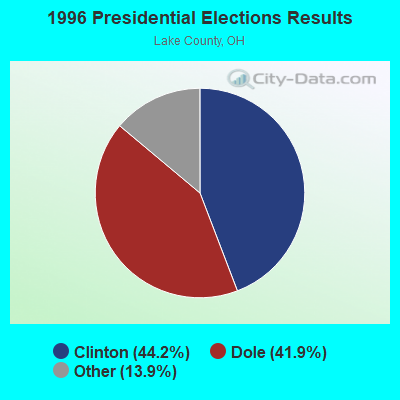
1996 Presidential Elections Results (%) - Democratic Party (Clinton)
1996 Presidential Elections Results (%) - Republican Party (Dole)
1996 Presidential Elections Results (%) - Other
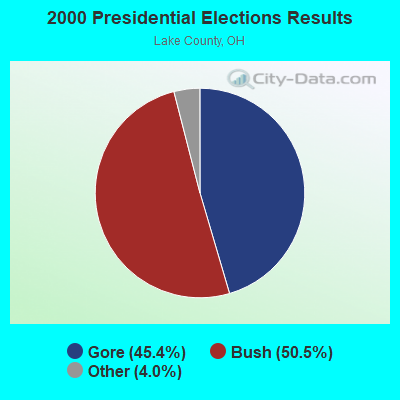
2000 Presidential Elections Results (%) - Democratic Party (Gore)
2000 Presidential Elections Results (%) - Republican Party (Bush)
2000 Presidential Elections Results (%) - Other
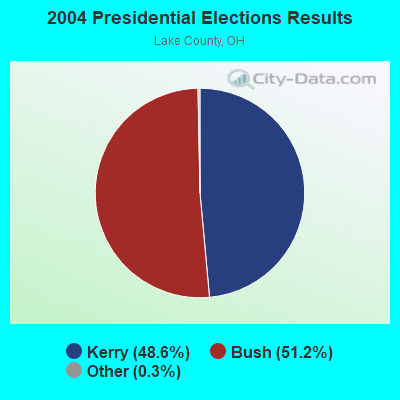
2004 Presidential Elections Results (%) - Democratic Party (Kerry)
2004 Presidential Elections Results (%) - Republican Party (Bush)
2004 Presidential Elections Results (%) - Other
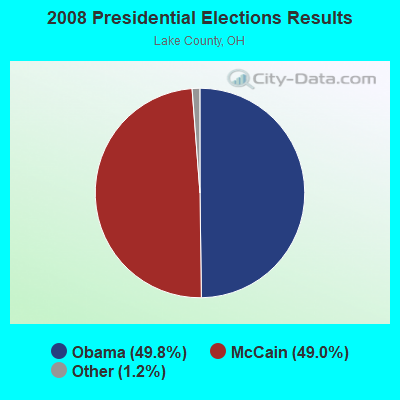
2008 Presidential Elections Results (%) - Democratic Party (Obama)
2008 Presidential Elections Results (%) - Republican Party (McCain)
2008 Presidential Elections Results (%) - Other
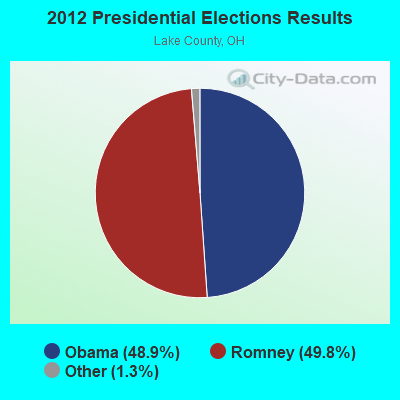
2012 Presidential Elections Results (%) - Democratic Party (Obama)
2012 Presidential Elections Results (%) - Republican Party (Romney)
2012 Presidential Elections Results (%) - Other
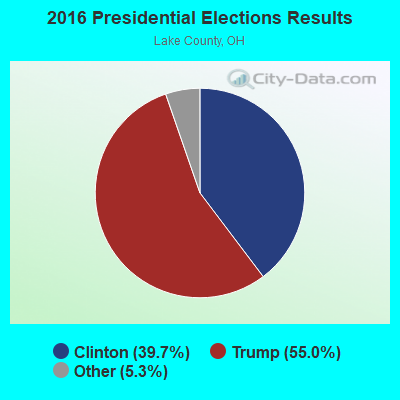
2016 Presidential Elections Results (%) - Democratic Party (Clinton)
2016 Presidential Elections Results (%) - Republican Party (Trump)
2016 Presidential Elections Results (%) - Other
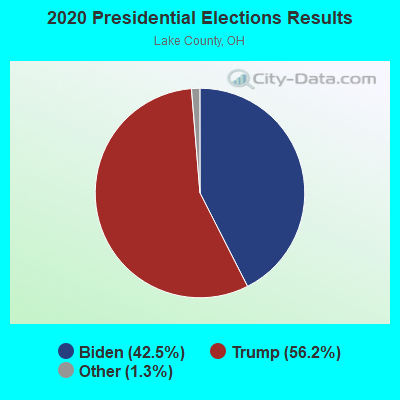
2020 Presidential Elections Results (%) - Democratic Party (Biden)
2020 Presidential Elections Results (%) - Republican Party (Trump)
2020 Presidential Elections Results (%) - Other
Ancestries Reported - Arab (%)
Ancestries Reported - Czech (%)
Ancestries Reported - Danish (%)
Ancestries Reported - Dutch (%)
Ancestries Reported - English (%)
Ancestries Reported - French (%)
Ancestries Reported - French Canadian (%)
Ancestries Reported - German (%)
Ancestries Reported - Greek (%)
Ancestries Reported - Hungarian (%)
Ancestries Reported - Irish (%)
Ancestries Reported - Italian (%)
Ancestries Reported - Lithuanian (%)
Ancestries Reported - Norwegian (%)
Ancestries Reported - Polish (%)
Ancestries Reported - Portuguese (%)
Ancestries Reported - Russian (%)
Ancestries Reported - Scotch-Irish (%)
Ancestries Reported - Scottish (%)
Ancestries Reported - Slovak (%)
Ancestries Reported - Subsaharan African (%)
Ancestries Reported - Swedish (%)
Ancestries Reported - Swiss (%)
Ancestries Reported - Ukrainian (%)
Ancestries Reported - United States (%)
Ancestries Reported - Welsh (%)
Ancestries Reported - West Indian (%)
Ancestries Reported - Other (%)
Educational Attainment - No schooling completed (%)
Educational Attainment - Less than high school (%)
Educational Attainment - High school or equivalent (%)
Educational Attainment - Less than 1 year of college (%)
Educational Attainment - 1 or more years of college (%)
Educational Attainment - Associate degree (%)
Educational Attainment - Bachelor's degree (%)
Educational Attainment - Master's degree (%)
Educational Attainment - Professional school degree (%)
Educational Attainment - Doctorate degree (%)
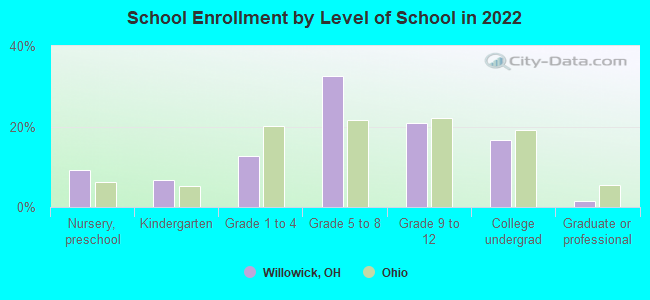
School Enrollment - Nursery, preschool (%)
School Enrollment - Kindergarten (%)
School Enrollment - Grade 1 to 4 (%)
School Enrollment - Grade 5 to 8 (%)
School Enrollment - Grade 9 to 12 (%)
School Enrollment - College undergrad (%)
School Enrollment - Graduate or professional (%)
School Enrollment - Not enrolled in school (%)
School enrollment - Public schools (%)
School enrollment - Private schools (%)
School enrollment - Not enrolled (%)
Median number of rooms in houses and condos
Median number of rooms in apartments
Housing units lacking complete plumbing facilities (%)
Housing units lacking complete kitchen facilities (%)
Density of houses
Urban houses (%)
Rural houses (%)
Households with people 60 years and over (%)
Households with people 65 years and over (%)
Households with people 75 years and over (%)
Households with one or more nonrelatives (%)
Households with no nonrelatives (%)
Population in households (%)
Family households (%)
Nonfamily households (%)
Population in families (%)
Family households with own children (%)
Median number of bedrooms in owner occupied houses
Mean number of bedrooms in owner occupied houses
Median number of bedrooms in renter occupied houses
Mean number of bedrooms in renter occupied houses
Median number of vehichles in owner occupied houses
Mean number of vehichles in owner occupied houses
Median number of vehichles in renter occupied houses
Mean number of vehichles in renter occupied houses
Mortgage status - with mortgage (%)
Mortgage status - with second mortgage (%)
Mortgage status - with home equity loan (%)
Mortgage status - with both second mortgage and home equity loan (%)
Mortgage status - without a mortgage (%)
Average family size
Average family size - White
Average family size - Black or African American
Average family size - Asian
Average family size - Hispanic or Latino
Average family size - American Indian and Alaska Native
Average family size - Multirace
Average family size - Other Race
Geographical mobility - Same house 1 year ago (%)
Geographical mobility - Moved within same county (%)
Geographical mobility - Moved from different county within same state (%)
Geographical mobility - Moved from different state (%)
Geographical mobility - Moved from abroad (%)
Place of birth - Born in state of residence (%)
Place of birth - Born in other state (%)
Place of birth - Native, outside of US (%)
Place of birth - Foreign born (%)
Housing units in structures - 1, detached (%)
Housing units in structures - 1, attached (%)
Housing units in structures - 2 (%)
Housing units in structures - 3 or 4 (%)
Housing units in structures - 5 to 9 (%)
Housing units in structures - 10 to 19 (%)
Housing units in structures - 20 to 49 (%)
Housing units in structures - 50 or more (%)
Housing units in structures - Mobile home (%)
Housing units in structures - Boat, RV, van, etc. (%)
House/condo owner moved in on average (years ago)
Renter moved in on average (years ago)
Year householder moved into unit - Moved in 1999 to March 2000 (%)
Year householder moved into unit - Moved in 1995 to 1998 (%)
Year householder moved into unit - Moved in 1990 to 1994 (%)
Year householder moved into unit - Moved in 1980 to 1989 (%)
Year householder moved into unit - Moved in 1970 to 1979 (%)
Year householder moved into unit - Moved in 1969 or earlier (%)
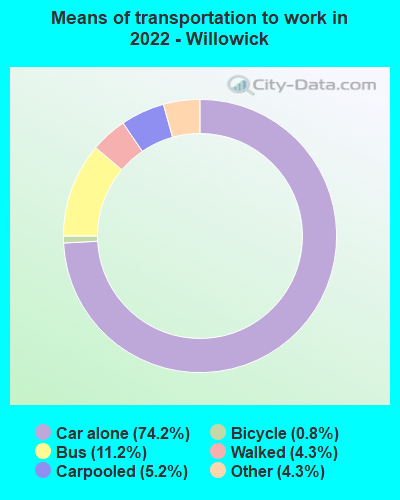
Means of transportation to work - Drove car alone (%)
Means of transportation to work - Carpooled (%)
Means of transportation to work - Public transportation (%)
Means of transportation to work - Bus or trolley bus (%)
Means of transportation to work - Streetcar or trolley car (%)
Means of transportation to work - Subway or elevated (%)
Means of transportation to work - Railroad (%)
Means of transportation to work - Ferryboat (%)
Means of transportation to work - Taxicab (%)
Means of transportation to work - Motorcycle (%)
Means of transportation to work - Bicycle (%)
Means of transportation to work - Walked (%)
Means of transportation to work - Other means (%)
Working at home (%)
Industry diversity
Most Common Industries - Agriculture, forestry, fishing and hunting, and mining (%)
Most Common Industries - Agriculture, forestry, fishing and hunting (%)
Most Common Industries - Mining, quarrying, and oil and gas extraction (%)
Most Common Industries - Construction (%)
Most Common Industries - Manufacturing (%)
Most Common Industries - Wholesale trade (%)
Most Common Industries - Retail trade (%)
Most Common Industries - Transportation and warehousing, and utilities (%)
Most Common Industries - Transportation and warehousing (%)
Most Common Industries - Utilities (%)
Most Common Industries - Information (%)
Most Common Industries - Finance and insurance, and real estate and rental and leasing (%)
Most Common Industries - Finance and insurance (%)
Most Common Industries - Real estate and rental and leasing (%)
Most Common Industries - Professional, scientific, and management, and administrative and waste management services (%)
Most Common Industries - Professional, scientific, and technical services (%)
Most Common Industries - Management of companies and enterprises (%)
Most Common Industries - Administrative and support and waste management services (%)
Most Common Industries - Educational services, and health care and social assistance (%)
Most Common Industries - Educational services (%)
Most Common Industries - Health care and social assistance (%)
Most Common Industries - Arts, entertainment, and recreation, and accommodation and food services (%)
Most Common Industries - Arts, entertainment, and recreation (%)
Most Common Industries - Accommodation and food services (%)
Most Common Industries - Other services, except public administration (%)
Most Common Industries - Public administration (%)
Occupation diversity
Most Common Occupations - Management, business, science, and arts occupations (%)
Most Common Occupations - Management, business, and financial occupations (%)
Most Common Occupations - Management occupations (%)
Most Common Occupations - Business and financial operations occupations (%)
Most Common Occupations - Computer, engineering, and science occupations (%)
Most Common Occupations - Computer and mathematical occupations (%)
Most Common Occupations - Architecture and engineering occupations (%)
Most Common Occupations - Life, physical, and social science occupations (%)
Most Common Occupations - Education, legal, community service, arts, and media occupations (%)
Most Common Occupations - Community and social service occupations (%)
Most Common Occupations - Legal occupations (%)
Most Common Occupations - Education, training, and library occupations (%)
Most Common Occupations - Arts, design, entertainment, sports, and media occupations (%)
Most Common Occupations - Healthcare practitioners and technical occupations (%)
Most Common Occupations - Health diagnosing and treating practitioners and other technical occupations (%)
Most Common Occupations - Health technologists and technicians (%)
Most Common Occupations - Service occupations (%)
Most Common Occupations - Healthcare support occupations (%)
Most Common Occupations - Protective service occupations (%)
Most Common Occupations - Fire fighting and prevention, and other protective service workers including supervisors (%)
Most Common Occupations - Law enforcement workers including supervisors (%)
Most Common Occupations - Food preparation and serving related occupations (%)
Most Common Occupations - Building and grounds cleaning and maintenance occupations (%)
Most Common Occupations - Personal care and service occupations (%)
Most Common Occupations - Sales and office occupations (%)
Most Common Occupations - Sales and related occupations (%)
Most Common Occupations - Office and administrative support occupations (%)
Most Common Occupations - Natural resources, construction, and maintenance occupations (%)
Most Common Occupations - Farming, fishing, and forestry occupations (%)
Most Common Occupations - Construction and extraction occupations (%)
Most Common Occupations - Installation, maintenance, and repair occupations (%)
Most Common Occupations - Production, transportation, and material moving occupations (%)
Most Common Occupations - Production occupations (%)
Most Common Occupations - Transportation occupations (%)
Most Common Occupations - Material moving occupations (%)
People in Group quarters - Institutionalized population (%)
People in Group quarters - Correctional institutions (%)
People in Group quarters - Federal prisons and detention centers (%)
People in Group quarters - Halfway houses (%)
People in Group quarters - Local jails and other confinement facilities (including police lockups) (%)
People in Group quarters - Military disciplinary barracks (%)
People in Group quarters - State prisons (%)
People in Group quarters - Other types of correctional institutions (%)
People in Group quarters - Nursing homes (%)
People in Group quarters - Hospitals/wards, hospices, and schools for the handicapped (%)
People in Group quarters - Hospitals/wards and hospices for chronically ill (%)
People in Group quarters - Hospices or homes for chronically ill (%)
People in Group quarters - Military hospitals or wards for chronically ill (%)
People in Group quarters - Other hospitals or wards for chronically ill (%)
People in Group quarters - Hospitals or wards for drug/alcohol abuse (%)
People in Group quarters - Mental (Psychiatric) hospitals or wards (%)
People in Group quarters - Schools, hospitals, or wards for the mentally retarded (%)
People in Group quarters - Schools, hospitals, or wards for the physically handicapped (%)
People in Group quarters - Institutions for the deaf (%)
People in Group quarters - Institutions for the blind (%)
People in Group quarters - Orthopedic wards and institutions for the physically handicapped (%)
People in Group quarters - Wards in general hospitals for patients who have no usual home elsewhere (%)
People in Group quarters - Wards in military hospitals for patients who have no usual home elsewhere (%)
People in Group quarters - Juvenile institutions (%)
People in Group quarters - Long-term care (%)
People in Group quarters - Homes for abused, dependent, and neglected children (%)
People in Group quarters - Residential treatment centers for emotionally disturbed children (%)
People in Group quarters - Training schools for juvenile delinquents (%)
People in Group quarters - Short-term care, detention or diagnostic centers for delinquent children (%)
People in Group quarters - Type of juvenile institution unknown (%)
People in Group quarters - Noninstitutionalized population (%)
People in Group quarters - College dormitories (includes college quarters off campus) (%)
People in Group quarters - Military quarters (%)
People in Group quarters - On base (%)
People in Group quarters - Barracks, unaccompanied personnel housing (UPH), (Enlisted/Officer), ;and similar group living quarters for military personnel (%)
People in Group quarters - Transient quarters for temporary residents (%)
People in Group quarters - Military ships (%)
People in Group quarters - Group homes (%)
People in Group quarters - Homes or halfway houses for drug/alcohol abuse (%)
People in Group quarters - Homes for the mentally ill (%)
People in Group quarters - Homes for the mentally retarded (%)
People in Group quarters - Homes for the physically handicapped (%)
People in Group quarters - Other group homes (%)
People in Group quarters - Religious group quarters (%)
People in Group quarters - Dormitories (%)
People in Group quarters - Agriculture workers' dormitories on farms (%)
People in Group quarters - Job Corps and vocational training facilities (%)
People in Group quarters - Other workers' dormitories (%)
People in Group quarters - Crews of maritime vessels (%)
People in Group quarters - Other nonhousehold living situations (%)
People in Group quarters - Other noninstitutional group quarters (%)
Residents speaking English at home (%)
Residents speaking English at home - Born in the United States (%)
Residents speaking English at home - Native, born elsewhere (%)
Residents speaking English at home - Foreign born (%)
Residents speaking Spanish at home (%)
Residents speaking Spanish at home - Born in the United States (%)
Residents speaking Spanish at home - Native, born elsewhere (%)
Residents speaking Spanish at home - Foreign born (%)
Residents speaking other language at home (%)
Residents speaking other language at home - Born in the United States (%)
Residents speaking other language at home - Native, born elsewhere (%)
Residents speaking other language at home - Foreign born (%)
Class of Workers - Employee of private company (%)
Class of Workers - Self-employed in own incorporated business (%)
Class of Workers - Private not-for-profit wage and salary workers (%)
Class of Workers - Local government workers (%)
Class of Workers - State government workers (%)
Class of Workers - Federal government workers (%)
Class of Workers - Self-employed workers in own not incorporated business and Unpaid family workers (%)
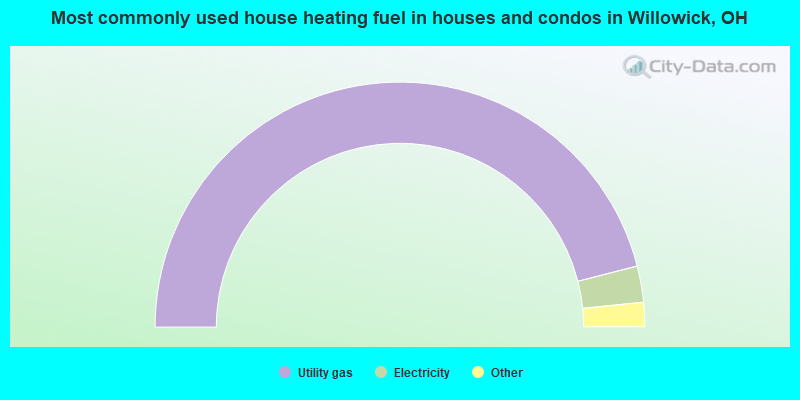
House heating fuel used in houses and condos - Utility gas (%)
House heating fuel used in houses and condos - Bottled, tank, or LP gas (%)
House heating fuel used in houses and condos - Electricity (%)
House heating fuel used in houses and condos - Fuel oil, kerosene, etc. (%)
House heating fuel used in houses and condos - Coal or coke (%)
House heating fuel used in houses and condos - Wood (%)
House heating fuel used in houses and condos - Solar energy (%)
House heating fuel used in houses and condos - Other fuel (%)
House heating fuel used in houses and condos - No fuel used (%)
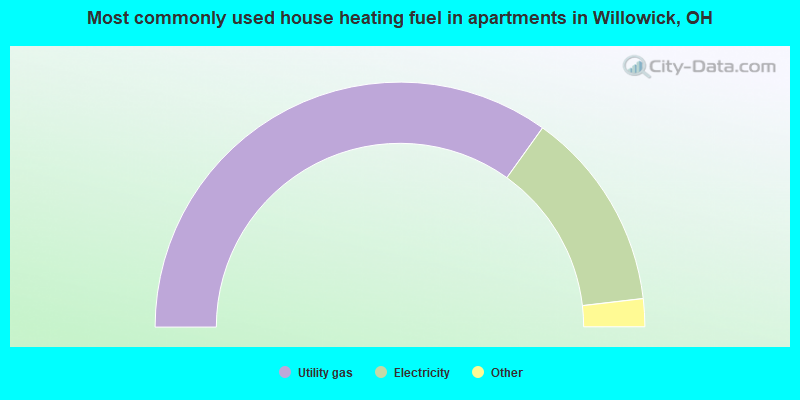
House heating fuel used in apartments - Utility gas (%)
House heating fuel used in apartments - Bottled, tank, or LP gas (%)
House heating fuel used in apartments - Electricity (%)
House heating fuel used in apartments - Fuel oil, kerosene, etc. (%)
House heating fuel used in apartments - Coal or coke (%)
House heating fuel used in apartments - Wood (%)
House heating fuel used in apartments - Solar energy (%)
House heating fuel used in apartments - Other fuel (%)
House heating fuel used in apartments - No fuel used (%)
Armed forces status - In Armed Forces (%)
Armed forces status - Civilian (%)
Armed forces status - Civilian - Veteran (%)
Armed forces status - Civilian - Nonveteran (%)
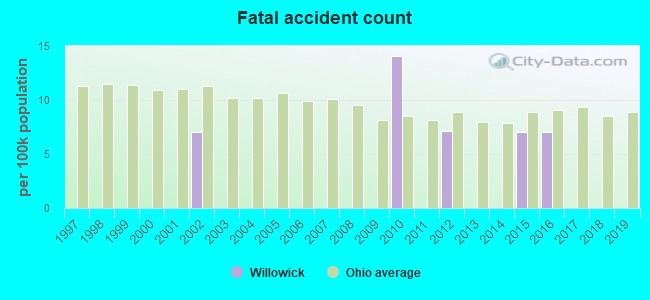
Fatal accidents locations in years 2005-2021
Fatal accidents locations in 2005
Fatal accidents locations in 2006
Fatal accidents locations in 2007
Fatal accidents locations in 2008
Fatal accidents locations in 2009
Fatal accidents locations in 2010
Fatal accidents locations in 2011
Fatal accidents locations in 2012
Fatal accidents locations in 2013
Fatal accidents locations in 2014
Fatal accidents locations in 2015
Fatal accidents locations in 2016
Fatal accidents locations in 2017
Fatal accidents locations in 2018
Fatal accidents locations in 2019
Fatal accidents locations in 2020
Fatal accidents locations in 2021
Alcohol use - People drinking some alcohol every month (%)
Alcohol use - People not drinking at all (%)
Alcohol use - Average days/month drinking alcohol
Alcohol use - Average drinks/week
Alcohol use - Average days/year people drink much
Audiometry - Average condition of hearing (%)
Audiometry - People that can hear a whisper from across a quiet room (%)
Audiometry - People that can hear normal voice from across a quiet room (%)
Audiometry - Ears ringing, roaring, buzzing (%)
Audiometry - Had a job exposure to loud noise (%)
Audiometry - Had off-work exposure to loud noise (%)
Blood Pressure & Cholesterol - Has high blood pressure (%)
Blood Pressure & Cholesterol - Checking blood pressure at home (%)
Blood Pressure & Cholesterol - Frequently checking blood cholesterol (%)
Blood Pressure & Cholesterol - Has high cholesterol level (%)
Consumer Behavior - Money monthly spent on food at supermarket/grocery store
Consumer Behavior - Money monthly spent on food at other stores
Consumer Behavior - Money monthly spent on eating out
Consumer Behavior - Money monthly spent on carryout/delivered foods
Consumer Behavior - Income spent on food at supermarket/grocery store (%)
Consumer Behavior - Income spent on food at other stores (%)
Consumer Behavior - Income spent on eating out (%)
Consumer Behavior - Income spent on carryout/delivered foods (%)
Current Health Status - General health condition (%)
Current Health Status - Blood donors (%)
Current Health Status - Has blood ever tested for HIV virus (%)
Current Health Status - Left-handed people (%)
Dermatology - People using sunscreen (%)
Diabetes - Diabetics (%)
Diabetes - Had a blood test for high blood sugar (%)
Diabetes - People taking insulin (%)
Diet Behavior & Nutrition - Diet health (%)
Diet Behavior & Nutrition - Milk product consumption (# of products/month)
Diet Behavior & Nutrition - Meals not home prepared (#/week)
Diet Behavior & Nutrition - Meals from fast food or pizza place (#/week)
Diet Behavior & Nutrition - Ready-to-eat foods (#/month)
Diet Behavior & Nutrition - Frozen meals/pizza (#/month)
Drug Use - People that ever used marijuana or hashish (%)
Drug Use - Ever used hard drugs (%)
Drug Use - Ever used any form of cocaine (%)
Drug Use - Ever used heroin (%)
Drug Use - Ever used methamphetamine (%)
Health Insurance - People covered by health insurance (%)
Kidney Conditions-Urology - Avg. # of times urinating at night
Medical Conditions - People with asthma (%)
Medical Conditions - People with anemia (%)
Medical Conditions - People with psoriasis (%)
Medical Conditions - People with overweight (%)
Medical Conditions - Elderly people having difficulties in thinking or remembering (%)
Medical Conditions - People who ever received blood transfusion (%)
Medical Conditions - People having trouble seeing even with glass/contacts (%)
Medical Conditions - People with arthritis (%)
Medical Conditions - People with gout (%)
Medical Conditions - People with congestive heart failure (%)
Medical Conditions - People with coronary heart disease (%)
Medical Conditions - People with angina pectoris (%)
Medical Conditions - People who ever had heart attack (%)
Medical Conditions - People who ever had stroke (%)
Medical Conditions - People with emphysema (%)
Medical Conditions - People with thyroid problem (%)
Medical Conditions - People with chronic bronchitis (%)
Medical Conditions - People with any liver condition (%)
Medical Conditions - People who ever had cancer or malignancy (%)
Mental Health - People who have little interest in doing things (%)
Mental Health - People feeling down, depressed, or hopeless (%)
Mental Health - People who have trouble sleeping or sleeping too much (%)
Mental Health - People feeling tired or having little energy (%)
Mental Health - People with poor appetite or overeating (%)
Mental Health - People feeling bad about themself (%)
Mental Health - People who have trouble concentrating on things (%)
Mental Health - People moving or speaking slowly or too fast (%)
Mental Health - People having thoughts they would be better off dead (%)
Oral Health - Average years since last visit a dentist
Oral Health - People embarrassed because of mouth (%)
Oral Health - People with gum disease (%)
Oral Health - General health of teeth and gums (%)
Oral Health - Average days a week using dental floss/device
Oral Health - Average days a week using mouthwash for dental problem
Oral Health - Average number of teeth
Pesticide Use - Households using pesticides to control insects (%)
Pesticide Use - Households using pesticides to kill weeds (%)
Physical Activity - People doing vigorous-intensity work activities (%)
Physical Activity - People doing moderate-intensity work activities (%)
Physical Activity - People walking or bicycling (%)
Physical Activity - People doing vigorous-intensity recreational activities (%)
Physical Activity - People doing moderate-intensity recreational activities (%)
Physical Activity - Average hours a day doing sedentary activities
Physical Activity - Average hours a day watching TV or videos
Physical Activity - Average hours a day using computer
Physical Functioning - People having limitations keeping them from working (%)
Physical Functioning - People limited in amount of work they can do (%)
Physical Functioning - People that need special equipment to walk (%)
Physical Functioning - People experiencing confusion/memory problems (%)
Physical Functioning - People requiring special healthcare equipment (%)
Prescription Medications - Average number of prescription medicines taking
Preventive Aspirin Use - Adults 40+ taking low-dose aspirin (%)
Reproductive Health - Vaginal deliveries (%)
Reproductive Health - Cesarean deliveries (%)
Reproductive Health - Deliveries resulted in a live birth (%)
Reproductive Health - Pregnancies resulted in a delivery (%)
Reproductive Health - Women breastfeeding newborns (%)
Reproductive Health - Women that had a hysterectomy (%)
Reproductive Health - Women that had both ovaries removed (%)
Reproductive Health - Women that have ever taken birth control pills (%)
Reproductive Health - Women taking birth control pills (%)
Reproductive Health - Women that have ever used Depo-Provera or injectables (%)
Reproductive Health - Women that have ever used female hormones (%)
Sexual Behavior - People 18+ that ever had sex (vaginal, anal, or oral) (%)
Sexual Behavior - Males 18+ that ever had vaginal sex with a woman (%)
Sexual Behavior - Males 18+ that ever performed oral sex on a woman (%)
Sexual Behavior - Males 18+ that ever had anal sex with a woman (%)
Sexual Behavior - Males 18+ that ever had any sex with a man (%)
Sexual Behavior - Females 18+ that ever had vaginal sex with a man (%)
Sexual Behavior - Females 18+ that ever performed oral sex on a man (%)
Sexual Behavior - Females 18+ that ever had anal sex with a man (%)
Sexual Behavior - Females 18+ that ever had any kind of sex with a woman (%)
Sexual Behavior - Average age people first had sex
Sexual Behavior - Average number of female sex partners in lifetime (males 18+)
Sexual Behavior - Average number of female vaginal sex partners in lifetime (males 18+)
Sexual Behavior - Average age people first performed oral sex on a woman (18+)
Sexual Behavior - Average number of woman performed oral sex on in lifetime (18+)
Sexual Behavior - Average number of male sex partners in lifetime (males 18+)
Sexual Behavior - Average number of male anal sex partners in lifetime (males 18+)
Sexual Behavior - Average age people first performed oral sex on a man (18+)
Sexual Behavior - Average number of male oral sex partners in lifetime (18+)
Sexual Behavior - People using protection when performing oral sex (%)
Sexual Behavior - Average number of times people have vaginal or anal sex a year
Sexual Behavior - People having sex without condom (%)
Sexual Behavior - Average number of male sex partners in lifetime (females 18+)
Sexual Behavior - Average number of male vaginal sex partners in lifetime (females 18+)
Sexual Behavior - Average number of female sex partners in lifetime (females 18+)
Sexual Behavior - Circumcised males 18+ (%)
Sleep Disorders - Average hours sleeping at night
Sleep Disorders - People that has trouble sleeping (%)
Smoking-Cigarette Use - People smoking cigarettes (%)
Taste & Smell - People 40+ having problems with smell (%)
Taste & Smell - People 40+ having problems with taste (%)
Taste & Smell - People 40+ that ever had wisdom teeth removed (%)
Taste & Smell - People 40+ that ever had tonsils teeth removed (%)
Taste & Smell - People 40+ that ever had a loss of consciousness because of a head injury (%)
Taste & Smell - People 40+ that ever had a broken nose or other serious injury to face or skull (%)
Taste & Smell - People 40+ that ever had two or more sinus infections (%)
Weight - Average height (inches)
Weight - Average weight (pounds)
Weight - Average BMI
Weight - People that are obese (%)
Weight - People that ever were obese (%)
Weight - People trying to lose weight (%)
According to our research of Ohio and other state lists, there were 8 registered sex offenders living in Willowick, Ohio as of April 27, 2024 . The ratio of all residents to sex offenders in Willowick is 1,761 to 1.The ratio of registered sex offenders to all residents in this city is much lower than the state average.
Officers per 1,000 residents here:
1.57Ohio average:
2.31
Latest news from Willowick, OH collected exclusively by city-data.com from local newspapers, TV, and radio stations
Ancestries: German (14.5%), Italian (13.1%), Irish (5.7%), Croatian (5.0%), Slovene (5.0%), American (4.5%).
Current Local Time:
Land area: 2.52 square miles.
Population density: 5,621 people per square mile (average).
466 residents are foreign born (2.9% Europe ).
Median real estate property taxes paid for housing units with mortgages in 2022: $3,561 (2.0%)Median real estate property taxes paid for housing units with no mortgage in 2022: $2,925 (2.1%)
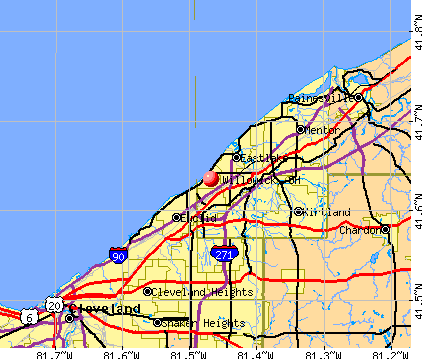
Nearest city with pop. 50,000+: Euclid, OH
Nearest city with pop. 200,000+: Cleveland, OH
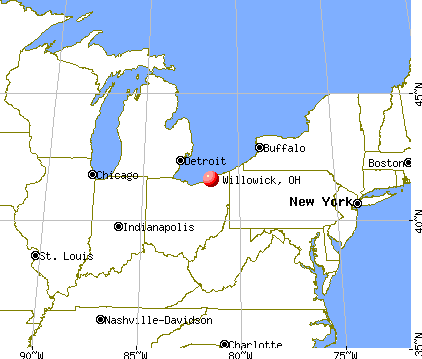
Nearest city with pop. 1,000,000+: Chicago, IL
Nearest cities:
Lakeline, OH (1.3 miles),
Latitude: 41.64 N, Longitude: 81.47 W
Daytime population change due to commuting: -4,425 (-31.2%)Workers who live and work in this city: 1,867 (24.6%)
Area code commonly used in this area: 440
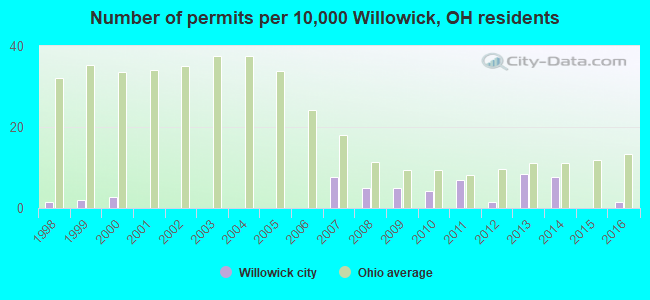
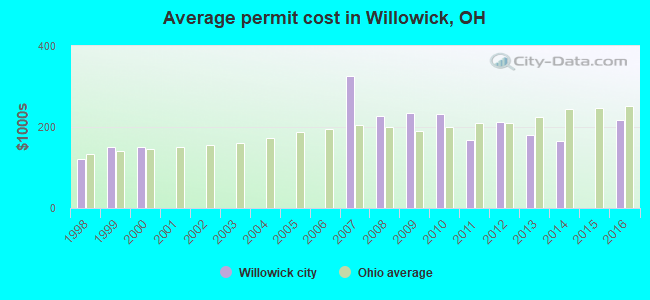
Single-family new house construction building permits:
2016: 2 buildings , average cost: $217,3002014: 11 buildings , average cost: $164,6002013: 12 buildings , average cost: $180,9002012: 2 buildings , average cost: $212,0002011: 10 buildings , average cost: $167,5002010: 6 buildings , average cost: $233,3002009: 7 buildings , average cost: $234,3002008: 7 buildings , average cost: $227,1002007: 11 buildings , average cost: $326,1002000: 4 buildings , average cost: $150,0001999: 3 buildings , average cost: $150,0001998: 2 buildings , average cost: $120,000Unemployment in December 2023:
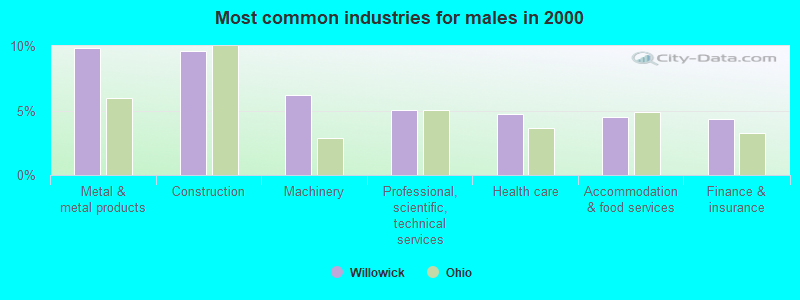
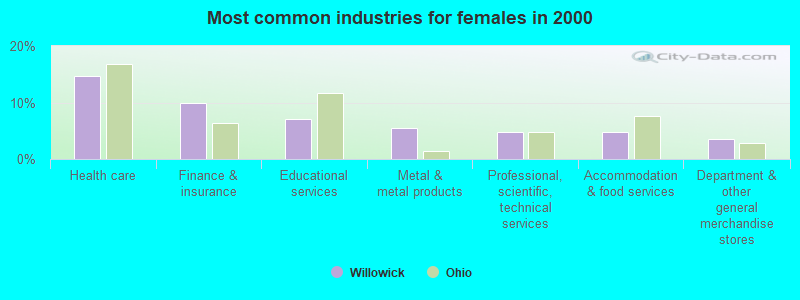
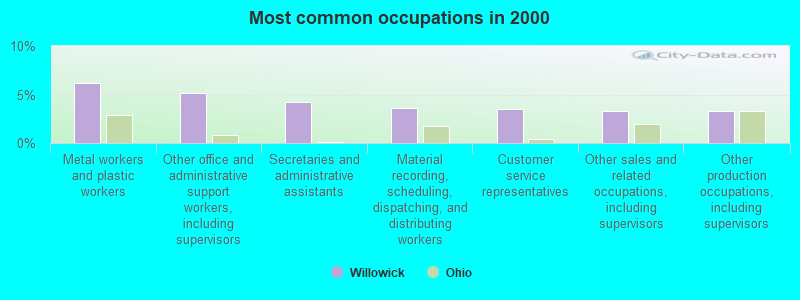
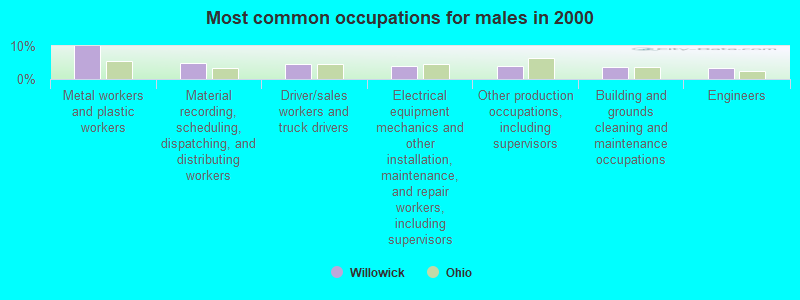
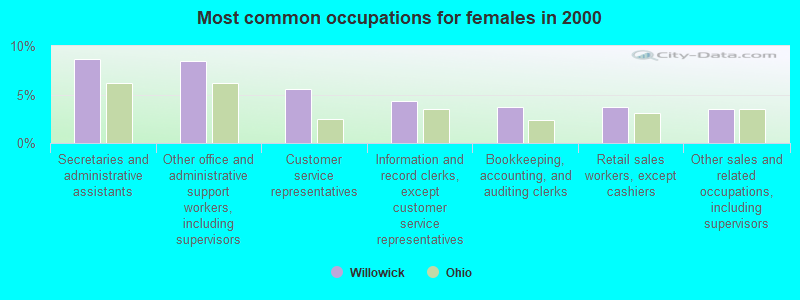
Most common occupations in Willowick, OH (%)
Both Males Females
Metal workers and plastic workers (6.2%)
Other office and administrative support workers, including supervisors (5.2%)
Secretaries and administrative assistants (4.2%)
Material recording, scheduling, dispatching, and distributing workers (3.6%)
Customer service representatives (3.5%)
Other sales and related occupations, including supervisors (3.3%)
Other production occupations, including supervisors (3.3%)
Metal workers and plastic workers (10.0%)
Material recording, scheduling, dispatching, and distributing workers (4.8%)
Driver/sales workers and truck drivers (4.4%)
Electrical equipment mechanics and other installation, maintenance, and repair workers, including supervisors (4.0%)
Other production occupations, including supervisors (4.0%)
Building and grounds cleaning and maintenance occupations (3.6%)
Engineers (3.3%)
Secretaries and administrative assistants (8.6%)
Other office and administrative support workers, including supervisors (8.5%)
Customer service representatives (5.6%)
Information and record clerks, except customer service representatives (4.3%)
Bookkeeping, accounting, and auditing clerks (3.7%)
Retail sales workers, except cashiers (3.7%)
Other sales and related occupations, including supervisors (3.5%)
Tornado activity:
Willowick-area historical tornado activity is below Ohio state average. It is 19% smaller than the overall U.S. average.
On 6/8/1953, a category F4 (max. wind speeds 207-260 mph) tornado 16.0 miles away from the Willowick city center killed 17 people and injured 379 people .
On 5/31/1985, a category F5 (max. wind speeds 261-318 mph) tornado 34.3 miles away from the city center killed 18 people and injured 310 people and caused between $50,000,000 and $500,000,000 in damages.
Earthquake activity:
Willowick-area historical earthquake activity is significantly above Ohio state average. It is 53% smaller than the overall U.S. average. On 9/25/1998 at 19:52:52, a magnitude 5.2 (4.8 MB, 4.3 MS, 5.2 LG, 4.5 MW, Depth: 3.1 mi, Class: Moderate, Intensity: VI - VII) earthquake occurred 56.4 miles away from the city center On 1/31/1986 at 16:46:43, a magnitude 5.0 (5.0 MB) earthquake occurred 16.1 miles away from the city center On 8/23/2011 at 17:51:04, a magnitude 5.8 (5.8 MW, Depth: 3.7 mi) earthquake occurred 318.8 miles away from Willowick center On 6/10/2019 at 14:50:45, a magnitude 4.0 (4.0 MB, Depth: 1.2 mi, Class: Light, Intensity: IV - V) earthquake occurred 3.1 miles away from the city center On 7/27/1980 at 18:52:21, a magnitude 5.2 (5.1 MB, 4.7 MS, 5.0 UK, 5.2 UK) earthquake occurred 271.1 miles away from Willowick center On 12/31/2011 at 20:05:01, a magnitude 4.0 (4.0 ML, Depth: 3.1 mi) earthquake occurred 54.0 miles away from Willowick center Magnitude types: regional Lg-wave magnitude (LG), body-wave magnitude (MB), local magnitude (ML), surface-wave magnitude (MS), moment magnitude (MW) Natural disasters: The number of natural disasters in Lake County (12) is smaller than the US average (15).Major Disasters (Presidential) Declared: 7Emergencies Declared: 4Floods: 6, Storms: 5, Tornadoes: 2, Winds: 2, Blizzard: 1, Heavy Rain: 1, Hurricane: 1, Power Outage: 1, Snow: 1, Snowstorm: 1, Tropical Storm: 1, Other: 1 (Note: some incidents may be assigned to more than one category). Hospitals and medical centers near Willowick: LAURELWOOD HOSPITAL (Hospital, about 3 miles away; WILLOUGHBY, OH)
MANOR CARE WILLOUGHBY (Nursing Home, about 3 miles away; WILLOUGHBY, OH)
FAIRMOUNT HEALTH CENTER (Nursing Home, about 3 miles away; WILLOUGHBY, OH)
WICKLIFFE COUNTRY PLACE (Nursing Home, about 3 miles away; WICKLIFFE, OH)
MANORCARE HEALTH SERVICES-WILLOUGHBY (Nursing Home, about 3 miles away; WILLOUGHBY, OH)
WILLCARE (Home Health Center, about 3 miles away; EUCLID, OH)
MEDSOURCE HOME CARE (Home Health Center, about 3 miles away; EUCLID, OH)
Amtrak station near Willowick: 15 miles: CLEVELAND (200 CLEVELAND MEMORIAL SHOREWAY) Services: ticket office, partially wheelchair accessible, enclosed waiting area, public restrooms, public payphones, vending machines, free short-term parking, paid long-term parking, taxi stand, public transit connection.
Colleges/universities with over 2000 students nearest to Willowick:
Lakeland Community College (about 6 miles; Kirtland, OH ; Full-time enrollment: 6,170)
John Carroll University (about 11 miles; University Heights, OH ; FT enrollment: 3,546)
Case Western Reserve University (about 12 miles; Cleveland, OH ; FT enrollment: 7,034)
Cleveland State University (about 14 miles; Cleveland, OH ; FT enrollment: 14,161)
Cuyahoga Community College District (about 15 miles; Cleveland, OH ; FT enrollment: 20,271)
Baldwin Wallace University (about 27 miles; Berea, OH ; FT enrollment: 3,699)
Kent State University at Kent (about 35 miles; Kent, OH ; FT enrollment: 25,431)
Public elementary/middle schools in Willowick:
See full list of schools located in Willowick Library in Willowick: WILLOUGHBY-EASTLAKE PUBLIC LIBRARY Operating income: $4,575,892; Location: 263 E. 305 STREET; 199,254 books ; 18,801 e-books ; 38,731 audio materials ; 28,611 video materials ; 3 local licensed databases ; 266 state licensed databases ; 40 other licensed databases ; 856 print serial subscriptions ; 1 electronic serial subscriptions )
Birthplace of: Mike Golic - Football player.
Lake County has a predicted average indoor radon screening level between 2 and 4 pCi/L (pico curies per liter) - Moderate Potential Average household size: This city:
2.3 peopleOhio:
2.4 people
Percentage of family households: This city:
63.2%Whole state:
65.0%
Percentage of households with unmarried partners: This city:
6.6%Whole state:
6.8%
Likely homosexual households (counted as self-reported same-sex unmarried-partner households)
Lesbian couples: 0.3% of all households Gay men: 0.1% of all households
2 people in other noninstitutional facilities in 2010people in religious group quarters in 2000
Banks with branches in Willowick (2011 data):
New York Community Bank: Shoregate Branch at 29950 Lakeshore Boulevard, branch established on 1921/01/01. Info updated 2010/03/29: Bank assets: $39,468.7 mil, Deposits: $20,709.8 mil, headquarters in Westbury, NY, positive income , Commercial Lending Specialization, 247 total offices , Holding Company: New York Community Bancorp, Inc.
Fifth Third Bank: Willowick Banking Center Branch at 30160 Lakeshore Boulevard, branch established on 1985/06/11. Info updated 2009/10/05: Bank assets: $114,540.4 mil, Deposits: $89,689.1 mil, headquarters in Cincinnati, OH, positive income , Commercial Lending Specialization, 1378 total offices , Holding Company: Fifth Third Bancorp
JPMorgan Chase Bank, National Association: Shoregate Branch at 295 Shoregate Mall, branch established on 1955/11/21. Info updated 2011/11/10: Bank assets: $1,811,678.0 mil, Deposits: $1,190,738.0 mil, headquarters in Columbus, OH, positive income , International Specialization, 5577 total offices , Holding Company: Jpmorgan Chase & Co.
U.S. Bank National Association: Willowick Giant Eagle Branch at 30320 Lakeshore Boulevard, branch established on 2006/06/26. Info updated 2012/01/30: Bank assets: $330,470.8 mil, Deposits: $236,091.5 mil, headquarters in Cincinnati, OH, positive income , 3121 total offices , Holding Company: U.S. Bancorp
PNC Bank, National Association: Shoregate Branch at 210 East 305th Street, branch established on 1978/03/02. Info updated 2012/03/20: Bank assets: $263,309.6 mil, Deposits: $197,343.0 mil, headquarters in Wilmington, DE, positive income , Commercial Lending Specialization, 3085 total offices , Holding Company: Pnc Financial Services Group, Inc., The
KeyBank National Association: Willowick Branch at 31000 Lake Shore Boulevard, branch established on 1970/12/03. Info updated 2008/03/03: Bank assets: $86,198.8 mil, Deposits: $64,214.8 mil, headquarters in Cleveland, OH, positive income , Commercial Lending Specialization, 1067 total offices , Holding Company: Keycorp
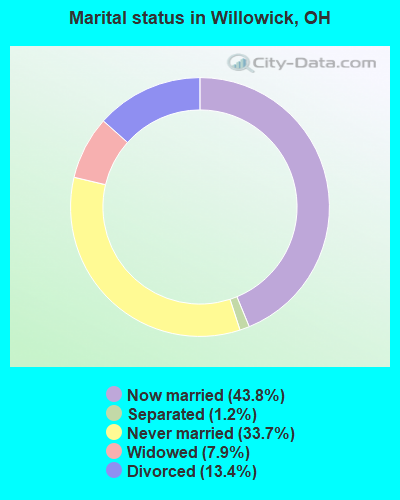
For population 15 years and over in Willowick:
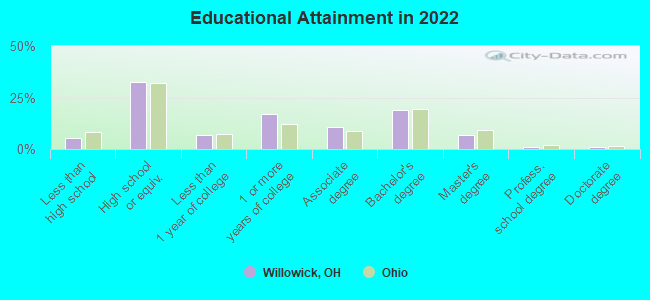
Never married: 33.7%Now married: 43.8%Separated: 1.2%Widowed: 7.9%Divorced: 13.4% For population 25 years and over in Willowick:
High school or higher: 94.8%Bachelor's degree or higher: 24.9%Graduate or professional degree: 7.7%Unemployed: 4.5%Mean travel time to work (commute): 17.4 minutes
Education Gini index (Inequality in education) Here:
8.8Ohio average:
11.0
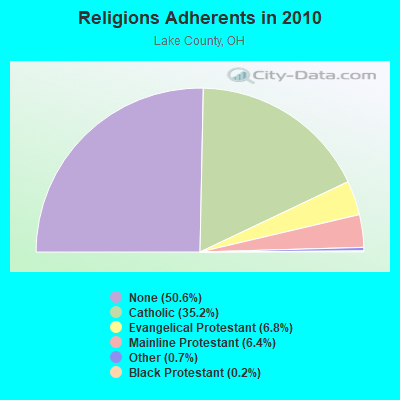
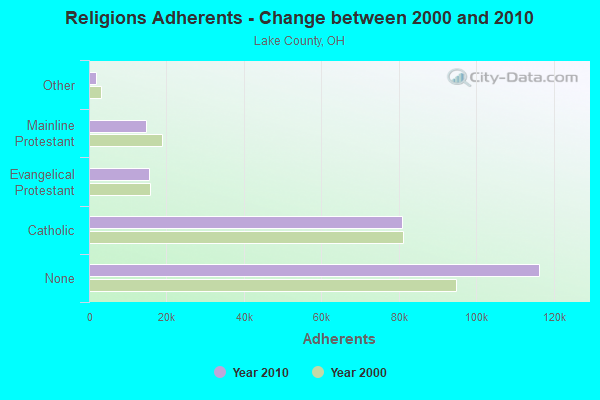
Religion statistics for Willowick, OH (based on Lake County data)
Religion Adherents Congregations Catholic 80,869 16 Evangelical Protestant 15,598 88 Mainline Protestant 14,757 40 Other 1,715 16 Black Protestant 552 6 Orthodox 216 1 None 116,334 -
Source: Clifford Grammich, Kirk Hadaway, Richard Houseal, Dale E.Jones, Alexei Krindatch, Richie Stanley and Richard H.Taylor. 2012. 2010 U.S.Religion Census: Religious Congregations & Membership Study. Association of Statisticians of American Religious Bodies. Jones, Dale E., et al. 2002. Congregations and Membership in the United States 2000. Nashville, TN: Glenmary Research Center. Graphs represent county-level data
Food Environment Statistics: Number of grocery stores : 32This county :
1.37 / 10,000 pop.Ohio :
1.89 / 10,000 pop.
Number of supercenters and club stores : 4Lake County :
0.17 / 10,000 pop.Ohio :
0.13 / 10,000 pop.
Number of convenience stores (no gas) : 30Lake County :
1.29 / 10,000 pop.Ohio :
1.25 / 10,000 pop.
Number of convenience stores (with gas) : 72Lake County :
3.09 / 10,000 pop.Ohio :
2.93 / 10,000 pop.
Number of full-service restaurants : 172Lake County :
7.38 / 10,000 pop.State :
6.25 / 10,000 pop.
Adult obesity rate : This county :
28.4%Ohio :
29.1%
Low-income preschool obesity rate : Lake County :
10.4%Ohio :
11.9%
Health and Nutrition: Healthy diet rate : Willowick:
52.6%Ohio:
50.4%
Average overall health of teeth and gums : Willowick:
49.9%Ohio:
47.8%
People feeling badly about themselves : Willowick:
20.0%Ohio:
20.6%
People not drinking alcohol at all : This city:
10.6%Ohio:
10.4%
Average hours sleeping at night : Overweight people : This city:
34.9%Ohio:
34.3%
General health condition : Willowick:
58.0%Ohio:
57.0%
Average condition of hearing : Willowick:
77.2%State:
79.1%
More about Health and Nutrition of Willowick, OH Residents
Local government employment and payroll (March 2022)
Function
Full-time employees
Monthly full-time payroll
Average yearly full-time wage
Part-time employees
Monthly part-time payroll
Police Protection - Officers
21 $177,271 $101,298 0 $0 Financial Administration
12 $72,115 $72,115 0 $0 Streets and Highways
9 $39,822 $53,096 0 $0 Police - Other
8 $33,792 $50,688 3 $2,343 Sewerage
5 $23,793 $57,103 0 $0 Parks and Recreation
4 $17,371 $52,113 5 $3,151 Fire - Other
1 $8,193 $98,316 0 $0 Other Government Administration
1 $4,099 $49,188 8 $8,436 Housing and Community Development (Local)
1 $4,336 $52,032 1 $2,243 Judicial and Legal
0 $0 2 $6,574 Firefighters
0 $0 56 $111,715
Totals for Government
62 $380,791 $73,701 75 $134,463
Willowick government finances - Expenditure in 2021 (per resident):
Construction - Sewerage: $1,347,000 ($95.27)
Current Operations - Local Fire Protection: $4,295,000 ($303.77)
Sewerage: $2,671,000 ($188.91)Police Protection: $1,664,000 ($117.69)Regular Highways: $1,228,000 ($86.85)Parks and Recreation: $928,000 ($65.63)Central Staff Services: $888,000 ($62.81)Financial Administration: $830,000 ($58.70)Housing and Community Development: $422,000 ($29.85)General - Other: $277,000 ($19.59)Judicial and Legal Services: $174,000 ($12.31)Health - Other: $140,000 ($9.90)General - Interest on Debt: $10,000 ($0.71)
Intergovernmental to State - General - Other: $141,000 ($9.97)
Other Capital Outlay - General - Other: $1,151,000 ($81.41)
Sewerage: $798,000 ($56.44)Total Salaries and Wages: $516,000 ($36.49)
Willowick government finances - Revenue in 2021 (per resident):
Charges - Sewerage: $2,734,000 ($193.37)
Other: $616,000 ($43.57)Miscellaneous - General Revenue - Other: $401,000 ($28.36)
Interest Earnings: $162,000 ($11.46)Fines and Forfeits: $98,000 ($6.93)Special Assessments: $68,000 ($4.81)State Intergovernmental - Other: $2,639,000 ($186.65)
General Local Government Support: $1,715,000 ($121.30)Sewerage: $752,000 ($53.19)Tax - Property: $4,164,000 ($294.50)
Individual Income: $3,190,000 ($225.62)Other License: $325,000 ($22.99)Other Selective Sales: $216,000 ($15.28)
Willowick government finances - Cash and Securities in 2021 (per resident):
Bond Funds - Cash and Securities: $3,311,000 ($234.17)
Other Funds - Cash and Securities: $4,179,000 ($295.57)
Businesses in Willowick, OH
Name Count Name Count
ALDI 1 KFC 1 Arby's 1 McDonald's 1 AutoZone 1 Rite Aid 1 Avenue 1 Taco Bell 1 Burger King 1 True Value 1 Fashion Bug 1 U-Haul 2 GNC 1 Walmart 1 H&R Block 1 Wendy's 1
Strongest AM radio stations in Willowick:
WKNR (850 AM; 50 kW; CLEVELAND, OH; Owner: CARON BROADCASTING, INC.)
WTAM (1100 AM; 50 kW; CLEVELAND, OH; Owner: JACOR BROADCASTING CORPORATION)
WHK (1220 AM; 50 kW; CLEVELAND, OH; Owner: CARON BROADCASTING, INC.)
WELW (1330 AM; 0 kW; WILLOUGHBY, OH)
WWMK (1260 AM; 10 kW; CLEVELAND, OH; Owner: ABC, INC.)
WRMR (1420 AM; 5 kW; CLEVELAND, OH; Owner: CLEVELAND CLASSICAL RADIO, LLC)
WJR (760 AM; 50 kW; DETROIT, MI; Owner: ABC, INC.)
WERE (1300 AM; 5 kW; CLEVELAND, OH)
WJMO (1490 AM; 1 kW; CLEVELAND HEIGHTS, OH; Owner: BLUE CHIP BROADCASTING LICENSES, LTD.)
WFDF (910 AM; 50 kW; FLINT, MI; Owner: ABC, INC.)
WDFN (1130 AM; 50 kW; DETROIT, MI; Owner: AMFM RADIO LICENSES, L.L.C.)
WCUE (1150 AM; 5 kW; CUYAHOGA FALLS, OH; Owner: FAMILY STATIONS, INC.)
WWJ (950 AM; 50 kW; DETROIT, MI; Owner: INFINITY BROADCASTING OPERATIONS, INC.)
Strongest FM radio stations in Willowick:
WENZ (107.9 FM; CLEVELAND, OH; Owner: RADIO ONE LICENSES, LLC)
WFHM-FM (95.5 FM; CLEVELAND, OH; Owner: SCA LICENSE CORPORATION)
WMJI (105.7 FM; CLEVELAND, OH; Owner: CITICASTERS LICENSES, L.P.)
WXTM (92.3 FM; CLEVELAND HEIGHTS, OH; Owner: INFINITY RADIO OPERATIONS INC.)
WQAL (104.1 FM; CLEVELAND, OH; Owner: INFINITY RADIO OPERATIONS INC.)
WDOK (102.1 FM; CLEVELAND, OH; Owner: INFINITY RADIO OPERATIONS INC.)
WMVX (106.5 FM; CLEVELAND, OH; Owner: JACOR BROADCASTING CORPORATION)
WJCU (88.7 FM; UNIVERSITY HEIGHTS, OH; Owner: JOHN CARROLL UNIVERSITY)
WRUW-FM (91.1 FM; CLEVELAND, OH; Owner: CASE WESTERN RESERVE UNIVERSITY)
WNCX (98.5 FM; CLEVELAND, OH; Owner: INFINITY RADIO OF CLEVELAND INC.)
WMMS (100.7 FM; CLEVELAND, OH; Owner: CITICASTERS LICENSES, L.P.)
WKHR (91.5 FM; BAINBRIDGE, OH; Owner: KENSTON LOCAL SCHOOL DISTRICT)
WCRF-FM (103.3 FM; CLEVELAND, OH; Owner: THE MOODY BIBLE INSTITUTE OF CHICAGO)
WCPN (90.3 FM; CLEVELAND, OH; Owner: IDEASTREAM)
WZAK (93.1 FM; CLEVELAND, OH; Owner: RADIO ONE LICENSES, LLC)
WGAR-FM (99.5 FM; CLEVELAND, OH; Owner: CITICASTERS LICENSES, L.P.)
WKSV (89.1 FM; THOMPSON, OH; Owner: KENT STATE UNIVERSITY)
WKSU-FM (89.7 FM; KENT, OH; Owner: KENT STATE UNIVERSITY)
WQMX (94.9 FM; MEDINA, OH; Owner: RUBBER CITY RADIO GROUP, INC)
WAKS (96.5 FM; AKRON, OH; Owner: CAPSTAR TX LIMITED PARTNERSHIP)
TV broadcast stations around Willowick:
WRAP-CA (Channel 32; CLEVELAND, OH; Owner: COMMERCIAL BROADCASTING CORP.)
WXOX-LP (Channel 65; CLEVELAND, OH; Owner: VENTURE TECHNOLOGIES GROUP, LLC)
W53AX (Channel 53; CLEVELAND, OH; Owner: WORD OF GOD FELLOWSHIP, INC.)
WKYC-TV (Channel 3; CLEVELAND, OH; Owner: WKYC-TV, INC.)
WOIO (Channel 19; SHAKER HEIGHTS, OH; Owner: RAYCOM NATIONAL, INC.)
WBNX-TV (Channel 55; AKRON, OH; Owner: WINSTON BROADCASTING NETWORK, INC.)
W35AX (Channel 35; CLEVELAND, OH; Owner: MEDIA-COM TELEVISION, INC.)
WQHS-TV (Channel 61; CLEVELAND, OH; Owner: UNIVISION CLEVELAND LLC)
WEWS-TV (Channel 5; CLEVELAND, OH; Owner: SCRIPPS HOWARD BROADCASTING COMPANY)
WUAB (Channel 43; LORAIN, OH; Owner: RAYCOM NATIONAL, INC.)
W51BI (Channel 51; KIRTLAND, OH; Owner: TRINITY BROADCASTING NETWORK)
WJW (Channel 8; CLEVELAND, OH; Owner: WJW LICENSE, INC.)
WVIZ (Channel 25; CLEVELAND, OH; Owner: IDEASTREAM)
WEAO (Channel 49; AKRON, OH; Owner: NORTHEASTERN EDUCATIONAL TELEVISION OF OHIO, INC.)
WVPX (Channel 23; AKRON, OH; Owner: PAXSON AKRON LICENSE, INC.)
National Bridge Inventory (NBI) Statistics 4 Number of bridges33ft / 9.6m Total length63,912 Total average daily traffic1,978 Total average daily truck traffic
FCC Registered Antenna Towers: 1
Mikhail Raznobriadsev, Fern Drive (Lat: 41.629889 Lon: -81.465333), Type: 38.1, Structure height: 39085 m, Overall height: 36.6 m, Registrant: Mobilitie, LLC, Mraznobriadsev@mobilitie.Com, , Atlan-ta, Phone: (404) 978-2457 FCC Registered Broadcast Land Mobile Towers: 1
31230 Vine St (Lat: 41.642833 Lon: -81.427611), Call Sign: KCW378, Assigned Frequencies: 46.1400 MHz, 46.2000 MHz, 46.3600 MHz, Grant Date: 01/24/2013, Expiration Date: 02/25/2023, Cancellation Date: 04/29/2023, Registrant: Willowick Fire Department, 30435 Lakeshore Boulevard, Willowick, OH 44095, Phone: (440) 585-1202, Fax: (440) 585-4112, Email:
FCC Registered Microwave Towers: 2
WILLOWICK, 30825 Euclid Ave (Lat: 41.621139 Lon: -81.453722), Type: Gtower, Structure height: 134.1 m, Overall height: 137.2 m, Call Sign: WNTR656, Assigned Frequencies: 6063.80 MHz, 6093.45 MHz, 6123.10 MHz, 6152.75 MHz, 6063.80 MHz, 6093.45 MHz, 6123.10 MHz, 6152.75 MHz, 6063.80 MHz, 6093.45 MHz... (+36 more), Grant Date: 04/12/2018, Expiration Date: 06/28/2028, Registrant: Lake County Telecommunications, 125 East Erie Street, Painesville, OH 44077, Phone: (440) 350-5555, Fax: (440) 350-2599, Email:
OH-CLE0306A, 31230 E 314th St (Lat: 41.641333 Lon: -81.467028), Type: Pole, Structure height: 45.7 m, Call Sign: WQNA526, Assigned Frequencies: 10855.0 MHz, 19575.0 MHz, 10935.0 MHz, 19675.0 MHz, Grant Date: 02/19/2021, Expiration Date: 11/23/2030, Cancellation Date: 09/15/2021, Certifier: Nadja S Sodos-Wallace, Registrant: T-Mobile Usa, Inc., 12920 Se 38th Street, Bellevue, WA 98006, Phone: (425) 383-8402, Fax: (425) 383-4840, Email:
FCC Registered Amateur Radio Licenses: 60 (
See the full list of FCC Registered Amateur Radio Licenses in Willowick )
FAA Registered Aircraft: 2
Aircraft: OLANDESE PHILLIP J RANS S-6ES (Category: Land, Seats: 2, Weight: Up to 12,499 Pounds), Engine: ROTAX 912ULS SERIES (100 HP) (Reciprocating)N-Number: 117WP, N117WP, N-117WP, Serial Number: 01091916, Year manufactured: 2009, Airworthiness Date: 09/05/2009, Certificate Issue Date: 06/05/2019Registrant (Individual): Vitas R Cyvas, 28613 Cresthaven Dr, Willowick, OH 44095Aircraft: FLIGHT DESIGN GMBH CTLS (Category: Land, Seats: 2, Weight: Up to 12,499 Pounds), Engine: ROTAX 912ULS SERIES (100 HP) (4 Cycle)N-Number: 308SR, N308SR, N-308SR, Serial Number: F-10-06-03, Year manufactured: 2010, Airworthiness Date: 08/14/2010, Certificate Issue Date: 12/01/2018Registrant (Individual): Rona W Mitrovich, 159 Seaborn Dr, Willowick, OH 44095
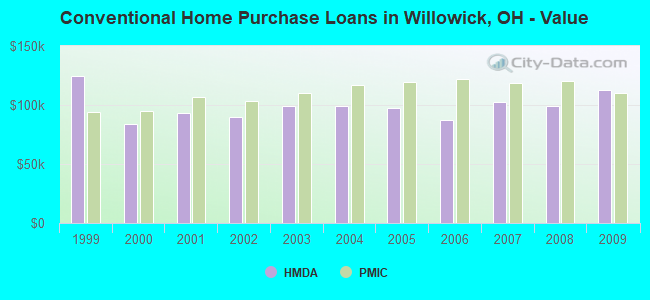
Home Mortgage Disclosure Act Aggregated Statistics For Year 2009(Based on 5 full tracts) A) FHA, FSA/RHS & VA B) Conventional C) Refinancings D) Home Improvement Loans E) Loans on Dwellings For 5+ Families F) Non-occupant Loans on Number Average Value Number Average Value Number Average Value Number Average Value Number Average Value Number Average Value
LOANS ORIGINATED 110 $111,391 54 $112,907 188 $103,255 14 $32,143 1 $3,350,000 20 $101,150 APPLICATIONS APPROVED, NOT ACCEPTED 2 $112,000 7 $96,286 24 $103,083 7 $33,571 0 $0 3 $68,000 APPLICATIONS DENIED 6 $121,167 5 $147,400 76 $123,461 23 $27,739 0 $0 5 $60,800 APPLICATIONS WITHDRAWN 9 $102,333 8 $79,875 45 $125,289 2 $10,000 0 $0 3 $86,000 FILES CLOSED FOR INCOMPLETENESS 0 $0 0 $0 8 $109,625 1 $40,000 0 $0 0 $0
Aggregated Statistics For Year 2008(Based on 5 full tracts) A) FHA, FSA/RHS & VA B) Conventional C) Refinancings D) Home Improvement Loans F) Non-occupant Loans on G) Loans On Manufactured Number Average Value Number Average Value Number Average Value Number Average Value Number Average Value Number Average Value
LOANS ORIGINATED 79 $114,127 76 $99,171 115 $106,591 28 $15,357 24 $78,417 0 $0 APPLICATIONS APPROVED, NOT ACCEPTED 3 $140,000 2 $81,500 19 $97,579 5 $20,000 1 $83,000 1 $21,000 APPLICATIONS DENIED 10 $117,100 8 $135,625 102 $116,931 35 $14,200 7 $63,000 1 $11,000 APPLICATIONS WITHDRAWN 4 $112,000 10 $62,500 18 $122,944 3 $54,667 2 $55,500 0 $0 FILES CLOSED FOR INCOMPLETENESS 1 $102,000 2 $91,500 9 $131,222 1 $25,000 2 $86,500 0 $0
Aggregated Statistics For Year 2007(Based on 5 full tracts) A) FHA, FSA/RHS & VA B) Conventional C) Refinancings D) Home Improvement Loans F) Non-occupant Loans on G) Loans On Manufactured Number Average Value Number Average Value Number Average Value Number Average Value Number Average Value Number Average Value
LOANS ORIGINATED 39 $128,256 173 $102,532 144 $105,826 41 $31,854 32 $84,031 0 $0 APPLICATIONS APPROVED, NOT ACCEPTED 3 $109,333 16 $91,562 47 $107,319 14 $58,643 7 $72,286 0 $0 APPLICATIONS DENIED 1 $114,000 17 $102,118 159 $123,327 39 $32,769 2 $114,000 1 $22,000 APPLICATIONS WITHDRAWN 5 $127,600 10 $95,100 39 $117,846 6 $33,833 1 $97,000 0 $0 FILES CLOSED FOR INCOMPLETENESS 0 $0 2 $215,000 16 $110,250 0 $0 0 $0 0 $0
Aggregated Statistics For Year 2006(Based on 5 full tracts) A) FHA, FSA/RHS & VA B) Conventional C) Refinancings D) Home Improvement Loans F) Non-occupant Loans on G) Loans On Manufactured Number Average Value Number Average Value Number Average Value Number Average Value Number Average Value Number Average Value
LOANS ORIGINATED 26 $134,577 251 $87,618 242 $88,306 38 $41,763 67 $77,716 1 $126,000 APPLICATIONS APPROVED, NOT ACCEPTED 1 $133,000 23 $83,391 50 $88,520 11 $29,273 3 $81,333 2 $49,500 APPLICATIONS DENIED 3 $120,667 45 $92,178 182 $101,819 28 $46,214 14 $77,714 0 $0 APPLICATIONS WITHDRAWN 2 $112,500 24 $91,708 84 $110,452 7 $17,000 5 $99,200 0 $0 FILES CLOSED FOR INCOMPLETENESS 1 $134,000 11 $95,727 39 $121,179 1 $215,000 1 $34,000 0 $0
Aggregated Statistics For Year 2005(Based on 5 full tracts) A) FHA, FSA/RHS & VA B) Conventional C) Refinancings D) Home Improvement Loans E) Loans on Dwellings For 5+ Families F) Non-occupant Loans on G) Loans On Manufactured Number Average Value Number Average Value Number Average Value Number Average Value Number Average Value Number Average Value Number Average Value
LOANS ORIGINATED 43 $129,116 258 $97,709 321 $100,891 36 $29,278 1 $16,000,000 37 $82,919 2 $71,500 APPLICATIONS APPROVED, NOT ACCEPTED 1 $122,000 23 $91,174 38 $104,105 7 $29,429 0 $0 7 $57,429 1 $36,000 APPLICATIONS DENIED 0 $0 33 $101,939 182 $107,198 49 $44,939 0 $0 10 $112,700 5 $45,400 APPLICATIONS WITHDRAWN 5 $127,000 19 $93,000 120 $124,033 22 $107,455 0 $0 3 $102,667 1 $14,000 FILES CLOSED FOR INCOMPLETENESS 0 $0 11 $97,364 30 $111,633 2 $79,000 0 $0 1 $112,000 1 $9,000
Aggregated Statistics For Year 2004(Based on 5 full tracts) A) FHA, FSA/RHS & VA B) Conventional C) Refinancings D) Home Improvement Loans E) Loans on Dwellings For 5+ Families F) Non-occupant Loans on Number Average Value Number Average Value Number Average Value Number Average Value Number Average Value Number Average Value
LOANS ORIGINATED 42 $126,500 189 $99,545 398 $99,003 39 $44,692 0 $0 21 $83,381 APPLICATIONS APPROVED, NOT ACCEPTED 2 $143,500 11 $88,273 71 $101,746 5 $19,000 0 $0 3 $81,667 APPLICATIONS DENIED 3 $145,000 13 $115,000 196 $105,296 32 $28,188 0 $0 6 $87,833 APPLICATIONS WITHDRAWN 1 $118,000 18 $97,833 148 $110,095 10 $40,900 1 $207,000 5 $81,600 FILES CLOSED FOR INCOMPLETENESS 0 $0 2 $62,000 46 $118,087 2 $20,500 0 $0 0 $0
Aggregated Statistics For Year 2003(Based on 5 full tracts) A) FHA, FSA/RHS & VA B) Conventional C) Refinancings D) Home Improvement Loans F) Non-occupant Loans on Number Average Value Number Average Value Number Average Value Number Average Value Number Average Value
LOANS ORIGINATED 53 $123,396 185 $99,411 754 $94,415 41 $15,976 39 $88,333 APPLICATIONS APPROVED, NOT ACCEPTED 2 $127,000 16 $83,750 111 $82,676 9 $13,333 6 $66,333 APPLICATIONS DENIED 3 $121,333 17 $91,235 187 $89,476 24 $27,917 8 $57,250 APPLICATIONS WITHDRAWN 2 $124,000 11 $98,818 131 $103,183 2 $20,000 4 $74,250 FILES CLOSED FOR INCOMPLETENESS 0 $0 6 $84,833 45 $103,111 1 $38,000 3 $109,333
Aggregated Statistics For Year 2002(Based on 5 full tracts) A) FHA, FSA/RHS & VA B) Conventional C) Refinancings D) Home Improvement Loans E) Loans on Dwellings For 5+ Families F) Non-occupant Loans on Number Average Value Number Average Value Number Average Value Number Average Value Number Average Value Number Average Value
LOANS ORIGINATED 67 $117,015 181 $90,072 523 $92,216 32 $13,875 1 $455,000 20 $76,500 APPLICATIONS APPROVED, NOT ACCEPTED 1 $114,000 8 $102,875 83 $95,699 10 $10,500 0 $0 6 $79,167 APPLICATIONS DENIED 0 $0 11 $92,364 185 $89,043 27 $11,704 0 $0 2 $89,000 APPLICATIONS WITHDRAWN 3 $130,000 8 $97,250 102 $99,922 4 $5,250 0 $0 2 $91,000 FILES CLOSED FOR INCOMPLETENESS 0 $0 9 $73,667 43 $100,860 3 $23,000 0 $0 0 $0
Aggregated Statistics For Year 2001(Based on 5 full tracts) A) FHA, FSA/RHS & VA B) Conventional C) Refinancings D) Home Improvement Loans F) Non-occupant Loans on Number Average Value Number Average Value Number Average Value Number Average Value Number Average Value
LOANS ORIGINATED 65 $115,985 200 $93,615 458 $87,107 41 $23,683 21 $72,048 APPLICATIONS APPROVED, NOT ACCEPTED 0 $0 10 $74,100 60 $77,000 11 $12,364 0 $0 APPLICATIONS DENIED 1 $97,000 14 $63,643 167 $83,114 34 $14,912 4 $63,250 APPLICATIONS WITHDRAWN 4 $111,000 11 $73,000 93 $91,000 2 $57,000 3 $79,000 FILES CLOSED FOR INCOMPLETENESS 0 $0 3 $79,333 14 $101,571 0 $0 1 $100,000
Aggregated Statistics For Year 2000(Based on 5 full tracts) A) FHA, FSA/RHS & VA B) Conventional C) Refinancings D) Home Improvement Loans F) Non-occupant Loans on Number Average Value Number Average Value Number Average Value Number Average Value Number Average Value
LOANS ORIGINATED 63 $109,730 135 $84,126 137 $74,905 50 $17,900 7 $63,571 APPLICATIONS APPROVED, NOT ACCEPTED 1 $146,000 18 $69,000 44 $70,682 15 $12,667 1 $25,000 APPLICATIONS DENIED 3 $108,667 25 $41,720 131 $78,260 37 $20,297 2 $60,500 APPLICATIONS WITHDRAWN 6 $96,500 10 $87,200 42 $82,905 2 $8,000 0 $0 FILES CLOSED FOR INCOMPLETENESS 1 $107,000 2 $78,000 12 $116,833 2 $20,500 0 $0
Aggregated Statistics For Year 1999(Based on 5 full tracts) A) FHA, FSA/RHS & VA B) Conventional C) Refinancings D) Home Improvement Loans E) Loans on Dwellings For 5+ Families F) Non-occupant Loans on Number Average Value Number Average Value Number Average Value Number Average Value Number Average Value Number Average Value
LOANS ORIGINATED 58 $105,860 163 $124,591 289 $70,629 59 $16,087 2 $1,829,330 12 $68,444 APPLICATIONS APPROVED, NOT ACCEPTED 0 $0 6 $91,188 76 $65,814 17 $12,761 0 $0 1 $59,600 APPLICATIONS DENIED 4 $96,622 19 $43,636 116 $74,209 22 $14,334 0 $0 6 $37,403 APPLICATIONS WITHDRAWN 8 $67,196 12 $86,465 71 $79,713 12 $52,556 0 $0 1 $91,990 FILES CLOSED FOR INCOMPLETENESS 1 $97,000 1 $94,910 25 $80,222 0 $0 0 $0 0 $0
Detailed HMDA statistics for the following Tracts:
2001.00
, 2002.00 , 2003.00 , 2004.00 , 2005.00
Private Mortgage Insurance Companies Aggregated Statistics For Year 2009(Based on 5 full tracts) A) Conventional B) Refinancings Number Average Value Number Average Value
LOANS ORIGINATED 9 $109,778 3 $122,667 APPLICATIONS APPROVED, NOT ACCEPTED 3 $98,333 3 $101,333 APPLICATIONS DENIED 1 $161,000 2 $116,000 APPLICATIONS WITHDRAWN 0 $0 0 $0 FILES CLOSED FOR INCOMPLETENESS 0 $0 0 $0
Aggregated Statistics For Year 2008(Based on 5 full tracts) A) Conventional B) Refinancings C) Non-occupant Loans on Number Average Value Number Average Value Number Average Value
LOANS ORIGINATED 33 $120,303 10 $125,900 5 $81,400 APPLICATIONS APPROVED, NOT ACCEPTED 5 $102,200 10 $156,400 2 $82,000 APPLICATIONS DENIED 7 $81,714 2 $144,000 4 $71,000 APPLICATIONS WITHDRAWN 0 $0 0 $0 0 $0 FILES CLOSED FOR INCOMPLETENESS 2 $106,500 0 $0 0 $0
Aggregated Statistics For Year 2007(Based on 5 full tracts) A) Conventional B) Refinancings C) Non-occupant Loans on Number Average Value Number Average Value Number Average Value
LOANS ORIGINATED 82 $118,549 25 $131,040 5 $74,800 APPLICATIONS APPROVED, NOT ACCEPTED 5 $120,400 6 $163,167 0 $0 APPLICATIONS DENIED 0 $0 0 $0 0 $0 APPLICATIONS WITHDRAWN 7 $116,286 1 $155,000 0 $0 FILES CLOSED FOR INCOMPLETENESS 0 $0 1 $164,000 0 $0
Aggregated Statistics For Year 2006(Based on 5 full tracts) A) Conventional B) Refinancings C) Non-occupant Loans on Number Average Value Number Average Value Number Average Value
LOANS ORIGINATED 67 $122,179 15 $131,333 8 $96,875 APPLICATIONS APPROVED, NOT ACCEPTED 5 $132,600 2 $143,000 1 $121,000 APPLICATIONS DENIED 0 $0 1 $144,000 1 $144,000 APPLICATIONS WITHDRAWN 1 $137,000 4 $123,250 0 $0 FILES CLOSED FOR INCOMPLETENESS 0 $0 0 $0 0 $0
Aggregated Statistics For Year 2005(Based on 5 full tracts) A) Conventional B) Refinancings C) Non-occupant Loans on Number Average Value Number Average Value Number Average Value
LOANS ORIGINATED 57 $119,439 20 $121,300 8 $105,875 APPLICATIONS APPROVED, NOT ACCEPTED 9 $104,556 4 $115,750 4 $85,250 APPLICATIONS DENIED 2 $144,500 1 $112,000 2 $144,500 APPLICATIONS WITHDRAWN 5 $131,200 1 $126,000 0 $0 FILES CLOSED FOR INCOMPLETENESS 0 $0 1 $105,000 0 $0
Aggregated Statistics For Year 2004(Based on 5 full tracts) A) Conventional B) Refinancings C) Non-occupant Loans on Number Average Value Number Average Value Number Average Value
LOANS ORIGINATED 32 $117,281 35 $130,771 4 $105,000 APPLICATIONS APPROVED, NOT ACCEPTED 3 $118,667 18 $119,889 0 $0 APPLICATIONS DENIED 0 $0 0 $0 0 $0 APPLICATIONS WITHDRAWN 2 $90,000 4 $125,250 0 $0 FILES CLOSED FOR INCOMPLETENESS 0 $0 0 $0 0 $0
Aggregated Statistics For Year 2003(Based on 5 full tracts) A) Conventional B) Refinancings C) Non-occupant Loans on Number Average Value Number Average Value Number Average Value
LOANS ORIGINATED 58 $110,069 80 $122,912 7 $92,571 APPLICATIONS APPROVED, NOT ACCEPTED 8 $116,625 46 $126,870 1 $109,000 APPLICATIONS DENIED 0 $0 1 $108,000 0 $0 APPLICATIONS WITHDRAWN 1 $114,000 11 $123,909 1 $114,000 FILES CLOSED FOR INCOMPLETENESS 0 $0 0 $0 0 $0
Aggregated Statistics For Year 2002(Based on 5 full tracts) A) Conventional B) Refinancings C) Non-occupant Loans on Number Average Value Number Average Value Number Average Value
LOANS ORIGINATED 67 $102,970 61 $121,377 9 $80,000 APPLICATIONS APPROVED, NOT ACCEPTED 9 $120,778 18 $129,778 1 $83,000 APPLICATIONS DENIED 1 $122,000 1 $115,000 1 $122,000 APPLICATIONS WITHDRAWN 3 $114,333 2 $116,000 0 $0 FILES CLOSED FOR INCOMPLETENESS 0 $0 0 $0 0 $0
Aggregated Statistics For Year 2001(Based on 5 full tracts) A) Conventional B) Refinancings C) Non-occupant Loans on Number Average Value Number Average Value Number Average Value
LOANS ORIGINATED 56 $106,571 65 $113,769 6 $94,500 APPLICATIONS APPROVED, NOT ACCEPTED 8 $100,875 19 $110,632 1 $99,000 APPLICATIONS DENIED 1 $111,000 1 $115,000 0 $0 APPLICATIONS WITHDRAWN 0 $0 5 $96,400 0 $0 FILES CLOSED FOR INCOMPLETENESS 0 $0 0 $0 0 $0
Aggregated Statistics For Year 2000(Based on 5 full tracts) A) Conventional B) Refinancings C) Non-occupant Loans on Number Average Value Number Average Value Number Average Value
LOANS ORIGINATED 40 $94,825 12 $102,750 2 $84,000 APPLICATIONS APPROVED, NOT ACCEPTED 4 $108,500 2 $106,500 1 $102,000 APPLICATIONS DENIED 1 $106,000 0 $0 0 $0 APPLICATIONS WITHDRAWN 1 $112,000 2 $124,500 0 $0 FILES CLOSED FOR INCOMPLETENESS 0 $0 0 $0 0 $0
Aggregated Statistics For Year 1999(Based on 5 full tracts) A) Conventional B) Refinancings C) Non-occupant Loans on Number Average Value Number Average Value Number Average Value
LOANS ORIGINATED 61 $94,250 26 $97,863 4 $81,942 APPLICATIONS APPROVED, NOT ACCEPTED 2 $74,525 7 $95,993 0 $0 APPLICATIONS DENIED 0 $0 0 $0 0 $0 APPLICATIONS WITHDRAWN 1 $107,000 1 $108,000 0 $0 FILES CLOSED FOR INCOMPLETENESS 0 $0 0 $0 0 $0
Detailed PMIC statistics for the following Tracts:
2001.00
, 2002.00 , 2003.00 , 2004.00 , 2005.00 Willowick compared to Ohio state average:
Unemployed percentage significantly below state average. Hispanic race population percentage below state average. Foreign-born population percentage below state average. Renting percentage below state average. Length of stay since moving in significantly above state average.
#39 on the list of "Top 101 cities with the smallest house values disparities (population 5,000+)"
#90 on the list of "Top 101 cities with the most residents born in Bosnia and Herzegovina (population 500+)"
#92 (44095) on the list of "Top 101 zip codes with the largest percentage of Hungarian first ancestries (pop 5,000+)"
#63 on the list of "Top 101 counties with the largest number of people without health insurance coverage in 2000 (pop. 50,000+)"
#66 on the list of "Top 101 counties with the lowest number of births per 1000 residents 2007-2013"
#84 on the list of "Top 101 counties with the lowest percentage of residents relocating to foreign countries in 2011"
#86 on the list of "Top 101 counties with the lowest percentage of residents relocating to other counties in 2011 (pop. 50,000+)"
#95 on the list of "Top 101 counties with the largest increase in the number of deaths per 1000 residents 2000-2006 to 2007-2013 (pop. 50,000+)"
Top Patent Applicants
Daniel J. Knapton (8)
John S. Lihwa (8)
Richard D. Jenne (6)
Bill Molica (4)
Kevin J. Stambaugh (4)
Thomas F. Fiore (3)
James P. Roski (3)
Melinda E. Bartlett (2)
Bryan S. Reiger (2)
Bradley A. Lafuse (2)
Total of 63 patent applications in 2008-2024.


 Recent articles from our blog. Our writers, many of them Ph.D. graduates or candidates, create easy-to-read articles on a wide variety of topics.

 (3.8 miles
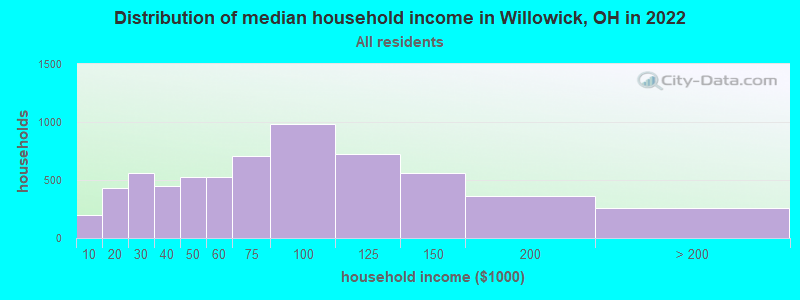


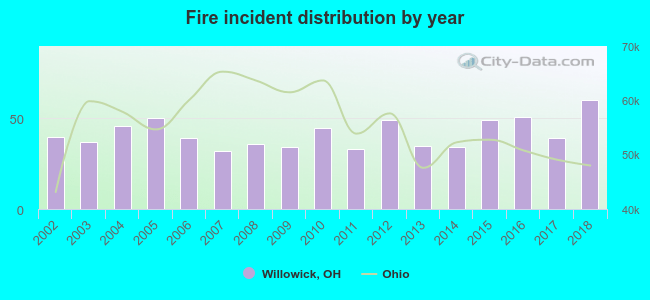 Based on the data from the years 2002 - 2018 the average number of fires per year is 42. The highest number of reported fires - 60 took place in 2018, and the least - 32 in 2007. The data has an increasing trend.
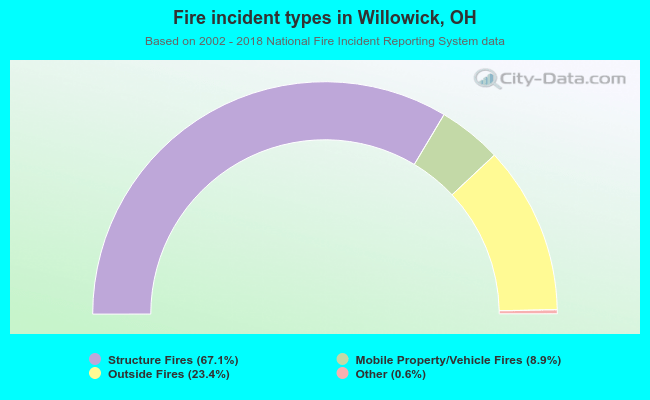 When looking into fire subcategories, the most reports belonged to: Structure Fires (67.1%), and Outside Fires (23.4%).