Estimated zip code population in 2022: 30,459 Zip code population in 2010: 31,919 Zip code population in 2000: 31,620
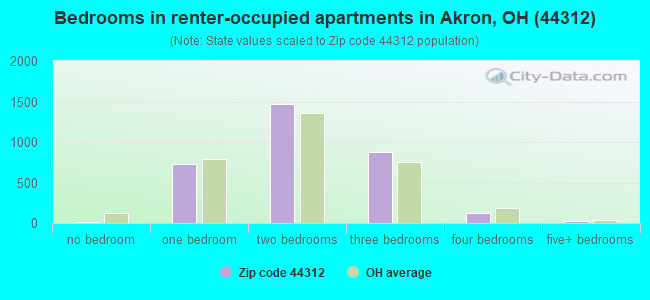
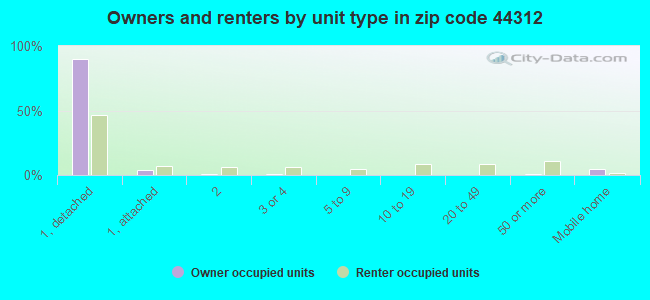
Houses and condos: 14,519 Renter-occupied apartments: 3,248
% of renters here:
24%
State:
33%
March 2022 cost of living index in zip code 44312: 95.5 (near average, U.S. average is 100)
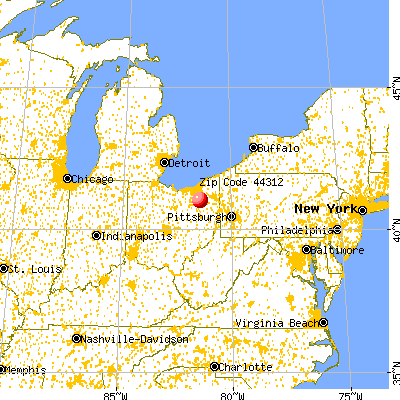
Land area: 19.2 sq. mi. Water area: 0.3 sq. mi.
Population density: 1,590 people per square mile
(low).
OSM Map
General Map
Google Map
MSN Map
OSM Map
General Map
Google Map
MSN Map
OSM Map
General Map
Google Map
MSN Map
OSM Map
General Map
Google Map
MSN Map
Please wait while loading the map...
Real estate property taxes paid for housing units in 2022:
This zip code:
1.6% ($2,256)
Ohio:
1.3% ($2,639)
Median real estate property taxes paid for housing units with mortgages in 2022: $2,367 (1.5%) Median real estate property taxes paid for housing units with no mortgage in 2022: $2,037 (1.7%)
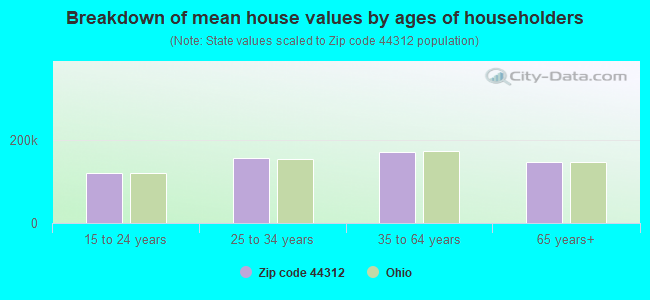
Estimated median house/condo value in 2022: $144,863
44312:
$144,863
Ohio:
$204,100
According to our research of Ohio and other state lists, there were 57 registered sex offenders living in 44312 zip code as of April 27, 2024. The ratio of all residents to sex offenders in zip code 44312 is 561 to 1. The ratio of registered sex offenders to all residents in this zip code is near the state average.
Median resident age:
This zip code:
45.8 years
Ohio median age:
39.9 years
Average household size:
This zip code:
2.2 people
Ohio:
2.4 people
Averages for the 2020 tax year for zip code 44312, filed in 2021:
Average Adjusted Gross Income (AGI) in 2020: $48,801 (Individual Income Tax Returns)
Here:
$48,801
State:
$67,288
Salary/wage: $43,900 (reported on 81.3% of returns)
Here:
$43,900
State:
$55,628
(% of AGI for various income ranges: 1102.0% for AGIs below $25k, 3468.0% for AGIs $25k-50k, 6185.8% for AGIs $50k-75k, 8781.7% for AGIs $75k-100k, 15394.3% for AGIs $100k-200k, 75242.0% for AGIs over 200k)
Taxable interest for individuals: $893 (reported on 20.1% of returns)
This zip code:
$893
Ohio:
$1,518
(% of AGI for various income ranges: 11.4% for AGIs below $25k, 13.9% for AGIs $25k-50k, 20.1% for AGIs $50k-75k, 31.9% for AGIs $75k-100k, 73.9% for AGIs $100k-200k, 994.0% for AGIs over 200k)
Ordinary dividends: $3,242 (reported on 12.2% of returns)
Here:
$3,242
State:
$7,167
(% of AGI for various income ranges: 16.6% for AGIs below $25k, 19.4% for AGIs $25k-50k, 45.5% for AGIs $50k-75k, 54.1% for AGIs $75k-100k, 195.1% for AGIs $100k-200k, 3566.0% for AGIs over 200k)
Net capital gain/loss in AGI: +$7,167 (reported on 11.1% of returns)
Here:
+$7,167
State:
+$18,919
(% of AGI for various income ranges: 4.3% for AGIs below $25k, 15.3% for AGIs $25k-50k, 63.8% for AGIs $50k-75k, 80.8% for AGIs $75k-100k, 519.6% for AGIs $100k-200k, 11152.0% for AGIs over 200k)
Profit/loss from business: +$8,016 (reported on 12.5% of returns)
Here:
+$8,016
State:
+$13,744
(% of AGI for various income ranges: 89.4% for AGIs below $25k, 81.5% for AGIs $25k-50k, 129.1% for AGIs $50k-75k, 238.5% for AGIs $75k-100k, 364.5% for AGIs $100k-200k, 1730.0% for AGIs over 200k)
Taxable individual retirement arrangement distribution: $14,527 (reported on 8.7% of returns)
44312:
$14,527
Ohio:
$18,876
(% of AGI for various income ranges: 70.5% for AGIs below $25k, 91.3% for AGIs $25k-50k, 161.7% for AGIs $50k-75k, 333.7% for AGIs $75k-100k, 704.4% for AGIs $100k-200k, 1730.0% for AGIs over 200k)
Total itemized deductions: $26,624 (reported on 3.0% of returns)
Here:
$26,624
State:
$33,869
(% of AGI for various income ranges: 21.0% for AGIs below $25k, 38.1% for AGIs $25k-50k, 103.5% for AGIs $50k-75k, 166.4% for AGIs $75k-100k, 514.6% for AGIs $100k-200k, 4586.0% for AGIs over 200k)
Charity contributions: $8,726 (reported on 2.3% of returns)
Here:
$8,726
State:
$14,577
(% of AGI for various income ranges: 8.0% for AGIs $25k-50k, 21.6% for AGIs $50k-75k, 39.5% for AGIs $75k-100k, 127.1% for AGIs $100k-200k, 2068.0% for AGIs over 200k)
Taxes paid: $6,718 (reported on 3.0% of returns)
44312:
$6,718
State:
$7,681
(% of AGI for various income ranges: 2.1% for AGIs below $25k, 7.2% for AGIs $25k-50k, 27.8% for AGIs $50k-75k, 48.0% for AGIs $75k-100k, 151.1% for AGIs $100k-200k, 1066.0% for AGIs over 200k)
Earned income credit: $2,088 (reported on 14.9% of returns)
Here:
$2,088
State:
$2,304
(% of AGI for various income ranges: 73.0% for AGIs below $25k, 49.5% for AGIs $25k-50k, 0.9% for AGIs $50k-75k)
Percentage of individuals using paid preparers for their 2020 taxes: 94.1%
Here:
94%
State:
94%
(% for various income ranges: 92.8% for AGIs below $25k, 95.1% for AGIs $25k-50k, 94.7% for AGIs $50k-75k, 93.9% for AGIs $75k-100k, 94.7% for AGIs $100k-200k, 94.7% for AGIs over 200k)
Averages for the 2012 tax year for zip code 44312, filed in 2013:
Average Adjusted Gross Income (AGI) in 2012: $43,430 (Individual Income Tax Returns)
Here:
$43,430
State:
$54,926
Salary/wage: $38,115 (reported on 83.9% of returns)
Here:
$38,115
State:
$45,869
(% of AGI for various income ranges: 73.5% for AGIs below $25k, 78.4% for AGIs $25k-50k, 79.0% for AGIs $50k-75k, 80.3% for AGIs $75k-100k, 79.2% for AGIs $100k-200k, 32.9% for AGIs over 200k)
Taxable interest for individuals: $936 (reported on 27.6% of returns)
This zip code:
$936
Ohio:
$1,297
(% of AGI for various income ranges: 0.9% for AGIs below $25k, 0.4% for AGIs $25k-50k, 0.5% for AGIs $50k-75k, 0.5% for AGIs $75k-100k, 0.6% for AGIs $100k-200k, 0.9% for AGIs over 200k)
Ordinary dividends: $2,450 (reported on 13.7% of returns)
Here:
$2,450
State:
$5,821
(% of AGI for various income ranges: 1.0% for AGIs below $25k, 0.5% for AGIs $25k-50k, 0.7% for AGIs $50k-75k, 0.7% for AGIs $75k-100k, 1.2% for AGIs $100k-200k, 1.0% for AGIs over 200k)
Net capital gain/loss in AGI: +$2,127 (reported on 9.3% of returns)
Here:
+$2,127
State:
+$11,232
(% of AGI for various income ranges: 0.3% for AGIs $50k-75k, 0.3% for AGIs $75k-100k, 1.0% for AGIs $100k-200k, 2.0% for AGIs over 200k)
Profit/loss from business: +$9,655 (reported on 11.2% of returns)
Here:
+$9,655
State:
+$12,773
(% of AGI for various income ranges: 5.6% for AGIs below $25k, 2.1% for AGIs $25k-50k, 1.7% for AGIs $50k-75k, 1.6% for AGIs $75k-100k, 2.6% for AGIs $100k-200k, 2.7% for AGIs over 200k)
Taxable individual retirement arrangement distribution: $9,882 (reported on 9.9% of returns)
44312:
$9,882
Ohio:
$14,511
(% of AGI for various income ranges: 3.2% for AGIs below $25k, 2.4% for AGIs $25k-50k, 2.2% for AGIs $50k-75k, 2.4% for AGIs $75k-100k, 2.7% for AGIs $100k-200k)
Self-employment retirement plans: $19,500 (reported on 0.2% of returns)
44312:
$19,500
Ohio:
$20,257
(% of AGI for various income ranges: 0.5% for AGIs $75k-100k)
Total itemized deductions: $16,236 (20% of AGI, reported on 25.9% of returns)
Here:
$16,236
State:
$21,278
Here:
19.9% of AGI
State:
18.8% of AGI
(% of AGI for various income ranges: 5.1% for AGIs below $25k, 7.9% for AGIs $25k-50k, 10.2% for AGIs $50k-75k, 11.9% for AGIs $75k-100k, 14.0% for AGIs $100k-200k, 8.6% for AGIs over 200k)
Charity contributions: $3,024 (reported on 19.0% of returns)
Here:
$3,024
State:
$3,943
(% of AGI for various income ranges: 0.5% for AGIs below $25k, 0.9% for AGIs $25k-50k, 1.4% for AGIs $50k-75k, 1.6% for AGIs $75k-100k, 2.0% for AGIs $100k-200k, 1.8% for AGIs over 200k)
Taxes paid: $6,862 (reported on 25.9% of returns)
44312:
$6,862
State:
$9,568
(% of AGI for various income ranges: 1.1% for AGIs below $25k, 2.4% for AGIs $25k-50k, 3.8% for AGIs $50k-75k, 4.8% for AGIs $75k-100k, 6.6% for AGIs $100k-200k, 7.5% for AGIs over 200k)
Earned income credit: $2,060 (reported on 17.2% of returns)
Here:
$2,060
State:
$2,285
(% of AGI for various income ranges: 5.2% for AGIs below $25k, 0.8% for AGIs $25k-50k)
Percentage of individuals using paid preparers for their 2012 taxes: 49.3%
Here:
49%
State:
51%
(% for various income ranges: 45.5% for AGIs below $25k, 49.3% for AGIs $25k-50k, 53.8% for AGIs $50k-75k, 53.2% for AGIs $75k-100k, 56.6% for AGIs $100k-200k, 72.7% for AGIs over 200k)
Averages for the 2004 tax year for zip code 44312, filed in 2005:
Average Adjusted Gross Income (AGI) in 2004: $35,547 (Individual Income Tax Returns)
Here:
$35,547
State:
$44,480
Salary/wage: $34,282 (reported on 84.8% of returns)
Here:
$34,282
State:
$39,198
(% of AGI for various income ranges: 86.2% for AGIs below $10k, 71.4% for AGIs $10k-25k, 83.5% for AGIs $25k-50k, 85.5% for AGIs $50k-75k, 86.4% for AGIs $75k-100k, 75.4% for AGIs over 100k)
Taxable interest for individuals: $1,221 (reported on 39.0% of returns)
This zip code:
$1,221
Ohio:
$1,532
(% of AGI for various income ranges: 4.3% for AGIs below $10k, 2.4% for AGIs $10k-25k, 1.1% for AGIs $25k-50k, 1.0% for AGIs $50k-75k, 1.0% for AGIs $75k-100k, 1.5% for AGIs over 100k)
Taxable dividends: $1,341 (reported on 17.3% of returns)
Here:
$1,341
State:
$3,496
(% of AGI for various income ranges: 1.6% for AGIs below $10k, 1.0% for AGIs $10k-25k, 0.5% for AGIs $25k-50k, 0.5% for AGIs $50k-75k, 0.5% for AGIs $75k-100k, 1.0% for AGIs over 100k)
Net capital gain/loss: +$2,291 (reported on 12.2% of returns)
Here:
+$2,291
State:
+$8,582
(% of AGI for various income ranges: -0.4% for AGIs below $10k, 0.3% for AGIs $10k-25k, 0.3% for AGIs $25k-50k, 0.6% for AGIs $50k-75k, 1.4% for AGIs $75k-100k, 2.6% for AGIs over 100k)
Profit/loss from business: +$7,319 (reported on 11.8% of returns)
Here:
+$7,319
State:
+$10,813
(% of AGI for various income ranges: 6.3% for AGIs below $10k, 4.6% for AGIs $10k-25k, 1.8% for AGIs $25k-50k, 1.9% for AGIs $50k-75k, 1.4% for AGIs $75k-100k, 3.3% for AGIs over 100k)
IRA payment deduction: $2,637 (reported on 1.7% of returns)
44312:
$2,637
Ohio:
$2,794
(% of AGI for various income ranges: 0.2% for AGIs $10k-25k, 0.1% for AGIs $25k-50k, 0.1% for AGIs $50k-75k, 0.1% for AGIs $75k-100k, 0.1% for AGIs over 100k)
Self-employed pension: $9,276 (reported on 0.2% of returns)
Here:
$9,276
Ohio:
$13,981
Total itemized deductions: $13,437 (23% of AGI, reported on 33.2% of returns)
Here:
$13,437
State:
$17,503
Here:
23.0% of AGI
State:
20.8% of AGI
(% of AGI for various income ranges: 9.5% for AGIs below $10k, 8.1% for AGIs $10k-25k, 11.0% for AGIs $25k-50k, 14.2% for AGIs $50k-75k, 15.6% for AGIs $75k-100k, 15.2% for AGIs over 100k)
Charity contributions deductions: $2,041 (3% of AGI, reported on 26.1% of returns)
Here:
$2,041
State:
$3,087
Here:
3.3% of AGI
State:
3.4% of AGI
(% of AGI for various income ranges: 0.5% for AGIs below $10k, 0.9% for AGIs $10k-25k, 1.1% for AGIs $25k-50k, 1.7% for AGIs $50k-75k, 2.0% for AGIs $75k-100k, 2.3% for AGIs over 100k)
Total tax: $4,095 (reported on 78.3% of returns)
44312:
$4,095
State:
$6,781
(% of AGI for various income ranges: 2.6% for AGIs below $10k, 4.5% for AGIs $10k-25k, 7.3% for AGIs $25k-50k, 9.0% for AGIs $50k-75k, 10.2% for AGIs $75k-100k, 18.0% for AGIs over 100k)
Earned income credit: $1,557 (reported on 13.3% of returns)
Here:
$1,557
State:
$1,696
Percentage of individuals using paid preparers for their 2004 taxes: 53.2%
Here:
53%
State:
55%
(% for various income ranges: 43.9% for AGIs below $10k, 54.7% for AGIs $10k-25k, 56.2% for AGIs $25k-50k, 54.2% for AGIs $50k-75k, 54.2% for AGIs $75k-100k, 52.7% for AGIs over 100k)
Likely homosexual households (counted as self-reported same-sex unmarried-partner households)
Lesbian couples: 0.2% of all households
Gay men: 0.1% of all households
Household received Food Stamps/SNAP in the past 12 months: 1,386 Household did not receive Food Stamps/SNAP in the past 12 months: 12,317
Women who had a birth in the past 12 months: 212 (145 now married, 67 unmarried) Women who did not have a birth in the past 12 months: 6,397 (2,650 now married, 3,746 unmarried)
Housing units in zip code 44312 with a mortgage: 6,364 (538 second mortgage, 7 home equity loan, 498 both second mortgage and home equity loan) Houses without a mortgage: 499
Median monthly owner costs for units with a mortgage: $1,142 Median monthly owner costs for units without a mortgage: $496
Residents with income below the poverty level in 2022:
This zip code:
9.6%
Whole state:
13.4%
Residents with income below 50% of the poverty level in 2022:
This zip code:
5.5%
Whole state:
7.0%
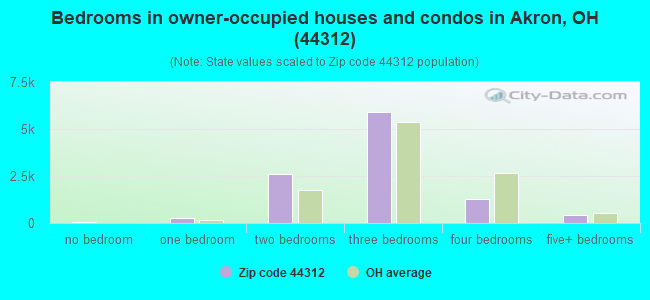
Median number of rooms in houses and condos:
Here:
6.0
State:
6.7
Median number of rooms in apartments:
Here:
4.7
State:
4.4
Notable locations in this zip code not listed on our city pages
Notable locations in zip code 44312: Municipal Stadium (A), Interstate Business Park (B), Miller Industrial Park (C), Massillon Road Industrial Park (D), Lakemore Fire Department (E), Ellet Branch Library (F), Springfield Township Fire Department Station 1 (G), Akron Fire Department Station 5 (H), Springfield Township Fire Department Station 2 (I), Lakemore Township Police Department (J), Edwin Shaw Hospital for Rehabilitation (K). Display/hide their locations on the map
Shopping Centers: Triplett Plaza Shopping Center (1), Eastgate Plaza Shopping Center (2), Lakemore Plaza Shopping Center (3). Display/hide their locations on the map
Churches in zip code 44312 include: Saint Nicholas Orthodox Church (A), Grace Cathedral (B), Lakemore Community Baptist Church (C), Lakemore United Methodist Church (D), Sawyerwood United Methodist Church (E), Millheim Church (F), Rock House of Jesus Church (G), Ellet Community Church of God (H), Ellet Church of the Nazarene (I). Display/hide their locations on the map
Cemeteries: Edwin Shaw Sanitarium Cemetery (1), Hillside Memorial Park (2), Keiser Cemetery (3), Milheim Cemetery (4), Springfield Presbyterian Cemetery (5), Maple Hill Cemetery (6), North Springfield Cemetery (7). Display/hide their locations on the map
Parks in zip code 44312 include: Airport Park (1), Waterworks Park (2), Hyre Park (3), Lakemore Recreation Park (4), Davenport Park (5), Ellet Park (6). Display/hide their locations on the map
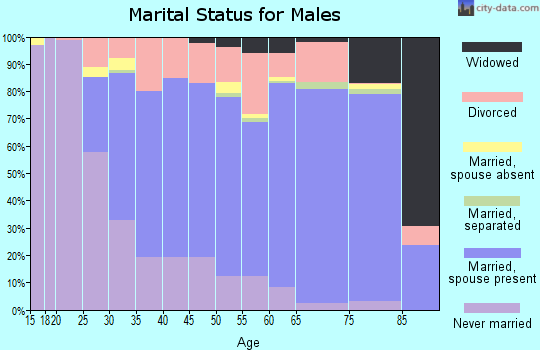
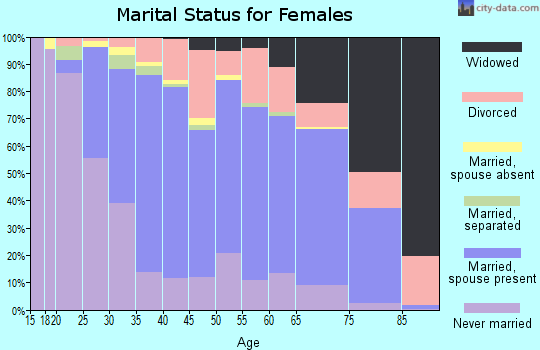
3,173 married couples with children.
1,358 single-parent households (96 men, 1,262 women).
96.6% of residents of 44312 zip code speak English at home.
1.4% of residents speak Spanish at home (64% very well, 23% well, 13% not well).
1.5% of residents speak other Indo-European language at home (66% very well, 23% well, 4% not well, 7% not at all).
0.2% of residents speak Asian or Pacific Island language at home (75% very well, 25% not well).
0.1% of residents speak other language at home (86% very well, 14% well).
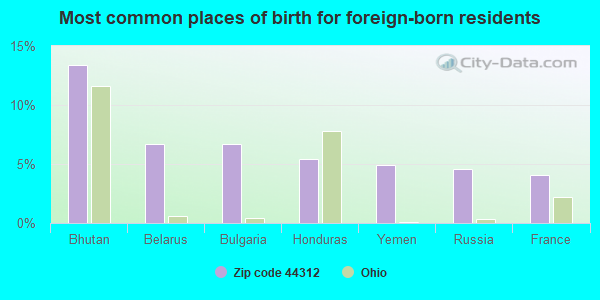
Foreign born population: 569 (1.9%) (63.5% of them are naturalized citizens)
Facilities with environmental interests located in this zip code:
AKRON BRICK AND BLOCK * (3225 MOGADORE RD in AKRON, OH)
AIR MINOR (AIRS/AFS) CRITERIA AND HAZARDOUS AIR POLLUTANT INVENTORY (Inventory of air pollution sources) STATE MASTER (Ohio general info) - AIR MAJOR STATE MASTER (Ohio general info) - -05-4813-861-1, EPCRA, SDWIS-7722612, DRINKING WATER PROGRAM, PCS-OH0129640, National Pollutant Discharge Elimination System Permit National Pollutant Discharge Elimination System NON-MAJOR (Tracking pollutant discharge elimination systems) - permit TRI REPORTER (Tracking of toxic chemicals releasing facilities) Business SIC classification: CONCRETE BLOCK AND BRICK Organizations: AKRON BRICK & BLOCK (CONTACT/OWNER)
Alternative names: AKRON BRICK & BLOCK - OLD
BOYER ELEMENTARY SCHOOL (2141 PICKLE RD in AKRON, OH)
(National Center for Education Statistics) - STATE ID-003319 STATE MASTER (Ohio general info) - AIR MAJOR Organizations: SPRINGFIELD LOCAL SD (SCHOOL DISTRICT)
AKRON COLUMBINE TANK CITY OF (282 COLUMBINE AVENUE in AKRON, OH)
STATE MASTER (Ohio general info) - RCRA-OHR000025189, HAZARDOUS WASTE PROGRAM HAZARDOUS WASTE BIENNIAL REPORTER (Resource Conservation and Recovery Act (tracking hazardous waste)) Large Quantity Generators, more that 1000 kg of hazardous waste/month (Resource Conservation and Recovery Act (tracking hazardous waste)) - notification Business SIC classification: WATER SUPPLY Organizations: CITY OF AKRON (CONTACT/OWNER)
Alternative names: CITY OF AKRON COLUMBINE TANK
ADF OIL CO (2699 MOGADORE RD in AKRON, OH)
STATE MASTER (Ohio general info) - RCRA-OHT400011938, HAZARDOUS WASTE PROGRAM (Resource Conservation and Recovery Act (tracking hazardous waste)) Organizations: ADF OIL COMPANY (CONTACT/OWNER)
, UNKNOWN (CONTACT/OWNER)
AKRON CANTON WASTE OIL CO (2699 MOGADORE ROAD in AKRON, OH)
STATE MASTER (Ohio general info) - RCRA-OHT400014858, HAZARDOUS WASTE PROGRAM TRANSPORTER (Resource Conservation and Recovery Act (tracking hazardous waste)) Organizations: FRED AMBACH (CONTACT/OWNER)
ARC MACHINE (3194 MASSILLON RD in AKRON, OH)
STATE MASTER (Ohio general info) - RCRA-OHD987056298, HAZARDOUS WASTE PROGRAM Small Quantity Generators, between 100 kg and 1000 kg of hazardous waste/month (Resource Conservation and Recovery Act (tracking hazardous waste)) - notification Organizations: KOBERLEIN GEORGE (CONTACT/OWNER)
, GEORGE KOBERLEIN (CONTACT/OWNER)
B&G CONTRACTORS SUPPLY (2457 MOGADORE RD in AKRON, OH)
STATE MASTER (Ohio general info) - RCRA-OHR000032540, HAZARDOUS WASTE PROGRAM Small Quantity Generators, between 100 kg and 1000 kg of hazardous waste/month (Resource Conservation and Recovery Act (tracking hazardous waste)) - notification Organizations: KUHLMAN CORPORATION (CONTACT/OWNER)
, KUHLMAN CORP (CONTACT/OWNER)
BP OIL CO SITE 01139 * (2836 E WATERLOO in AKRON, OH)
STATE MASTER (Ohio general info) - RCRA-OHD987024726, HAZARDOUS WASTE PROGRAM, AIR MAJOR Conditionally Exempt Small Quantity Generators, less than 100 kg/month of hazardous waste (Resource Conservation and Recovery Act (tracking hazardous waste)) - notification Organizations: BP OIL COMPANY (CONTACT/OWNER)
AKRON CITY OF FIRE MAINT (2474 TRIPLETT BLVD in AKRON, OH)
Large Quantity Generators, more that 1000 kg of hazardous waste/month (Resource Conservation and Recovery Act (tracking hazardous waste)) - notification Organizations: CITY OF AKRON (CONTACT/OWNER)
AKRON PAINT (1900 ENGLEWOOD AVE in AKRON, OH)
(Resource Conservation and Recovery Act (tracking hazardous waste)) Organizations: ITW AKRON STANDARD (CONTACT/OWNER)
Alternative names: AKRON STANDARD
AKRON TRAILER MFG (3437 E WATERLOO RD in AKRON, OH)
Small Quantity Generators, between 100 kg and 1000 kg of hazardous waste/month (Resource Conservation and Recovery Act (tracking hazardous waste)) - notification
AKRON CENTRAL ENGRAVING (1625 MASSILON RD in AKRON, OH)
COMPLIANCE ACTIVITY (Tracking inspections of insecticide, fungicide, and rodenticide, and toxic substances) Business SIC classification: INDUSTRIAL AND COMMERCIAL MACHINERY AND EQUIPMENT
Housing units lacking complete plumbing facilities: 1.6% Housing units lacking complete kitchen facilities: 1.7%
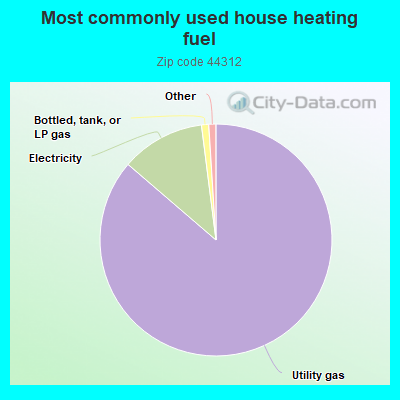
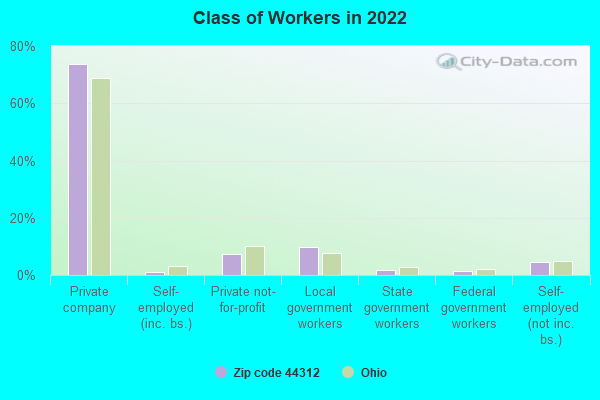
86.3%Utility gas
11.7%Electricity
1.0%Bottled, tank, or LP gas
Population in 1990: 32,097.
Place of birth for U.S.-born residents:
This state: 24,560
Northeast: 1,211
Midwest: 682
South: 2,270
West: 748
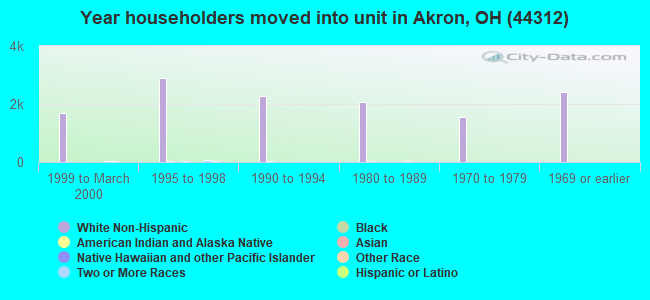
64% of the 44312 zip code residents lived in the same house 5 years ago. Out of people who lived in different houses, 73% lived in this county. Out of people who lived in different counties, 50% lived in Ohio.
92% of the 44312 zip code residents lived in the same house 1 year ago. Out of people who lived in different houses, 48% moved from this county. Out of people who lived in different houses, 42% moved from different county within same state. Out of people who lived in different houses, 9% moved from different state. Out of people who lived in different houses, 3% moved from abroad.
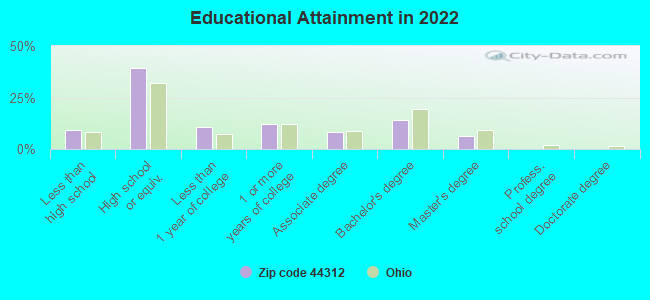
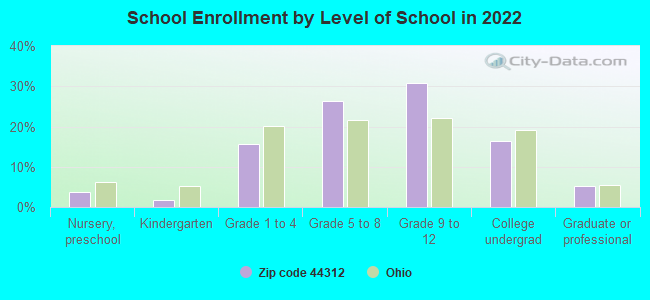
Private vs. public school enrollment:
Students in private schools in grades 1 to 8 (elementary and middle school): 284
Here:
11.2%
Ohio:
16.0%
Students in private schools in grades 9 to 12 (high school): 46
Here:
2.5%
Ohio:
13.1%
Students in private undergraduate colleges: 173
Here:
17.4%
Ohio:
22.3%
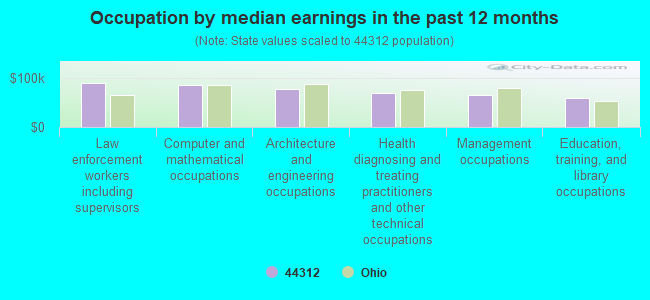
Occupation by median earnings in the past 12 months ($)
89,993Law enforcement workers including supervisors
86,638Computer and mathematical occupations
78,080Architecture and engineering occupations
69,703Health diagnosing and treating practitioners and other technical occupations
65,535Management occupations
59,052Education, training, and library occupations
Companies with federal contracts located in this zip code:
SAM WINER MOTORS INC (3417 E WATERLOO RD in AKRON, OH; small business) : $691,816 in 39 contractsfrom 2003 to 2006
Contracts for Miscellaneous Vehicular Components, Electrical Control Equipment, Winches, Hoists, Cranes, and Derricks, Packing and Gasket Materials, and moreby Defense Logistics Agency, Navy, Army Signed by year:2000: $0; 2001: $0; 2002: $0; 2003: $40,358; 2004: $409,284; 2005: $195,811; 2006: $46,363.
Biggest contracts:
$81,252 with Defense Logistics Agency for Miscellaneous Vehicular Components. Signed on 2005-08-12. Completion date: 2006-02-08.
$48,777, same as above.Signed on 2004-08-20. Completion date: 2004-11-28.
$46,911 with Defense Logistics Agency for Electrical Control Equipment. Signed on 2004-12-25. Completion date: 2005-03-25.
$45,667 with Defense Logistics Agency for Miscellaneous Vehicular Components. Signed on 2004-08-13. Completion date: 2004-12-11.
AKRON TURBINE GROUP INC (2396 PICKLE RD in AKRON, OH; small business)
$131,000 with Army for Miscellaneous Special Industry Machinery. Signed on 2005-05-02. Completion date: 2005-11-01.
AKRON LODGES LLC (2940 CHENOWETH RD in AKRON, OH)
$6,718 with Army for Lodging - Hotel/Motel. Signed on 2004-12-07. Completion date: 2004-11-14.
Top industries in this zip code by the number of employees in 2005:
2002 - 2018 National Fire Incident Reporting System (NFIRS) incidents
According to the data from the years 2002 - 2018 the average number of fires per year is 119. The highest number of reported fire incidents - 183 took place in 2008, and the least - 60 in 2002. The data has an increasing trend.
When looking into fire subcategories, the most reports belonged to: Structure Fires (46.3%), and Outside Fires (36.5%).
Fire incident types reported to NFIRS in Zip Code 44312


 Nearest zip codes: 44250, 44306, 44685, 44305, 44301, 44319.


 According to the data from the years 2002 - 2018 the average number of fires per year is 119. The highest number of reported fire incidents - 183 took place in 2008, and the least - 60 in 2002. The data has an increasing trend.
 When looking into fire subcategories, the most reports belonged to: Structure Fires (46.3%), and Outside Fires (36.5%).