Estimated zip code population in 2022: 22,160
Zip code population in 2010: 22,686
Zip code population in 2000: 22,098
Houses and condos: 10,237
Renter-occupied apartments: 2,530
% of renters here:
26%State:
33%
March 2022 cost of living index in zip code 44319: 96.1
(near average, U.S. average is 100)
Land area: 18.8
sq. mi.
Water area: 2.0
sq. mi.
Population density: 1,180 people per square mile (low).
OSM Map
General Map
Google Map
MSN Map
OSM Map
General Map
Google Map
MSN Map
OSM Map
General Map
Google Map
MSN Map
OSM Map
General Map
Google Map
MSN Map
Please wait while loading the map...
Real estate property taxes paid for housing units in 2022:
This zip code:
1.6% ($3,201)Ohio:
1.3% ($2,639)
Median real estate property taxes paid for housing units with mortgages in 2022: $3,397 (1.6%)
Median real estate property taxes paid for housing units with no mortgage in 2022: $2,814 (1.6%)
Profiles of local businesses
Business Search - 14 Million verified businesses
Males: 10,783 Females: 11,377
For population 25 years and over in 44319:
High school or higher: 95.9%Bachelor's degree or higher: 32.7%Graduate or professional degree: 12.7%Unemployed: 4.1%Mean travel time to work (commute): 21.1 minutes
For population 15 years and over in 44319:
Never married: 27.5%Now married: 49.7%Separated: 0.8%Widowed: 6.8%Divorced: 15.1%
Zip code 44319 compared to state average:
Black race population percentage significantly below state average. Hispanic race population percentage significantly below state average. Median age above state average. Foreign-born population percentage below state average. Length of stay since moving in significantly above state average. 20,273 91.5% White 693 3.1% Two or more races 531 2.4% Black 336 1.5% Asian 306 1.4% Hispanic or Latino 18 0.08% American Indian
Data:
Median household income ($)
Median household income (% change since 2000)
Household income diversity
Ratio of average income to average house value (%)
Ratio of average income to average rent
Median household income ($) - White
Median household income ($) - Black or African American
Median household income ($) - Asian
Median household income ($) - Hispanic or Latino
Median household income ($) - American Indian and Alaska Native
Median household income ($) - Multirace
Median household income ($) - Other Race
Median household income for houses/condos with a mortgage ($)
Median household income for apartments without a mortgage ($)
Races - White alone (%)
Races - White alone (% change since 2000)
Races - Black alone (%)
Races - Black alone (% change since 2000)
Races - American Indian alone (%)
Races - American Indian alone (% change since 2000)
Races - Asian alone (%)
Races - Asian alone (% change since 2000)
Races - Hispanic (%)
Races - Hispanic (% change since 2000)
Races - Native Hawaiian and Other Pacific Islander alone (%)
Races - Native Hawaiian and Other Pacific Islander alone (% change since 2000)
Races - Two or more races (%)
Races - Two or more races (% change since 2000)
Races - Other race alone (%)
Races - Other race alone (% change since 2000)
Racial diversity
Unemployment (%)
Unemployment (% change since 2000)
Unemployment (%) - White
Unemployment (%) - Black or African American
Unemployment (%) - Asian
Unemployment (%) - Hispanic or Latino
Unemployment (%) - American Indian and Alaska Native
Unemployment (%) - Multirace
Unemployment (%) - Other Race
Population density (people per square mile)
Population - Males (%)
Population - Females (%)
Population - Males (%) - White
Population - Males (%) - Black or African American
Population - Males (%) - Asian
Population - Males (%) - Hispanic or Latino
Population - Males (%) - American Indian and Alaska Native
Population - Males (%) - Multirace
Population - Males (%) - Other Race
Population - Females (%) - White
Population - Females (%) - Black or African American
Population - Females (%) - Asian
Population - Females (%) - Hispanic or Latino
Population - Females (%) - American Indian and Alaska Native
Population - Females (%) - Multirace
Population - Females (%) - Other Race
Coronavirus confirmed cases (Apr 27, 2024)
Deaths caused by coronavirus (Apr 27, 2024)
Coronavirus confirmed cases (per 100k population) (Apr 27, 2024)
Deaths caused by coronavirus (per 100k population) (Apr 27, 2024)
Daily increase in number of cases (Apr 27, 2024)
Weekly increase in number of cases (Apr 27, 2024)
Cases doubled (in days) (Apr 27, 2024)
Hospitalized patients (Apr 18, 2022)
Negative test results (Apr 18, 2022)
Total test results (Apr 18, 2022)
COVID Vaccine doses distributed (per 100k population) (Sep 19, 2023)
COVID Vaccine doses administered (per 100k population) (Sep 19, 2023)
COVID Vaccine doses distributed (Sep 19, 2023)
COVID Vaccine doses administered (Sep 19, 2023)
Likely homosexual households (%)
Likely homosexual households (% change since 2000)
Likely homosexual households - Lesbian couples (%)
Likely homosexual households - Lesbian couples (% change since 2000)
Likely homosexual households - Gay men (%)
Likely homosexual households - Gay men (% change since 2000)
Cost of living index
Median gross rent ($)
Median contract rent ($)
Median monthly housing costs ($)
Median house or condo value ($)
Median house or condo value ($ change since 2000)
Mean house or condo value by units in structure - 1, detached ($)
Mean house or condo value by units in structure - 1, attached ($)
Mean house or condo value by units in structure - 2 ($)
Mean house or condo value by units in structure by units in structure - 3 or 4 ($)
Mean house or condo value by units in structure - 5 or more ($)
Mean house or condo value by units in structure - Boat, RV, van, etc. ($)
Mean house or condo value by units in structure - Mobile home ($)
Median house or condo value ($) - White
Median house or condo value ($) - Black or African American
Median house or condo value ($) - Asian
Median house or condo value ($) - Hispanic or Latino
Median house or condo value ($) - American Indian and Alaska Native
Median house or condo value ($) - Multirace
Median house or condo value ($) - Other Race
Median resident age
Resident age diversity
Median resident age - Males
Median resident age - Females
Median resident age - White
Median resident age - Black or African American
Median resident age - Asian
Median resident age - Hispanic or Latino
Median resident age - American Indian and Alaska Native
Median resident age - Multirace
Median resident age - Other Race
Median resident age - Males - White
Median resident age - Males - Black or African American
Median resident age - Males - Asian
Median resident age - Males - Hispanic or Latino
Median resident age - Males - American Indian and Alaska Native
Median resident age - Males - Multirace
Median resident age - Males - Other Race
Median resident age - Females - White
Median resident age - Females - Black or African American
Median resident age - Females - Asian
Median resident age - Females - Hispanic or Latino
Median resident age - Females - American Indian and Alaska Native
Median resident age - Females - Multirace
Median resident age - Females - Other Race
Commute - mean travel time to work (minutes)
Travel time to work - Less than 5 minutes (%)
Travel time to work - Less than 5 minutes (% change since 2000)
Travel time to work - 5 to 9 minutes (%)
Travel time to work - 5 to 9 minutes (% change since 2000)
Travel time to work - 10 to 19 minutes (%)
Travel time to work - 10 to 19 minutes (% change since 2000)
Travel time to work - 20 to 29 minutes (%)
Travel time to work - 20 to 29 minutes (% change since 2000)
Travel time to work - 30 to 39 minutes (%)
Travel time to work - 30 to 39 minutes (% change since 2000)
Travel time to work - 40 to 59 minutes (%)
Travel time to work - 40 to 59 minutes (% change since 2000)
Travel time to work - 60 to 89 minutes (%)
Travel time to work - 60 to 89 minutes (% change since 2000)
Travel time to work - 90 or more minutes (%)
Travel time to work - 90 or more minutes (% change since 2000)
Marital status - Never married (%)
Marital status - Now married (%)
Marital status - Separated (%)
Marital status - Widowed (%)
Marital status - Divorced (%)
Median family income ($)
Median family income (% change since 2000)
Median non-family income ($)
Median non-family income (% change since 2000)
Median per capita income ($)
Median per capita income (% change since 2000)
Median family income ($) - White
Median family income ($) - Black or African American
Median family income ($) - Asian
Median family income ($) - Hispanic or Latino
Median family income ($) - American Indian and Alaska Native
Median family income ($) - Multirace
Median family income ($) - Other Race
Median year house/condo built
Median year apartment built
Year house built - Built 2005 or later (%)
Year house built - Built 2000 to 2004 (%)
Year house built - Built 1990 to 1999 (%)
Year house built - Built 1980 to 1989 (%)
Year house built - Built 1970 to 1979 (%)
Year house built - Built 1960 to 1969 (%)
Year house built - Built 1950 to 1959 (%)
Year house built - Built 1940 to 1949 (%)
Year house built - Built 1939 or earlier (%)
Average household size
Household density (households per square mile)
Average household size - White
Average household size - Black or African American
Average household size - Asian
Average household size - Hispanic or Latino
Average household size - American Indian and Alaska Native
Average household size - Multirace
Average household size - Other Race
Occupied housing units (%)
Vacant housing units (%)
Owner occupied housing units (%)
Renter occupied housing units (%)
Vacancy status - For rent (%)
Vacancy status - For sale only (%)
Vacancy status - Rented or sold, not occupied (%)
Vacancy status - For seasonal, recreational, or occasional use (%)
Vacancy status - For migrant workers (%)
Vacancy status - Other vacant (%)
Residents with income below the poverty level (%)
Residents with income below 50% of the poverty level (%)
Children below poverty level (%)
Poor families by family type - Married-couple family (%)
Poor families by family type - Male, no wife present (%)
Poor families by family type - Female, no husband present (%)
Poverty status for native-born residents (%)
Poverty status for foreign-born residents (%)
Poverty among high school graduates not in families (%)
Poverty among people who did not graduate high school not in families (%)
Residents with income below the poverty level (%) - White
Residents with income below the poverty level (%) - Black or African American
Residents with income below the poverty level (%) - Asian
Residents with income below the poverty level (%) - Hispanic or Latino
Residents with income below the poverty level (%) - American Indian and Alaska Native
Residents with income below the poverty level (%) - Multirace
Residents with income below the poverty level (%) - Other Race
Air pollution - Air Quality Index (AQI)
Air pollution - CO
Air pollution - NO2
Air pollution - SO2
Air pollution - Ozone
Air pollution - PM10
Air pollution - PM25
Air pollution - Pb
Crime - Murders per 100,000 population
Crime - Rapes per 100,000 population
Crime - Robberies per 100,000 population
Crime - Assaults per 100,000 population
Crime - Burglaries per 100,000 population
Crime - Thefts per 100,000 population
Crime - Auto thefts per 100,000 population
Crime - Arson per 100,000 population
Crime - City-data.com crime index
Crime - Violent crime index
Crime - Property crime index
Crime - Murders per 100,000 population (5 year average)
Crime - Rapes per 100,000 population (5 year average)
Crime - Robberies per 100,000 population (5 year average)
Crime - Assaults per 100,000 population (5 year average)
Crime - Burglaries per 100,000 population (5 year average)
Crime - Thefts per 100,000 population (5 year average)
Crime - Auto thefts per 100,000 population (5 year average)
Crime - Arson per 100,000 population (5 year average)
Crime - City-data.com crime index (5 year average)
Crime - Violent crime index (5 year average)
Crime - Property crime index (5 year average)
1996 Presidential Elections Results (%) - Democratic Party (Clinton)
1996 Presidential Elections Results (%) - Republican Party (Dole)
1996 Presidential Elections Results (%) - Other
2000 Presidential Elections Results (%) - Democratic Party (Gore)
2000 Presidential Elections Results (%) - Republican Party (Bush)
2000 Presidential Elections Results (%) - Other
2004 Presidential Elections Results (%) - Democratic Party (Kerry)
2004 Presidential Elections Results (%) - Republican Party (Bush)
2004 Presidential Elections Results (%) - Other
2008 Presidential Elections Results (%) - Democratic Party (Obama)
2008 Presidential Elections Results (%) - Republican Party (McCain)
2008 Presidential Elections Results (%) - Other
2012 Presidential Elections Results (%) - Democratic Party (Obama)
2012 Presidential Elections Results (%) - Republican Party (Romney)
2012 Presidential Elections Results (%) - Other
2016 Presidential Elections Results (%) - Democratic Party (Clinton)
2016 Presidential Elections Results (%) - Republican Party (Trump)
2016 Presidential Elections Results (%) - Other
2020 Presidential Elections Results (%) - Democratic Party (Biden)
2020 Presidential Elections Results (%) - Republican Party (Trump)
2020 Presidential Elections Results (%) - Other
Ancestries Reported - Arab (%)
Ancestries Reported - Czech (%)
Ancestries Reported - Danish (%)
Ancestries Reported - Dutch (%)
Ancestries Reported - English (%)
Ancestries Reported - French (%)
Ancestries Reported - French Canadian (%)
Ancestries Reported - German (%)
Ancestries Reported - Greek (%)
Ancestries Reported - Hungarian (%)
Ancestries Reported - Irish (%)
Ancestries Reported - Italian (%)
Ancestries Reported - Lithuanian (%)
Ancestries Reported - Norwegian (%)
Ancestries Reported - Polish (%)
Ancestries Reported - Portuguese (%)
Ancestries Reported - Russian (%)
Ancestries Reported - Scotch-Irish (%)
Ancestries Reported - Scottish (%)
Ancestries Reported - Slovak (%)
Ancestries Reported - Subsaharan African (%)
Ancestries Reported - Swedish (%)
Ancestries Reported - Swiss (%)
Ancestries Reported - Ukrainian (%)
Ancestries Reported - United States (%)
Ancestries Reported - Welsh (%)
Ancestries Reported - West Indian (%)
Ancestries Reported - Other (%)
Educational Attainment - No schooling completed (%)
Educational Attainment - Less than high school (%)
Educational Attainment - High school or equivalent (%)
Educational Attainment - Less than 1 year of college (%)
Educational Attainment - 1 or more years of college (%)
Educational Attainment - Associate degree (%)
Educational Attainment - Bachelor's degree (%)
Educational Attainment - Master's degree (%)
Educational Attainment - Professional school degree (%)
Educational Attainment - Doctorate degree (%)
School Enrollment - Nursery, preschool (%)
School Enrollment - Kindergarten (%)
School Enrollment - Grade 1 to 4 (%)
School Enrollment - Grade 5 to 8 (%)
School Enrollment - Grade 9 to 12 (%)
School Enrollment - College undergrad (%)
School Enrollment - Graduate or professional (%)
School Enrollment - Not enrolled in school (%)
School enrollment - Public schools (%)
School enrollment - Private schools (%)
School enrollment - Not enrolled (%)
Median number of rooms in houses and condos
Median number of rooms in apartments
Housing units lacking complete plumbing facilities (%)
Housing units lacking complete kitchen facilities (%)
Density of houses
Urban houses (%)
Rural houses (%)
Households with people 60 years and over (%)
Households with people 65 years and over (%)
Households with people 75 years and over (%)
Households with one or more nonrelatives (%)
Households with no nonrelatives (%)
Population in households (%)
Family households (%)
Nonfamily households (%)
Population in families (%)
Family households with own children (%)
Median number of bedrooms in owner occupied houses
Mean number of bedrooms in owner occupied houses
Median number of bedrooms in renter occupied houses
Mean number of bedrooms in renter occupied houses
Median number of vehichles in owner occupied houses
Mean number of vehichles in owner occupied houses
Median number of vehichles in renter occupied houses
Mean number of vehichles in renter occupied houses
Mortgage status - with mortgage (%)
Mortgage status - with second mortgage (%)
Mortgage status - with home equity loan (%)
Mortgage status - with both second mortgage and home equity loan (%)
Mortgage status - without a mortgage (%)
Average family size
Average family size - White
Average family size - Black or African American
Average family size - Asian
Average family size - Hispanic or Latino
Average family size - American Indian and Alaska Native
Average family size - Multirace
Average family size - Other Race
Geographical mobility - Same house 1 year ago (%)
Geographical mobility - Moved within same county (%)
Geographical mobility - Moved from different county within same state (%)
Geographical mobility - Moved from different state (%)
Geographical mobility - Moved from abroad (%)
Place of birth - Born in state of residence (%)
Place of birth - Born in other state (%)
Place of birth - Native, outside of US (%)
Place of birth - Foreign born (%)
Housing units in structures - 1, detached (%)
Housing units in structures - 1, attached (%)
Housing units in structures - 2 (%)
Housing units in structures - 3 or 4 (%)
Housing units in structures - 5 to 9 (%)
Housing units in structures - 10 to 19 (%)
Housing units in structures - 20 to 49 (%)
Housing units in structures - 50 or more (%)
Housing units in structures - Mobile home (%)
Housing units in structures - Boat, RV, van, etc. (%)
House/condo owner moved in on average (years ago)
Renter moved in on average (years ago)
Year householder moved into unit - Moved in 1999 to March 2000 (%)
Year householder moved into unit - Moved in 1995 to 1998 (%)
Year householder moved into unit - Moved in 1990 to 1994 (%)
Year householder moved into unit - Moved in 1980 to 1989 (%)
Year householder moved into unit - Moved in 1970 to 1979 (%)
Year householder moved into unit - Moved in 1969 or earlier (%)
Means of transportation to work - Drove car alone (%)
Means of transportation to work - Carpooled (%)
Means of transportation to work - Public transportation (%)
Means of transportation to work - Bus or trolley bus (%)
Means of transportation to work - Streetcar or trolley car (%)
Means of transportation to work - Subway or elevated (%)
Means of transportation to work - Railroad (%)
Means of transportation to work - Ferryboat (%)
Means of transportation to work - Taxicab (%)
Means of transportation to work - Motorcycle (%)
Means of transportation to work - Bicycle (%)
Means of transportation to work - Walked (%)
Means of transportation to work - Other means (%)
Working at home (%)
Industry diversity
Most Common Industries - Agriculture, forestry, fishing and hunting, and mining (%)
Most Common Industries - Agriculture, forestry, fishing and hunting (%)
Most Common Industries - Mining, quarrying, and oil and gas extraction (%)
Most Common Industries - Construction (%)
Most Common Industries - Manufacturing (%)
Most Common Industries - Wholesale trade (%)
Most Common Industries - Retail trade (%)
Most Common Industries - Transportation and warehousing, and utilities (%)
Most Common Industries - Transportation and warehousing (%)
Most Common Industries - Utilities (%)
Most Common Industries - Information (%)
Most Common Industries - Finance and insurance, and real estate and rental and leasing (%)
Most Common Industries - Finance and insurance (%)
Most Common Industries - Real estate and rental and leasing (%)
Most Common Industries - Professional, scientific, and management, and administrative and waste management services (%)
Most Common Industries - Professional, scientific, and technical services (%)
Most Common Industries - Management of companies and enterprises (%)
Most Common Industries - Administrative and support and waste management services (%)
Most Common Industries - Educational services, and health care and social assistance (%)
Most Common Industries - Educational services (%)
Most Common Industries - Health care and social assistance (%)
Most Common Industries - Arts, entertainment, and recreation, and accommodation and food services (%)
Most Common Industries - Arts, entertainment, and recreation (%)
Most Common Industries - Accommodation and food services (%)
Most Common Industries - Other services, except public administration (%)
Most Common Industries - Public administration (%)
Occupation diversity
Most Common Occupations - Management, business, science, and arts occupations (%)
Most Common Occupations - Management, business, and financial occupations (%)
Most Common Occupations - Management occupations (%)
Most Common Occupations - Business and financial operations occupations (%)
Most Common Occupations - Computer, engineering, and science occupations (%)
Most Common Occupations - Computer and mathematical occupations (%)
Most Common Occupations - Architecture and engineering occupations (%)
Most Common Occupations - Life, physical, and social science occupations (%)
Most Common Occupations - Education, legal, community service, arts, and media occupations (%)
Most Common Occupations - Community and social service occupations (%)
Most Common Occupations - Legal occupations (%)
Most Common Occupations - Education, training, and library occupations (%)
Most Common Occupations - Arts, design, entertainment, sports, and media occupations (%)
Most Common Occupations - Healthcare practitioners and technical occupations (%)
Most Common Occupations - Health diagnosing and treating practitioners and other technical occupations (%)
Most Common Occupations - Health technologists and technicians (%)
Most Common Occupations - Service occupations (%)
Most Common Occupations - Healthcare support occupations (%)
Most Common Occupations - Protective service occupations (%)
Most Common Occupations - Fire fighting and prevention, and other protective service workers including supervisors (%)
Most Common Occupations - Law enforcement workers including supervisors (%)
Most Common Occupations - Food preparation and serving related occupations (%)
Most Common Occupations - Building and grounds cleaning and maintenance occupations (%)
Most Common Occupations - Personal care and service occupations (%)
Most Common Occupations - Sales and office occupations (%)
Most Common Occupations - Sales and related occupations (%)
Most Common Occupations - Office and administrative support occupations (%)
Most Common Occupations - Natural resources, construction, and maintenance occupations (%)
Most Common Occupations - Farming, fishing, and forestry occupations (%)
Most Common Occupations - Construction and extraction occupations (%)
Most Common Occupations - Installation, maintenance, and repair occupations (%)
Most Common Occupations - Production, transportation, and material moving occupations (%)
Most Common Occupations - Production occupations (%)
Most Common Occupations - Transportation occupations (%)
Most Common Occupations - Material moving occupations (%)
People in Group quarters - Institutionalized population (%)
People in Group quarters - Correctional institutions (%)
People in Group quarters - Federal prisons and detention centers (%)
People in Group quarters - Halfway houses (%)
People in Group quarters - Local jails and other confinement facilities (including police lockups) (%)
People in Group quarters - Military disciplinary barracks (%)
People in Group quarters - State prisons (%)
People in Group quarters - Other types of correctional institutions (%)
People in Group quarters - Nursing homes (%)
People in Group quarters - Hospitals/wards, hospices, and schools for the handicapped (%)
People in Group quarters - Hospitals/wards and hospices for chronically ill (%)
People in Group quarters - Hospices or homes for chronically ill (%)
People in Group quarters - Military hospitals or wards for chronically ill (%)
People in Group quarters - Other hospitals or wards for chronically ill (%)
People in Group quarters - Hospitals or wards for drug/alcohol abuse (%)
People in Group quarters - Mental (Psychiatric) hospitals or wards (%)
People in Group quarters - Schools, hospitals, or wards for the mentally retarded (%)
People in Group quarters - Schools, hospitals, or wards for the physically handicapped (%)
People in Group quarters - Institutions for the deaf (%)
People in Group quarters - Institutions for the blind (%)
People in Group quarters - Orthopedic wards and institutions for the physically handicapped (%)
People in Group quarters - Wards in general hospitals for patients who have no usual home elsewhere (%)
People in Group quarters - Wards in military hospitals for patients who have no usual home elsewhere (%)
People in Group quarters - Juvenile institutions (%)
People in Group quarters - Long-term care (%)
People in Group quarters - Homes for abused, dependent, and neglected children (%)
People in Group quarters - Residential treatment centers for emotionally disturbed children (%)
People in Group quarters - Training schools for juvenile delinquents (%)
People in Group quarters - Short-term care, detention or diagnostic centers for delinquent children (%)
People in Group quarters - Type of juvenile institution unknown (%)
People in Group quarters - Noninstitutionalized population (%)
People in Group quarters - College dormitories (includes college quarters off campus) (%)
People in Group quarters - Military quarters (%)
People in Group quarters - On base (%)
People in Group quarters - Barracks, unaccompanied personnel housing (UPH), (Enlisted/Officer), ;and similar group living quarters for military personnel (%)
People in Group quarters - Transient quarters for temporary residents (%)
People in Group quarters - Military ships (%)
People in Group quarters - Group homes (%)
People in Group quarters - Homes or halfway houses for drug/alcohol abuse (%)
People in Group quarters - Homes for the mentally ill (%)
People in Group quarters - Homes for the mentally retarded (%)
People in Group quarters - Homes for the physically handicapped (%)
People in Group quarters - Other group homes (%)
People in Group quarters - Religious group quarters (%)
People in Group quarters - Dormitories (%)
People in Group quarters - Agriculture workers' dormitories on farms (%)
People in Group quarters - Job Corps and vocational training facilities (%)
People in Group quarters - Other workers' dormitories (%)
People in Group quarters - Crews of maritime vessels (%)
People in Group quarters - Other nonhousehold living situations (%)
People in Group quarters - Other noninstitutional group quarters (%)
Residents speaking English at home (%)
Residents speaking English at home - Born in the United States (%)
Residents speaking English at home - Native, born elsewhere (%)
Residents speaking English at home - Foreign born (%)
Residents speaking Spanish at home (%)
Residents speaking Spanish at home - Born in the United States (%)
Residents speaking Spanish at home - Native, born elsewhere (%)
Residents speaking Spanish at home - Foreign born (%)
Residents speaking other language at home (%)
Residents speaking other language at home - Born in the United States (%)
Residents speaking other language at home - Native, born elsewhere (%)
Residents speaking other language at home - Foreign born (%)
Class of Workers - Employee of private company (%)
Class of Workers - Self-employed in own incorporated business (%)
Class of Workers - Private not-for-profit wage and salary workers (%)
Class of Workers - Local government workers (%)
Class of Workers - State government workers (%)
Class of Workers - Federal government workers (%)
Class of Workers - Self-employed workers in own not incorporated business and Unpaid family workers (%)
House heating fuel used in houses and condos - Utility gas (%)
House heating fuel used in houses and condos - Bottled, tank, or LP gas (%)
House heating fuel used in houses and condos - Electricity (%)
House heating fuel used in houses and condos - Fuel oil, kerosene, etc. (%)
House heating fuel used in houses and condos - Coal or coke (%)
House heating fuel used in houses and condos - Wood (%)
House heating fuel used in houses and condos - Solar energy (%)
House heating fuel used in houses and condos - Other fuel (%)
House heating fuel used in houses and condos - No fuel used (%)
House heating fuel used in apartments - Utility gas (%)
House heating fuel used in apartments - Bottled, tank, or LP gas (%)
House heating fuel used in apartments - Electricity (%)
House heating fuel used in apartments - Fuel oil, kerosene, etc. (%)
House heating fuel used in apartments - Coal or coke (%)
House heating fuel used in apartments - Wood (%)
House heating fuel used in apartments - Solar energy (%)
House heating fuel used in apartments - Other fuel (%)
House heating fuel used in apartments - No fuel used (%)
Armed forces status - In Armed Forces (%)
Armed forces status - Civilian (%)
Armed forces status - Civilian - Veteran (%)
Armed forces status - Civilian - Nonveteran (%)
Fatal accidents locations in years 2005-2021
Fatal accidents locations in 2005
Fatal accidents locations in 2006
Fatal accidents locations in 2007
Fatal accidents locations in 2008
Fatal accidents locations in 2009
Fatal accidents locations in 2010
Fatal accidents locations in 2011
Fatal accidents locations in 2012
Fatal accidents locations in 2013
Fatal accidents locations in 2014
Fatal accidents locations in 2015
Fatal accidents locations in 2016
Fatal accidents locations in 2017
Fatal accidents locations in 2018
Fatal accidents locations in 2019
Fatal accidents locations in 2020
Fatal accidents locations in 2021
Alcohol use - People drinking some alcohol every month (%)
Alcohol use - People not drinking at all (%)
Alcohol use - Average days/month drinking alcohol
Alcohol use - Average drinks/week
Alcohol use - Average days/year people drink much
Audiometry - Average condition of hearing (%)
Audiometry - People that can hear a whisper from across a quiet room (%)
Audiometry - People that can hear normal voice from across a quiet room (%)
Audiometry - Ears ringing, roaring, buzzing (%)
Audiometry - Had a job exposure to loud noise (%)
Audiometry - Had off-work exposure to loud noise (%)
Blood Pressure & Cholesterol - Has high blood pressure (%)
Blood Pressure & Cholesterol - Checking blood pressure at home (%)
Blood Pressure & Cholesterol - Frequently checking blood cholesterol (%)
Blood Pressure & Cholesterol - Has high cholesterol level (%)
Consumer Behavior - Money monthly spent on food at supermarket/grocery store
Consumer Behavior - Money monthly spent on food at other stores
Consumer Behavior - Money monthly spent on eating out
Consumer Behavior - Money monthly spent on carryout/delivered foods
Consumer Behavior - Income spent on food at supermarket/grocery store (%)
Consumer Behavior - Income spent on food at other stores (%)
Consumer Behavior - Income spent on eating out (%)
Consumer Behavior - Income spent on carryout/delivered foods (%)
Current Health Status - General health condition (%)
Current Health Status - Blood donors (%)
Current Health Status - Has blood ever tested for HIV virus (%)
Current Health Status - Left-handed people (%)
Dermatology - People using sunscreen (%)
Diabetes - Diabetics (%)
Diabetes - Had a blood test for high blood sugar (%)
Diabetes - People taking insulin (%)
Diet Behavior & Nutrition - Diet health (%)
Diet Behavior & Nutrition - Milk product consumption (# of products/month)
Diet Behavior & Nutrition - Meals not home prepared (#/week)
Diet Behavior & Nutrition - Meals from fast food or pizza place (#/week)
Diet Behavior & Nutrition - Ready-to-eat foods (#/month)
Diet Behavior & Nutrition - Frozen meals/pizza (#/month)
Drug Use - People that ever used marijuana or hashish (%)
Drug Use - Ever used hard drugs (%)
Drug Use - Ever used any form of cocaine (%)
Drug Use - Ever used heroin (%)
Drug Use - Ever used methamphetamine (%)
Health Insurance - People covered by health insurance (%)
Kidney Conditions-Urology - Avg. # of times urinating at night
Medical Conditions - People with asthma (%)
Medical Conditions - People with anemia (%)
Medical Conditions - People with psoriasis (%)
Medical Conditions - People with overweight (%)
Medical Conditions - Elderly people having difficulties in thinking or remembering (%)
Medical Conditions - People who ever received blood transfusion (%)
Medical Conditions - People having trouble seeing even with glass/contacts (%)
Medical Conditions - People with arthritis (%)
Medical Conditions - People with gout (%)
Medical Conditions - People with congestive heart failure (%)
Medical Conditions - People with coronary heart disease (%)
Medical Conditions - People with angina pectoris (%)
Medical Conditions - People who ever had heart attack (%)
Medical Conditions - People who ever had stroke (%)
Medical Conditions - People with emphysema (%)
Medical Conditions - People with thyroid problem (%)
Medical Conditions - People with chronic bronchitis (%)
Medical Conditions - People with any liver condition (%)
Medical Conditions - People who ever had cancer or malignancy (%)
Mental Health - People who have little interest in doing things (%)
Mental Health - People feeling down, depressed, or hopeless (%)
Mental Health - People who have trouble sleeping or sleeping too much (%)
Mental Health - People feeling tired or having little energy (%)
Mental Health - People with poor appetite or overeating (%)
Mental Health - People feeling bad about themself (%)
Mental Health - People who have trouble concentrating on things (%)
Mental Health - People moving or speaking slowly or too fast (%)
Mental Health - People having thoughts they would be better off dead (%)
Oral Health - Average years since last visit a dentist
Oral Health - People embarrassed because of mouth (%)
Oral Health - People with gum disease (%)
Oral Health - General health of teeth and gums (%)
Oral Health - Average days a week using dental floss/device
Oral Health - Average days a week using mouthwash for dental problem
Oral Health - Average number of teeth
Pesticide Use - Households using pesticides to control insects (%)
Pesticide Use - Households using pesticides to kill weeds (%)
Physical Activity - People doing vigorous-intensity work activities (%)
Physical Activity - People doing moderate-intensity work activities (%)
Physical Activity - People walking or bicycling (%)
Physical Activity - People doing vigorous-intensity recreational activities (%)
Physical Activity - People doing moderate-intensity recreational activities (%)
Physical Activity - Average hours a day doing sedentary activities
Physical Activity - Average hours a day watching TV or videos
Physical Activity - Average hours a day using computer
Physical Functioning - People having limitations keeping them from working (%)
Physical Functioning - People limited in amount of work they can do (%)
Physical Functioning - People that need special equipment to walk (%)
Physical Functioning - People experiencing confusion/memory problems (%)
Physical Functioning - People requiring special healthcare equipment (%)
Prescription Medications - Average number of prescription medicines taking
Preventive Aspirin Use - Adults 40+ taking low-dose aspirin (%)
Reproductive Health - Vaginal deliveries (%)
Reproductive Health - Cesarean deliveries (%)
Reproductive Health - Deliveries resulted in a live birth (%)
Reproductive Health - Pregnancies resulted in a delivery (%)
Reproductive Health - Women breastfeeding newborns (%)
Reproductive Health - Women that had a hysterectomy (%)
Reproductive Health - Women that had both ovaries removed (%)
Reproductive Health - Women that have ever taken birth control pills (%)
Reproductive Health - Women taking birth control pills (%)
Reproductive Health - Women that have ever used Depo-Provera or injectables (%)
Reproductive Health - Women that have ever used female hormones (%)
Sexual Behavior - People 18+ that ever had sex (vaginal, anal, or oral) (%)
Sexual Behavior - Males 18+ that ever had vaginal sex with a woman (%)
Sexual Behavior - Males 18+ that ever performed oral sex on a woman (%)
Sexual Behavior - Males 18+ that ever had anal sex with a woman (%)
Sexual Behavior - Males 18+ that ever had any sex with a man (%)
Sexual Behavior - Females 18+ that ever had vaginal sex with a man (%)
Sexual Behavior - Females 18+ that ever performed oral sex on a man (%)
Sexual Behavior - Females 18+ that ever had anal sex with a man (%)
Sexual Behavior - Females 18+ that ever had any kind of sex with a woman (%)
Sexual Behavior - Average age people first had sex
Sexual Behavior - Average number of female sex partners in lifetime (males 18+)
Sexual Behavior - Average number of female vaginal sex partners in lifetime (males 18+)
Sexual Behavior - Average age people first performed oral sex on a woman (18+)
Sexual Behavior - Average number of woman performed oral sex on in lifetime (18+)
Sexual Behavior - Average number of male sex partners in lifetime (males 18+)
Sexual Behavior - Average number of male anal sex partners in lifetime (males 18+)
Sexual Behavior - Average age people first performed oral sex on a man (18+)
Sexual Behavior - Average number of male oral sex partners in lifetime (18+)
Sexual Behavior - People using protection when performing oral sex (%)
Sexual Behavior - Average number of times people have vaginal or anal sex a year
Sexual Behavior - People having sex without condom (%)
Sexual Behavior - Average number of male sex partners in lifetime (females 18+)
Sexual Behavior - Average number of male vaginal sex partners in lifetime (females 18+)
Sexual Behavior - Average number of female sex partners in lifetime (females 18+)
Sexual Behavior - Circumcised males 18+ (%)
Sleep Disorders - Average hours sleeping at night
Sleep Disorders - People that has trouble sleeping (%)
Smoking-Cigarette Use - People smoking cigarettes (%)
Taste & Smell - People 40+ having problems with smell (%)
Taste & Smell - People 40+ having problems with taste (%)
Taste & Smell - People 40+ that ever had wisdom teeth removed (%)
Taste & Smell - People 40+ that ever had tonsils teeth removed (%)
Taste & Smell - People 40+ that ever had a loss of consciousness because of a head injury (%)
Taste & Smell - People 40+ that ever had a broken nose or other serious injury to face or skull (%)
Taste & Smell - People 40+ that ever had two or more sinus infections (%)
Weight - Average height (inches)
Weight - Average weight (pounds)
Weight - Average BMI
Weight - People that are obese (%)
Weight - People that ever were obese (%)
Weight - People trying to lose weight (%)
100%
urban population.
Estimated median house/condo value in 2022: $200,760
44319:
$200,760Ohio:
$204,100
According to our research of Ohio and other state lists, there were 29 registered sex offenders living in 44319 zip code as of April 27, 2024 . The ratio of all residents to sex offenders in zip code 44319 is 786 to 1.The ratio of registered sex offenders to all residents in this zip code is lower than the state average.
Median resident age: This zip code:
47.0 yearsOhio median age:
39.9 years
Average household size: This zip code:
2.3 peopleOhio:
2.4 people
Averages for the 2020 tax year for zip code 44319, filed in 2021:
Average Adjusted Gross Income (AGI) in 2020: $63,407 (Individual Income Tax Returns) Here:
$63,407State:
$67,288
Salary/wage: $53,167 (reported on 78.8% of returns )Here:
$53,167State:
$55,628
(% of AGI for various income ranges: 1062.2% for AGIs below $25k , 3426.1% for AGIs $25k-50k , 6232.3% for AGIs $50k-75k , 9237.1% for AGIs $75k-100k , 15998.8% for AGIs $100k-200k , 87928.8% for AGIs over 200k ) Taxable interest for individuals: $1,474 (reported on 28.4% of returns )This zip code:
$1,474Ohio:
$1,518
(% of AGI for various income ranges: 17.5% for AGIs below $25k , 25.3% for AGIs $25k-50k , 29.2% for AGIs $50k-75k , 41.4% for AGIs $75k-100k , 168.6% for AGIs $100k-200k , 1975.0% for AGIs over 200k ) Ordinary dividends: $5,170 (reported on 19.3% of returns )(% of AGI for various income ranges: 32.6% for AGIs below $25k , 28.5% for AGIs $25k-50k , 57.8% for AGIs $50k-75k , 143.9% for AGIs $75k-100k , 356.8% for AGIs $100k-200k , 6215.0% for AGIs over 200k ) Net capital gain/loss in AGI: +$14,435 (reported on 18.0% of returns )Here:
+$14,435State:
+$18,919
(% of AGI for various income ranges: 13.4% for AGIs below $25k , 28.8% for AGIs $25k-50k , 78.4% for AGIs $50k-75k , 220.2% for AGIs $75k-100k , 683.8% for AGIs $100k-200k , 25408.8% for AGIs over 200k ) Profit/loss from business: +$13,767 (reported on 14.5% of returns )Here:
+$13,767State:
+$13,744
(% of AGI for various income ranges: 120.3% for AGIs below $25k , 158.2% for AGIs $25k-50k , 140.3% for AGIs $50k-75k , 290.5% for AGIs $75k-100k , 631.5% for AGIs $100k-200k , 8140.0% for AGIs over 200k ) Taxable individual retirement arrangement distribution: $17,745 (reported on 11.3% of returns )44319:
$17,745Ohio:
$18,876
(% of AGI for various income ranges: 76.7% for AGIs below $25k , 113.9% for AGIs $25k-50k , 229.6% for AGIs $50k-75k , 430.7% for AGIs $75k-100k , 907.3% for AGIs $100k-200k , 4787.5% for AGIs over 200k ) Self-employed (Keogh) retirement plans: $30,725 (reported on 0.3% of returns )44319:
$30,725Ohio:
$24,898
(% of AGI for various income ranges: 22.1% for AGIs $50k-75k , 1116.2% for AGIs over 200k ) Total itemized deductions: $29,421 (reported on 5.6% of returns )Here:
$29,421State:
$33,869
(% of AGI for various income ranges: 37.3% for AGIs below $25k , 61.4% for AGIs $25k-50k , 162.7% for AGIs $50k-75k , 275.0% for AGIs $75k-100k , 756.8% for AGIs $100k-200k , 6722.5% for AGIs over 200k ) Charity contributions: $10,447 (reported on 4.3% of returns )Here:
$10,447State:
$14,577
(% of AGI for various income ranges: 5.1% for AGIs below $25k , 6.9% for AGIs $25k-50k , 37.4% for AGIs $50k-75k , 47.7% for AGIs $75k-100k , 192.3% for AGIs $100k-200k , 2900.0% for AGIs over 200k ) Taxes paid: $7,478 (reported on 5.5% of returns )(% of AGI for various income ranges: 7.0% for AGIs below $25k , 13.0% for AGIs $25k-50k , 48.6% for AGIs $50k-75k , 83.5% for AGIs $75k-100k , 194.0% for AGIs $100k-200k , 1470.0% for AGIs over 200k ) Earned income credit: $1,887 (reported on 10.8% of returns )(% of AGI for various income ranges: 59.6% for AGIs below $25k , 38.9% for AGIs $25k-50k , 1.0% for AGIs $50k-75k ) Percentage of individuals using paid preparers for their 2020 taxes: 93.5%(% for various income ranges: 92.1% for AGIs below $25k , 94.7% for AGIs $25k-50k , 94.6% for AGIs $50k-75k , 94.5% for AGIs $75k-100k , 92.3% for AGIs $100k-200k , 91.7% for AGIs over 200k )
Averages for the 2012 tax year for zip code 44319, filed in 2013:
Average Adjusted Gross Income (AGI) in 2012: $50,735 (Individual Income Tax Returns) Here:
$50,735State:
$54,926
Salary/wage: $44,037 (reported on 81.4% of returns )Here:
$44,037State:
$45,869
(% of AGI for various income ranges: 69.1% for AGIs below $25k , 76.3% for AGIs $25k-50k , 76.1% for AGIs $50k-75k , 75.7% for AGIs $75k-100k , 73.2% for AGIs $100k-200k , 45.8% for AGIs over 200k ) Taxable interest for individuals: $1,302 (reported on 34.0% of returns )This zip code:
$1,302Ohio:
$1,297
(% of AGI for various income ranges: 1.4% for AGIs below $25k , 0.8% for AGIs $25k-50k , 0.5% for AGIs $50k-75k , 0.7% for AGIs $75k-100k , 1.0% for AGIs $100k-200k , 1.3% for AGIs over 200k ) Ordinary dividends: $3,854 (reported on 19.7% of returns )(% of AGI for various income ranges: 1.7% for AGIs below $25k , 0.8% for AGIs $25k-50k , 1.1% for AGIs $50k-75k , 1.4% for AGIs $75k-100k , 1.6% for AGIs $100k-200k , 2.9% for AGIs over 200k ) Net capital gain/loss in AGI: +$8,889 (reported on 14.6% of returns )Here:
+$8,889State:
+$11,232
(% of AGI for various income ranges: 0.2% for AGIs $25k-50k , 0.4% for AGIs $50k-75k , 0.8% for AGIs $75k-100k , 1.4% for AGIs $100k-200k , 14.9% for AGIs over 200k ) Profit/loss from business: +$11,971 (reported on 13.5% of returns )Here:
+$11,971State:
+$12,773
(% of AGI for various income ranges: 7.7% for AGIs below $25k , 2.9% for AGIs $25k-50k , 2.1% for AGIs $50k-75k , 2.9% for AGIs $75k-100k , 2.2% for AGIs $100k-200k , 4.3% for AGIs over 200k ) Taxable individual retirement arrangement distribution: $12,023 (reported on 12.2% of returns )44319:
$12,023Ohio:
$14,511
(% of AGI for various income ranges: 4.0% for AGIs below $25k , 2.7% for AGIs $25k-50k , 2.9% for AGIs $50k-75k , 2.8% for AGIs $75k-100k , 3.6% for AGIs $100k-200k , 1.7% for AGIs over 200k ) Self-employment retirement plans: $13,760 (reported on 0.4% of returns )44319:
$13,760Ohio:
$20,257
(% of AGI for various income ranges: 0.2% for AGIs $25k-50k , 0.4% for AGIs $100k-200k ) Total itemized deductions: $18,204 (20% of AGI, reported on 32.6% of returns )Here:
$18,204State:
$21,278
Here:
20.3% of AGIState:
18.8% of AGI
(% of AGI for various income ranges: 8.3% for AGIs below $25k , 9.2% for AGIs $25k-50k , 12.0% for AGIs $50k-75k , 12.9% for AGIs $75k-100k , 14.3% for AGIs $100k-200k , 11.7% for AGIs over 200k ) Charity contributions: $3,013 (reported on 25.4% of returns )(% of AGI for various income ranges: 0.6% for AGIs below $25k , 0.9% for AGIs $25k-50k , 1.4% for AGIs $50k-75k , 1.6% for AGIs $75k-100k , 2.1% for AGIs $100k-200k , 2.1% for AGIs over 200k ) Taxes paid: $7,689 (reported on 32.6% of returns )(% of AGI for various income ranges: 1.7% for AGIs below $25k , 2.9% for AGIs $25k-50k , 4.4% for AGIs $50k-75k , 5.4% for AGIs $75k-100k , 7.0% for AGIs $100k-200k , 7.2% for AGIs over 200k ) Earned income credit: $1,980 (reported on 13.2% of returns )(% of AGI for various income ranges: 4.3% for AGIs below $25k , 0.6% for AGIs $25k-50k ) Percentage of individuals using paid preparers for their 2012 taxes: 52.5%(% for various income ranges: 46.7% for AGIs below $25k , 53.5% for AGIs $25k-50k , 57.4% for AGIs $50k-75k , 55.7% for AGIs $75k-100k , 56.4% for AGIs $100k-200k , 78.9% for AGIs over 200k )
Averages for the 2004 tax year for zip code 44319, filed in 2005:
Average Adjusted Gross Income (AGI) in 2004: $42,128 (Individual Income Tax Returns) Here:
$42,128State:
$44,480
Salary/wage: $38,519 (reported on 83.0% of returns )Here:
$38,519State:
$39,198
(% of AGI for various income ranges: 136.3% for AGIs below $10k , 70.2% for AGIs $10k-25k , 80.0% for AGIs $25k-50k , 81.0% for AGIs $50k-75k , 81.4% for AGIs $75k-100k , 61.8% for AGIs over 100k ) Taxable interest for individuals: $1,793 (reported on 45.5% of returns )This zip code:
$1,793Ohio:
$1,532
(% of AGI for various income ranges: 7.7% for AGIs below $10k , 3.3% for AGIs $10k-25k , 1.5% for AGIs $25k-50k , 1.4% for AGIs $50k-75k , 1.6% for AGIs $75k-100k , 2.4% for AGIs over 100k ) Taxable dividends: $2,421 (reported on 24.1% of returns )(% of AGI for various income ranges: 4.0% for AGIs below $10k , 1.6% for AGIs $10k-25k , 0.9% for AGIs $25k-50k , 1.1% for AGIs $50k-75k , 1.0% for AGIs $75k-100k , 2.3% for AGIs over 100k ) Net capital gain/loss: +$6,308 (reported on 17.2% of returns )Here:
+$6,308State:
+$8,582
(% of AGI for various income ranges: -0.2% for AGIs below $10k , 0.7% for AGIs $10k-25k , 0.3% for AGIs $25k-50k , 0.8% for AGIs $50k-75k , 1.1% for AGIs $75k-100k , 8.8% for AGIs over 100k ) Profit/loss from business: +$10,336 (reported on 14.4% of returns )Here:
+$10,336State:
+$10,813
(% of AGI for various income ranges: 11.6% for AGIs below $10k , 4.9% for AGIs $10k-25k , 2.3% for AGIs $25k-50k , 2.1% for AGIs $50k-75k , 2.9% for AGIs $75k-100k , 5.7% for AGIs over 100k ) IRA payment deduction: $2,923 (reported on 2.3% of returns )(% of AGI for various income ranges: 0.2% for AGIs $10k-25k , 0.2% for AGIs $25k-50k , 0.2% for AGIs $50k-75k , 0.1% for AGIs $75k-100k , 0.1% for AGIs over 100k ) Self-employed pension: $11,188 (reported on 0.7% of returns )(% of AGI for various income ranges: 0.2% for AGIs $10k-25k , 0.0% for AGIs $25k-50k , 0.1% for AGIs $50k-75k , 0.2% for AGIs $75k-100k , 0.4% for AGIs over 100k ) Total itemized deductions: $15,358 (22% of AGI, reported on 39.8% of returns )Here:
$15,358State:
$17,503
Here:
22.4% of AGIState:
20.8% of AGI
(% of AGI for various income ranges: 20.0% for AGIs below $10k , 10.0% for AGIs $10k-25k , 12.9% for AGIs $25k-50k , 16.1% for AGIs $50k-75k , 17.3% for AGIs $75k-100k , 14.5% for AGIs over 100k ) Charity contributions deductions: $2,317 (3% of AGI, reported on 32.6% of returns )Here:
3.2% of AGIState:
3.4% of AGI
(% of AGI for various income ranges: 0.8% for AGIs below $10k , 1.0% for AGIs $10k-25k , 1.3% for AGIs $25k-50k , 1.9% for AGIs $50k-75k , 2.3% for AGIs $75k-100k , 2.3% for AGIs over 100k ) Total tax: $5,523 (reported on 81.0% of returns )(% of AGI for various income ranges: 4.5% for AGIs below $10k , 4.5% for AGIs $10k-25k , 7.6% for AGIs $25k-50k , 9.1% for AGIs $50k-75k , 10.5% for AGIs $75k-100k , 18.2% for AGIs over 100k ) Earned income credit: $1,413 (reported on 9.9% of returns )Percentage of individuals using paid preparers for their 2004 taxes: 54.4%(% for various income ranges: 44.4% for AGIs below $10k , 53.2% for AGIs $10k-25k , 56.6% for AGIs $25k-50k , 58.5% for AGIs $50k-75k , 53.3% for AGIs $75k-100k , 66.4% for AGIs over 100k )
Estimated median household income in 2022: This zip code:
$75,432Ohio:
$65,720
Nearest zip codes: 44301 ,
44216 ,
44314 ,
44306 ,
44311 ,
44307 .
New Franklin Zip Code Map
Percentage of family households: This zip code:
43.4%Ohio:
43.3%
Percentage of households with unmarried partners: This zip code:
8.6%Ohio:
44.6%
Likely homosexual households (counted as self-reported same-sex unmarried-partner households)
Lesbian couples: 0.0% of all households Gay men: 0.2% of all households
Household received Food Stamps/SNAP in the past 12 months: 950Household did not receive Food Stamps/SNAP in the past 12 months: 8,747
Women who had a birth in the past 12 months: 142 (97 now married , 45 unmarried) Women who did not have a birth in the past 12 months: 4,637 (2,085 now married , 2,550 unmarried)
Housing units in zip code 44319 with a mortgage: 4,449 (591
second mortgage , 15
home equity loan , 564
both second mortgage and home equity loan )
Houses without a mortgage: 219
Median monthly owner costs for units with a mortgage: $1,292
Median monthly owner costs for units without a mortgage: $523
Residents with income below the poverty level in 2022:
This zip code:
6.7%Whole state:
13.4%
Residents with income below 50% of the poverty level in 2022:
This zip code:
4.1%Whole state:
7.0%
Median number of rooms in houses and condos: Median number of rooms in apartments: Notable locations in this zip code not listed on our city pages
Click to draw/clear zip code borders Notable locations in zip code 44319: (A) , Hol-Hi Golf Club (B) , Turkeyfoot Golf Course (C) , Upper Tuscarawas Wastewater Treatment Plant Number 36 (D) , Firestone Country Club (E) , Bay Side Picnic Area (F) , Big Oaks Picnic Area (G) , High Point Picnic Area (H) , Latham Lane Picnic Area (I) , Old Park Picnic Area (J) , North Turkeyfoot Industrial Park (K) , Coventry Township Fire Department (L) , New Franklin Fire Department Station 1 (M) , Green Fire Department Station 2 (N) . Display/hide their locations on the map
Shopping Centers: (1) , Coventry Plaza Shopping Center (2) . Display/hide their locations on the map
Churches in zip code 44319 include: (A) , Hope Church (B) , Pleasant Valley Church (C) . Display/hide their locations on the map
Cemeteries: (1) , Pleasant Valley Cemetery (2) . Display/hide their locations on the map
Lakes and reservoirs: (A) , Rex Lake (B) , Hower Lake (C) , Turkeyfoot Lake (D) , Wonder Lake (E) , Miller Lake (F) , Grape Lake (G) , Long Lake Channel (H) . Display/hide their locations on the map
River: (A) . Display/hide its location on the map
Parks in zip code 44319 include: (1) , Portage Lakes State Park (2) , Firestone Metropolitan Park (3) . Display/hide their locations on the map
Beach: (A) . Display/hide its location on the map
Tourist attraction (not listed on the city page) : (1) . Display/hide its approximate location on the map
Year house built (houses)
0 2020 or later117 2010 to 2019962 2000 to 2009874 1990 to 1999972 1980 to 19891,329 1970 to 19791,667 1960 to 19692,110 1950 to 1959777 1940 to 19491,247 1939 or earlier
Zip code 44319 household income distribution in 2022 455 Less than $10,000204 $10,000 to $14,999212 $15,000 to $19,999359 $20,000 to $24,999364 $25,000 to $29,999479 $30,000 to $34,999423 $35,000 to $39,999231 $40,000 to $44,999329 $45,000 to $49,999738 $50,000 to $59,999971 $60,000 to $74,9991,705 $75,000 to $99,9991,015 $100,000 to $124,999697 $125,000 to $149,999805 $150,000 to $199,999695 $200,000 or moreEstimate of home value of owner-occupied houses/condos in 2022 in zip code 44319 70 Less than $10,00037 $10,000 to $14,9998 $20,000 to $24,99910 $30,000 to $34,99921 $40,000 to $49,99989 $50,000 to $59,99935 $60,000 to $69,99996 $70,000 to $79,999109 $80,000 to $89,99951 $90,000 to $99,999642 $100,000 to $124,999460 $125,000 to $149,9991,505 $150,000 to $174,999734 $175,000 to $199,9991,154 $200,000 to $249,999522 $250,000 to $299,999732 $300,000 to $399,999467 $400,000 to $499,999318 $500,000 to $749,99972 $750,000 to $999,99911 $1,000,000 to $1,499,9997 $1,500,000 to $1,999,9996 $2,000,000 or moreRent paid by renters in 2022 in zip code 44319 8 $150 to $19921 $200 to $24910 $250 to $2998 $300 to $34958 $350 to $39933 $400 to $44954 $450 to $49957 $500 to $549100 $550 to $599129 $600 to $649118 $650 to $69919 $700 to $749236 $750 to $799372 $800 to $899343 $900 to $999494 $1,000 to $1,24971 $1,250 to $1,49976 $1,500 to $1,99929 $2,500 to $2,999259 No cash rent
Median gross rent in 2022: $1,024.
Median price asked for vacant for-sale houses and condos in 2022: $127,583.
Estimated median house (or condo) value in 2022 for: White Non-Hispanic householders: $200,931Black or African American householders: $249,658American Indian or Alaska Native householders: $279,789Asian householders: $100,896Two or more races householders: $115,703Hispanic or Latino householders: $224,520Estimated median house or condo value in 2022: $200,760
44319:
$200,760Ohio:
$204,100
Lower value quartile - upper value quartile: $158,102 - $281,010
Mean price in 2022: Detached houses: $244,722Here:
$244,722State:
$254,366
Townhouses or other attached units: $338,239Here:
$338,239State:
$225,733
In 2-unit structures: $522,819Here:
$522,819State:
$144,384
In 3-to-4-unit structures: $234,583Here:
$234,583State:
$203,002
In 5-or-more-unit structures: $91,699Here:
$91,699State:
$211,593
Mobile homes: $139,302Here:
$139,302State:
$62,719
Housing units in structures:
One, detached: 7,976One, attached: 390Two: 3503 or 4: 3425 to 9: 34410 to 19: 21220 to 49: 35350 or more: 98Mobile homes: 145Unemployment : 4.1%
Means of transportation to work in zip code 44319 78.0% 9,147 Drove a car alone7.9% 930 Carpooled0.1% 8 Bus or trolley bus0.2% 27 Railroad1.2% 135 Walked0.9% 109 Other means11.3% 1,321 Worked at homeTravel time to work (commute) in zip code 44319 236 Less than 5 minutes1,226 5 to 9 minutes1,663 10 to 14 minutes1,913 15 to 19 minutes1,824 20 to 24 minutes823 25 to 29 minutes1,342 30 to 34 minutes341 35 to 39 minutes320 40 to 44 minutes411 45 to 59 minutes195 60 to 89 minutes54 90 or more minutes
Neighborhoods in zip code 44319: Percentage of zip code residents living and working in this county: 78.9%
Household type by relationship:
Households: 22,160
Male householders: 4,670 (1,343 living alone ), Female householders: 5,038 (1,327 living alone )4,347 spouses (4,313 opposite-sex spouses ), 730 unmarried partners , (702 opposite-sex unmarried partners ), 5,389 children (5,133 natural , 52 adopted , 201 stepchildren ), 641 grandchildren , 59 brothers or sisters , 213 parents , 0 foster children , 208 other relatives , 581 non-relatives In group quarters: 309 (-1 institutionalized population )
Size of family households: 3,414 2-persons , 1,434 3-persons , 854 4-persons , 468 5-persons , 55 6-persons , 65 7-or-more-persons
Size of nonfamily households: 2,668 1-person , 708 2-persons , 26 3-persons , 9 4-persons , 6 5-persons
2,304 married couples with children. single-parent households (219 men , 513 women ).
97.1% of residents of 44319 zip code speak English at home. of residents speak Spanish at home (55% very well, 45% not well ).of residents speak other Indo-European language at home (79% very well, 15% well, 6% not well ).of residents speak Asian or Pacific Island language at home (66% very well, 3% well, 32% not well ).of residents speak other language at home (78% very well, 22% well ).
Foreign born population: 559 (2.5%)
(66.6%
of them are naturalized citizens )
This zip code:
2.5%Whole state:
5.0%
16% Sweden 11% Honduras 10% United Kingdom, excluding England and Scotland 8% Japan 8% Thailand 6% Russia 6% Zimbabwe 16% German 13% American 11% Irish 10% English 9% Italian 3% Polish 3% Hungarian
Year of entry for the foreign-born population
67 2010 or later 136 2000 to 2009 51 1990 to 1999 382 Before 1990
Facilities with environmental interests located in this zip code:
BP OIL CO SITE 03064 (4901 S MAIN in AKRON, OH)
STATE MASTER (Ohio general info) - RCRA-OHD987024668, HAZARDOUS WASTE PROGRAM, AIR MAJOR (Resource Conservation and Recovery Act (tracking hazardous waste)) Organizations: BP OIL COMPANY (CONTACT/OWNER)
, BARBARA A KEPLER (CONTACT/OWNER)
ANTHE S RESTAURANT (4315 MANCHESTER RD in AKRON, OH)
STATE MASTER (Ohio general info) - SDWIS-7773012, DRINKING WATER PROGRAM, PCS-OH0131555, National Pollutant Discharge Elimination System Permit National Pollutant Discharge Elimination System NON-MAJOR (Tracking pollutant discharge elimination systems) - permit Business SIC classification: EATING PLACESAlternative names: ANTHE'S, ANTHES RESTAURANT
ACTION AUTO (3100 MANCHESTER RD in AKRON, OH)
(Resource Conservation and Recovery Act (tracking hazardous waste)) Organizations: ACTION AUTO LIQUIDATION TRUST (CONTACT/OWNER)
AKRON TRANSMISSION INC (2416 S MAIN ST in AKRON, OH)
Conditionally Exempt Small Quantity Generators, less than 100 kg/month of hazardous waste (Resource Conservation and Recovery Act (tracking hazardous waste)) - notification Organizations: SAYRE GARY (CONTACT/OWNER)
Housing units lacking complete plumbing facilities: 1.6%
Housing units lacking complete kitchen facilities: 0.9%
89.9% Utility gas 8.0% Electricity 0.9% Bottled, tank, or LP gas 0.6% Fuel oil, kerosene, etc. 0.5% Other fuel
Population in 1990: 21,902. Population change in the 1990s: +196 (+0.9%).
Place of birth for U.S.-born residents:
This state: 18,139Northeast: 1,010Midwest: 641South: 1,229West: 451
63% of the 44319 zip code residents lived in the same house 5 years ago.
Out of people who lived in different houses, 71% lived in this county.
Out of people who lived in different counties, 50% lived in Ohio.
93% of the 44319 zip code residents lived in the same house 1 year ago.
Out of people who lived in different houses, 54% moved from this county.
Out of people who lived in different houses, 42% moved from different county within same state.
Out of people who lived in different houses, 7% moved from different state.
Private vs. public school enrollment:
Students in private schools in grades 1 to 8 (elementary and middle school): 244
Students in private schools in grades 9 to 12 (high school): 107
Students in private undergraduate colleges: 146
Occupation by median earnings in the past 12 months ($)
82,052 Architecture and engineering occupations 79,989 Management occupations 79,050 Law enforcement workers including supervisors 76,557 Fire fighting and prevention, and other protective service workers including supervisors 71,777 Computer and mathematical occupations 70,617 Health diagnosing and treating practitioners and other technical occupations
Companies with federal contracts located in this zip code:
CHEMEQUIP SALES, INC (1004 SWARTZ RD in AKRON, OH; small business) in 21 contracts from 2003 to 2006
Contracts for Diesel Engines and Components, Engine Air and Oil Filters, Strainers, and Cleaners, Nonaircraft, Miscellaneous Vehicular Components, Engine Fuel System Components, Nonaircraft by Defense Logistics AgencySigned by year: 2000: $0; 2001: $0; 2002: $0; 2003: $35,625; 2004: $152,499; 2005: $258,396; 2006: $37,509.
Biggest contracts: with Defense Logistics Agency for Diesel Engines and Components. Signed on 2004-03-10. Completion date: 2004-06-08.
, same as above. Signed on 2005-03-24. Completion date: 2005-06-08.
, same as above. Signed on 2003-11-19. Completion date: 2004-02-23.
, same as above. Signed on 2005-08-02. Completion date: 2005-09-30.
AA SOUND AND LIGHTING INC (551 PORTAGE LAKES DR #101 in AKRON, OH; small business)
$31,700 with Air Force for Installation of Equipment -- Electrical and Electronic Equipment Components. Taking place in DC. Signed on 2001-08-22. Completion date: 2001-08-26.
FAMOUS INDUSTRIES (807 E TURKEYFOOT LAKE ROAD in AKRON, OH) in 2 contracts from 2001 to 2002
$9,212 with Army for Telephone and Telegraph Equipment. Signed on 2001-09-24. Completion date: 2001-11-01.
, same as above. Signed on 2002-02-27. Completion date: 2002-03-05.
Top industries in this zip code by the number of employees in 2005:
Administrative and Support and Waste Management and Remediation Services: Security Guards and Patrol Services (500-999 employees: 1 establishment, 100-249 employees: 1 establishment)Accommodation and Food Services: Limited-Service Restaurants (50-99: 1, 20-49: 9, 10-19: 7, 5-9: 3, 1-4: 4)Accommodation and Food Services: Full-Service Restaurants (50-99: 2, 20-49: 4, 10-19: 6, 5-9: 2, 1-4: 3)Health Care and Social Assistance: Nursing Care Facilities (100-249: 1, 50-99: 1, 20-49: 1)Administrative and Support and Waste Management and Remediation Services: Temporary Help Services (100-249: 1, 20-49: 1)Arts, Entertainment, and Recreation: Golf Courses and Country Clubs (100-249: 1, 5-9: 1)Administrative and Support and Waste Management and Remediation Services: All Other Support Services (100-249: 1, 1-4: 2)Other Services (except Public Administration): Religious Organizations (20-49: 1, 10-19: 5, 5-9: 6, 1-4: 7)
People in group quarters in 2010:
185 people in nursing facilities/skilled-nursing facilities
22 people in group homes intended for adults
13 people in residential treatment centers for adults
11 people in emergency and transitional shelters (with sleeping facilities) for people experiencing homelessness
3 people in group homes for juveniles (non-correctional)
2 people in workers' group living quarters and job corps centers
People in group quarters in 2000:
210 people in nursing homes
40 people in other noninstitutional group quarters
39 people in homes or halfway houses for drug/alcohol abuse
15 people in other group homes
2 people in religious group quarters
Fatal accident statistics in 2014:
Fatal accident count: 1Vehicles involved in fatal accidents: 2Fatal accidents caused by drunken drivers: 0Fatalities: 1Persons involved in fatal accidents: 2Pedestrians involved in fatal accidents: 0
Fatal accident statistics in 2013:
Fatal accident count: 1Vehicles involved in fatal accidents: 2Fatal accidents caused by drunken drivers: 0Fatalities: 1Persons involved in fatal accidents: 3Pedestrians involved in fatal accidents: 0
Home Mortgage Disclosure Act Aggregated Statistics For Year 2009(Based on 4 full and 10 partial tracts) A) FHA, FSA/RHS & VA B) Conventional C) Refinancings D) Home Improvement Loans E) Loans on Dwellings For 5+ Families F) Non-occupant Loans on G) Loans On Manufactured Number Average Value Number Average Value Number Average Value Number Average Value Number Average Value Number Average Value Number Average Value
LOANS ORIGINATED 201 $115,680 125 $119,571 646 $139,874 36 $52,779 1 $2,011,150 47 $133,093 3 $49,560 APPLICATIONS APPROVED, NOT ACCEPTED 9 $80,953 13 $148,057 67 $113,222 10 $20,798 0 $0 1 $52,900 2 $43,270 APPLICATIONS DENIED 43 $106,953 16 $110,181 271 $151,346 49 $38,912 2 $531,735 18 $111,493 2 $44,625 APPLICATIONS WITHDRAWN 26 $104,854 10 $79,744 126 $135,171 6 $53,492 0 $0 16 $108,938 0 $0 FILES CLOSED FOR INCOMPLETENESS 2 $77,750 2 $205,895 31 $146,018 3 $115,590 0 $0 0 $0 0 $0
Aggregated Statistics For Year 2008(Based on 4 full and 10 partial tracts) A) FHA, FSA/RHS & VA B) Conventional C) Refinancings D) Home Improvement Loans E) Loans on Dwellings For 5+ Families F) Non-occupant Loans on G) Loans On Manufactured Number Average Value Number Average Value Number Average Value Number Average Value Number Average Value Number Average Value Number Average Value
LOANS ORIGINATED 155 $123,831 200 $132,139 416 $128,736 52 $44,002 1 $413,250 80 $96,246 4 $95,470 APPLICATIONS APPROVED, NOT ACCEPTED 5 $155,494 19 $181,180 59 $119,020 11 $23,614 0 $0 4 $63,385 0 $0 APPLICATIONS DENIED 32 $138,216 52 $161,241 335 $135,155 93 $49,462 1 $106,450 45 $133,011 3 $10,247 APPLICATIONS WITHDRAWN 9 $139,377 24 $108,219 116 $129,349 9 $81,170 0 $0 14 $89,894 1 $100,940 FILES CLOSED FOR INCOMPLETENESS 0 $0 8 $112,642 28 $128,292 1 $110,200 0 $0 0 $0 0 $0
Aggregated Statistics For Year 2007(Based on 4 full and 10 partial tracts) A) FHA, FSA/RHS & VA B) Conventional C) Refinancings D) Home Improvement Loans F) Non-occupant Loans on G) Loans On Manufactured Number Average Value Number Average Value Number Average Value Number Average Value Number Average Value Number Average Value
LOANS ORIGINATED 58 $117,932 458 $122,936 526 $135,962 85 $44,902 98 $136,444 1 $43,590 APPLICATIONS APPROVED, NOT ACCEPTED 0 $0 43 $116,199 115 $130,476 24 $54,287 14 $176,146 2 $50,975 APPLICATIONS DENIED 8 $133,165 95 $109,038 532 $136,021 115 $46,934 48 $121,505 2 $125,210 APPLICATIONS WITHDRAWN 7 $117,549 22 $178,927 179 $125,980 21 $37,510 12 $149,503 0 $0 FILES CLOSED FOR INCOMPLETENESS 1 $123,980 21 $117,767 54 $131,729 1 $58,960 6 $95,505 0 $0
Aggregated Statistics For Year 2006(Based on 4 full and 10 partial tracts) A) FHA, FSA/RHS & VA B) Conventional C) Refinancings D) Home Improvement Loans E) Loans on Dwellings For 5+ Families F) Non-occupant Loans on G) Loans On Manufactured Number Average Value Number Average Value Number Average Value Number Average Value Number Average Value Number Average Value Number Average Value
LOANS ORIGINATED 64 $125,487 661 $112,685 747 $124,437 137 $36,502 3 $590,867 106 $87,365 4 $38,675 APPLICATIONS APPROVED, NOT ACCEPTED 2 $112,945 39 $111,861 171 $108,235 16 $40,489 0 $0 17 $84,115 1 $5,510 APPLICATIONS DENIED 8 $129,171 131 $91,389 620 $127,402 126 $48,973 0 $0 67 $100,799 2 $22,040 APPLICATIONS WITHDRAWN 9 $166,854 80 $105,252 352 $133,606 34 $86,990 1 $22,040 21 $89,467 0 $0 FILES CLOSED FOR INCOMPLETENESS 0 $0 16 $106,271 95 $136,827 3 $40,347 0 $0 4 $62,202 0 $0
Aggregated Statistics For Year 2005(Based on 4 full and 10 partial tracts) A) FHA, FSA/RHS & VA B) Conventional C) Refinancings D) Home Improvement Loans E) Loans on Dwellings For 5+ Families F) Non-occupant Loans on G) Loans On Manufactured Number Average Value Number Average Value Number Average Value Number Average Value Number Average Value Number Average Value Number Average Value
LOANS ORIGINATED 64 $116,914 753 $125,564 964 $123,390 141 $52,157 2 $207,345 174 $99,578 3 $59,690 APPLICATIONS APPROVED, NOT ACCEPTED 6 $100,137 79 $92,140 237 $115,259 39 $51,468 0 $0 25 $99,773 2 $50,615 APPLICATIONS DENIED 9 $111,761 189 $130,775 751 $128,332 162 $42,312 1 $88,160 55 $83,959 17 $56,668 APPLICATIONS WITHDRAWN 2 $122,975 90 $163,326 488 $120,725 60 $140,414 2 $449,775 22 $102,937 12 $69,838 FILES CLOSED FOR INCOMPLETENESS 2 $155,060 36 $92,761 88 $127,780 7 $36,540 0 $0 2 $153,255 0 $0
Aggregated Statistics For Year 2004(Based on 4 full and 10 partial tracts) A) FHA, FSA/RHS & VA B) Conventional C) Refinancings D) Home Improvement Loans E) Loans on Dwellings For 5+ Families F) Non-occupant Loans on G) Loans On Manufactured Number Average Value Number Average Value Number Average Value Number Average Value Number Average Value Number Average Value Number Average Value
LOANS ORIGINATED 68 $126,725 641 $118,337 1,184 $113,443 110 $44,555 0 $0 151 $96,673 4 $28,692 APPLICATIONS APPROVED, NOT ACCEPTED 3 $188,203 106 $85,568 235 $106,272 21 $41,393 0 $0 32 $74,435 2 $11,295 APPLICATIONS DENIED 11 $135,043 150 $105,431 700 $126,231 110 $42,824 1 $103,040 67 $113,050 8 $20,551 APPLICATIONS WITHDRAWN 9 $158,753 56 $117,649 534 $123,971 47 $53,152 0 $0 20 $111,562 1 $193,410 FILES CLOSED FOR INCOMPLETENESS 4 $70,495 16 $115,388 115 $117,274 10 $30,299 0 $0 6 $141,700 0 $0
Aggregated Statistics For Year 2003(Based on 4 full and 10 partial tracts) A) FHA, FSA/RHS & VA B) Conventional C) Refinancings D) Home Improvement Loans F) Non-occupant Loans on Number Average Value Number Average Value Number Average Value Number Average Value Number Average Value
LOANS ORIGINATED 85 $115,840 601 $116,192 2,137 $111,337 74 $44,348 174 $92,345 APPLICATIONS APPROVED, NOT ACCEPTED 2 $50,485 48 $110,557 320 $107,164 22 $34,493 24 $110,328 APPLICATIONS DENIED 6 $106,207 95 $100,053 693 $106,210 72 $33,857 44 $78,965 APPLICATIONS WITHDRAWN 9 $114,111 75 $126,490 448 $124,424 13 $52,284 32 $103,349 FILES CLOSED FOR INCOMPLETENESS 3 $71,130 21 $134,490 101 $124,860 6 $58,030 1 $48,490
Aggregated Statistics For Year 2002(Based on 4 full and 8 partial tracts) A) FHA, FSA/RHS & VA B) Conventional C) Refinancings D) Home Improvement Loans F) Non-occupant Loans on Number Average Value Number Average Value Number Average Value Number Average Value Number Average Value
LOANS ORIGINATED 73 $108,295 514 $117,241 1,617 $108,206 67 $14,757 104 $93,182 APPLICATIONS APPROVED, NOT ACCEPTED 2 $97,950 52 $109,895 309 $104,930 24 $18,895 13 $82,101 APPLICATIONS DENIED 6 $110,463 67 $109,709 596 $99,749 80 $14,445 42 $80,298 APPLICATIONS WITHDRAWN 1 $79,340 49 $100,334 381 $114,713 15 $17,816 11 $84,446 FILES CLOSED FOR INCOMPLETENESS 0 $0 10 $73,976 103 $112,478 2 $24,995 2 $71,930
Aggregated Statistics For Year 2001(Based on 4 full and 8 partial tracts) A) FHA, FSA/RHS & VA B) Conventional C) Refinancings D) Home Improvement Loans E) Loans on Dwellings For 5+ Families F) Non-occupant Loans on Number Average Value Number Average Value Number Average Value Number Average Value Number Average Value Number Average Value
LOANS ORIGINATED 116 $108,944 586 $109,389 1,403 $102,815 102 $26,013 2 $432,720 103 $87,272 APPLICATIONS APPROVED, NOT ACCEPTED 8 $84,404 30 $83,086 257 $90,342 41 $28,552 2 $77,960 11 $40,878 APPLICATIONS DENIED 9 $90,693 80 $82,327 599 $98,972 91 $14,727 0 $0 27 $85,024 APPLICATIONS WITHDRAWN 5 $110,220 47 $97,846 316 $116,405 24 $21,067 0 $0 9 $106,163 FILES CLOSED FOR INCOMPLETENESS 6 $87,623 6 $123,455 101 $100,743 6 $46,537 0 $0 6 $132,957
Aggregated Statistics For Year 2000(Based on 4 full and 8 partial tracts) A) FHA, FSA/RHS & VA B) Conventional C) Refinancings D) Home Improvement Loans E) Loans on Dwellings For 5+ Families F) Non-occupant Loans on Number Average Value Number Average Value Number Average Value Number Average Value Number Average Value Number Average Value
LOANS ORIGINATED 114 $105,545 437 $103,161 531 $88,660 107 $17,636 4 $851,425 85 $74,766 APPLICATIONS APPROVED, NOT ACCEPTED 6 $71,630 36 $82,941 158 $73,270 39 $16,289 0 $0 7 $78,969 APPLICATIONS DENIED 12 $109,851 105 $72,212 355 $81,371 101 $18,615 0 $0 36 $63,197 APPLICATIONS WITHDRAWN 4 $94,178 52 $125,683 193 $86,905 10 $31,771 0 $0 18 $50,374 FILES CLOSED FOR INCOMPLETENESS 3 $78,030 11 $75,820 59 $84,790 7 $29,114 0 $0 12 $52,975
Aggregated Statistics For Year 1999(Based on 2 full and 4 partial tracts) A) FHA, FSA/RHS & VA B) Conventional C) Refinancings D) Home Improvement Loans F) Non-occupant Loans on Number Average Value Number Average Value Number Average Value Number Average Value Number Average Value
LOANS ORIGINATED 55 $98,277 236 $105,460 498 $84,173 66 $19,088 46 $67,573 APPLICATIONS APPROVED, NOT ACCEPTED 0 $0 25 $103,612 149 $74,356 27 $19,499 9 $46,378 APPLICATIONS DENIED 2 $121,035 45 $86,133 208 $81,888 69 $18,568 15 $53,332 APPLICATIONS WITHDRAWN 3 $76,317 26 $116,759 118 $83,775 10 $54,551 2 $76,220 FILES CLOSED FOR INCOMPLETENESS 0 $0 8 $76,256 42 $88,552 2 $43,755 14 $56,464
Private Mortgage Insurance Companies Aggregated Statistics For Year 2009(Based on 4 full and 10 partial tracts) A) Conventional B) Refinancings C) Non-occupant Loans on Number Average Value Number Average Value Number Average Value
LOANS ORIGINATED 35 $132,754 10 $154,762 2 $27,045 APPLICATIONS APPROVED, NOT ACCEPTED 12 $184,614 11 $201,253 0 $0 APPLICATIONS DENIED 5 $125,642 1 $76,040 0 $0 APPLICATIONS WITHDRAWN 0 $0 2 $175,220 0 $0 FILES CLOSED FOR INCOMPLETENESS 0 $0 0 $0 0 $0
Aggregated Statistics For Year 2008(Based on 4 full and 10 partial tracts) A) Conventional B) Refinancings C) Non-occupant Loans on Number Average Value Number Average Value Number Average Value
LOANS ORIGINATED 83 $136,504 40 $146,518 15 $77,147 APPLICATIONS APPROVED, NOT ACCEPTED 25 $154,296 15 $172,931 1 $136,650 APPLICATIONS DENIED 10 $169,860 7 $152,021 2 $161,970 APPLICATIONS WITHDRAWN 2 $166,955 3 $190,233 1 $66,670 FILES CLOSED FOR INCOMPLETENESS 0 $0 2 $100,065 2 $100,065
Aggregated Statistics For Year 2007(Based on 4 full and 10 partial tracts) A) Conventional B) Refinancings C) Non-occupant Loans on Number Average Value Number Average Value Number Average Value
LOANS ORIGINATED 204 $127,262 52 $132,598 23 $120,603 APPLICATIONS APPROVED, NOT ACCEPTED 19 $125,812 28 $148,652 4 $43,968 APPLICATIONS DENIED 3 $183,263 1 $162,940 0 $0 APPLICATIONS WITHDRAWN 5 $113,558 16 $158,945 0 $0 FILES CLOSED FOR INCOMPLETENESS 0 $0 0 $0 0 $0
Aggregated Statistics For Year 2006(Based on 4 full and 10 partial tracts) A) Conventional B) Refinancings C) Non-occupant Loans on D) Loans On Manufactured Number Average Value Number Average Value Number Average Value Number Average Value
LOANS ORIGINATED 145 $117,237 46 $141,263 8 $65,652 2 $50,975 APPLICATIONS APPROVED, NOT ACCEPTED 12 $110,812 32 $133,402 4 $131,600 0 $0 APPLICATIONS DENIED 0 $0 3 $154,650 0 $0 0 $0 APPLICATIONS WITHDRAWN 8 $79,769 8 $180,336 4 $62,350 0 $0 FILES CLOSED FOR INCOMPLETENESS 0 $0 0 $0 0 $0 0 $0
Aggregated Statistics For Year 2005(Based on 4 full and 10 partial tracts) A) Conventional B) Refinancings C) Non-occupant Loans on Number Average Value Number Average Value Number Average Value
LOANS ORIGINATED 105 $123,390 63 $145,354 11 $137,324 APPLICATIONS APPROVED, NOT ACCEPTED 12 $174,271 26 $143,780 2 $215,555 APPLICATIONS DENIED 2 $127,935 0 $0 0 $0 APPLICATIONS WITHDRAWN 0 $0 2 $114,945 0 $0 FILES CLOSED FOR INCOMPLETENESS 2 $123,505 0 $0 0 $0
Aggregated Statistics For Year 2004(Based on 4 full and 10 partial tracts) A) Conventional B) Refinancings C) Non-occupant Loans on Number Average Value Number Average Value Number Average Value
LOANS ORIGINATED 152 $126,518 100 $136,789 18 $101,212 APPLICATIONS APPROVED, NOT ACCEPTED 19 $128,445 60 $160,357 3 $178,897 APPLICATIONS DENIED 0 $0 7 $108,053 0 $0 APPLICATIONS WITHDRAWN 4 $106,295 15 $137,597 0 $0 FILES CLOSED FOR INCOMPLETENESS 2 $153,970 0 $0 0 $0
Aggregated Statistics For Year 2003(Based on 4 full and 10 partial tracts) A) Conventional B) Refinancings C) Non-occupant Loans on Number Average Value Number Average Value Number Average Value
LOANS ORIGINATED 164 $117,397 200 $133,974 16 $77,673 APPLICATIONS APPROVED, NOT ACCEPTED 33 $117,739 67 $142,531 7 $66,539 APPLICATIONS DENIED 0 $0 1 $147,670 0 $0 APPLICATIONS WITHDRAWN 2 $135,880 16 $125,373 2 $145,995 FILES CLOSED FOR INCOMPLETENESS 2 $131,620 4 $142,305 0 $0
Aggregated Statistics For Year 2002(Based on 4 full and 8 partial tracts) A) Conventional B) Refinancings C) Non-occupant Loans on Number Average Value Number Average Value Number Average Value
LOANS ORIGINATED 151 $120,321 175 $125,176 8 $68,462 APPLICATIONS APPROVED, NOT ACCEPTED 20 $141,860 52 $129,822 0 $0 APPLICATIONS DENIED 2 $114,675 4 $77,550 1 $108,550 APPLICATIONS WITHDRAWN 9 $149,611 28 $124,280 2 $141,835 FILES CLOSED FOR INCOMPLETENESS 2 $116,295 2 $128,445 0 $0
Aggregated Statistics For Year 2001(Based on 4 full and 8 partial tracts) A) Conventional B) Refinancings C) Non-occupant Loans on Number Average Value Number Average Value Number Average Value
LOANS ORIGINATED 172 $119,703 112 $127,937 15 $87,944 APPLICATIONS APPROVED, NOT ACCEPTED 14 $144,558 31 $135,890 0 $0 APPLICATIONS DENIED 4 $92,855 7 $105,120 6 $65,315 APPLICATIONS WITHDRAWN 5 $74,038 8 $124,330 0 $0 FILES CLOSED FOR INCOMPLETENESS 0 $0 2 $147,970 0 $0
Aggregated Statistics For Year 2000(Based on 4 full and 8 partial tracts) A) Conventional B) Refinancings C) Non-occupant Loans on Number Average Value Number Average Value Number Average Value
LOANS ORIGINATED 132 $119,917 54 $101,914 15 $92,431 APPLICATIONS APPROVED, NOT ACCEPTED 18 $140,951 9 $148,286 0 $0 APPLICATIONS DENIED 10 $103,556 6 $95,917 3 $83,460 APPLICATIONS WITHDRAWN 6 $83,565 2 $94,660 0 $0 FILES CLOSED FOR INCOMPLETENESS 4 $101,900 0 $0 0 $0
Aggregated Statistics For Year 1999(Based on 2 full and 4 partial tracts) A) Conventional B) Refinancings C) Non-occupant Loans on Number Average Value Number Average Value Number Average Value
LOANS ORIGINATED 86 $101,907 35 $102,841 1 $125,690 APPLICATIONS APPROVED, NOT ACCEPTED 7 $136,557 3 $115,830 1 $40,810 APPLICATIONS DENIED 3 $120,273 1 $100,700 0 $0 APPLICATIONS WITHDRAWN 2 $112,880 2 $106,385 0 $0 FILES CLOSED FOR INCOMPLETENESS 2 $106,795 1 $96,130 0 $0
2002 - 2018 National Fire Incident Reporting System (NFIRS) incidents See full 2006 National Fire Incident Reporting System statistics for zip code 44319, Ohio
Most common first names in zip code 44319 among deceased individuals Name Count Lived (average)
Mary 224 80.9 years John 222 73.5 years William 180 73.8 years Robert 164 71.5 years James 149 74.2 years Charles 108 76.1 years George 96 74.6 years Helen 95 80.8 years Joseph 84 76.4 years Margaret 80 78.9 years
Most common last names in zip code 44319 among deceased individuals Last name Count Lived (average)
Smith 86 74.3 years Miller 81 76.9 years Davis 39 74.1 years Johnson 38 70.1 years Jones 34 78.5 years Brown 28 79.3 years Williams 26 77.2 years Thomas 25 75.5 years Stewart 25 76.0 years Taylor 23 72.3 years
Businesses in zip code 44319
Name Count Name Count
AT&T 2 H&R Block 1 Ace Hardware 1 MasterBrand Cabinets 3 Advance Auto Parts 1 McDonald's 2 AutoZone 1 Panera Bread 1 Blockbuster 1 Papa John's Pizza 1 Burger King 2 Pizza Hut 2 Circle K 3 Rite Aid 2 Curves 1 Ryder Rental & Truck Leasing 1 Decora Cabinetry 2 Subway 5 Fashion Bug 1 U-Haul 2 FedEx 3 Walgreens 1 GNC 2 Wendy's 1 Goodwill 1


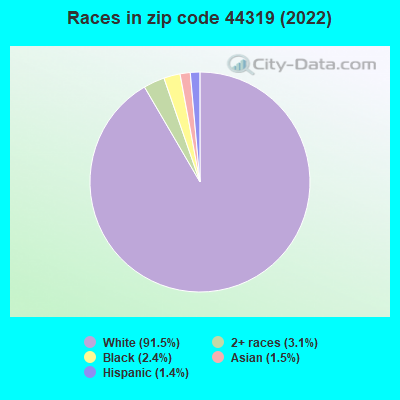


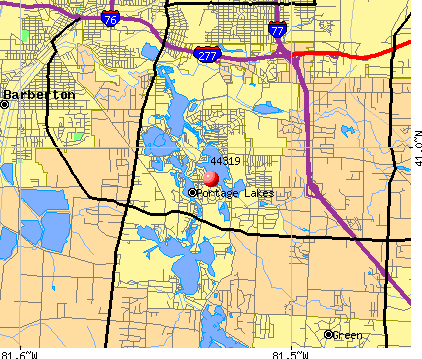 Nearest zip codes: 44301, 44216, 44314, 44306, 44311, 44307.
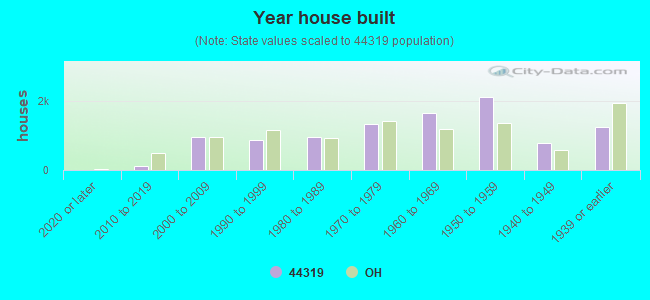

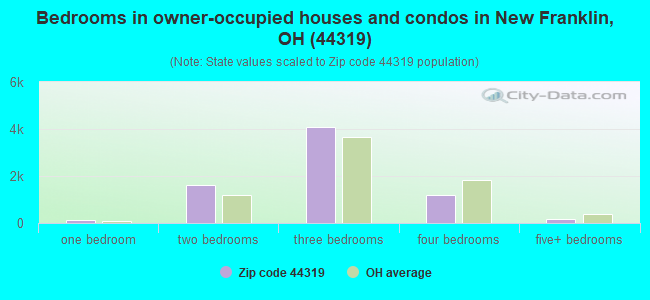
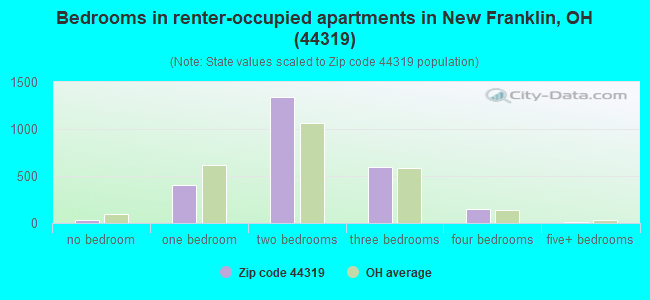
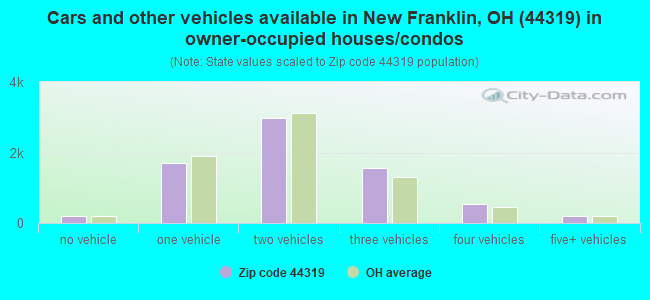
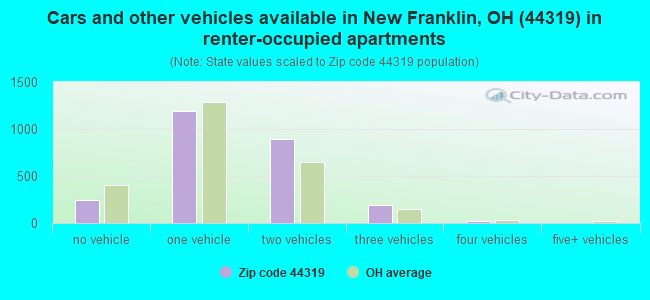


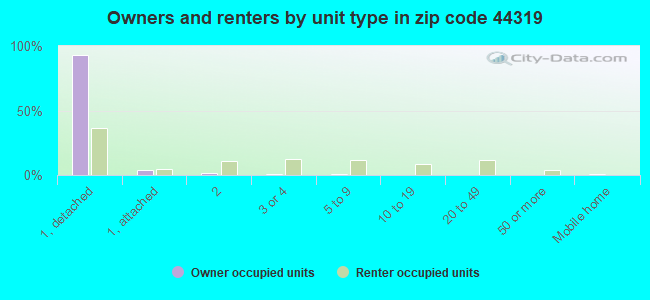
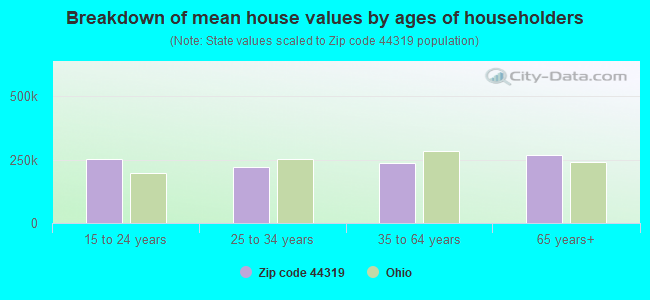


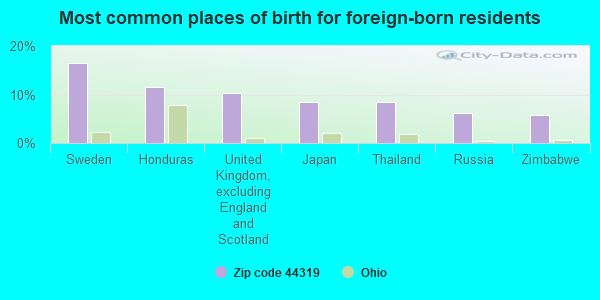
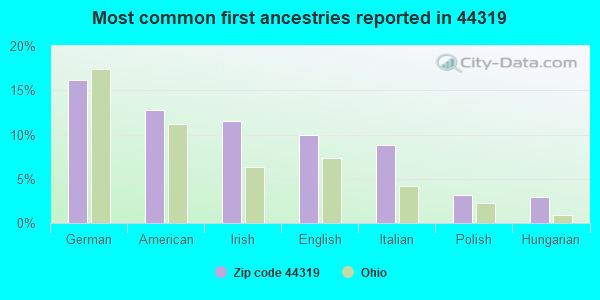
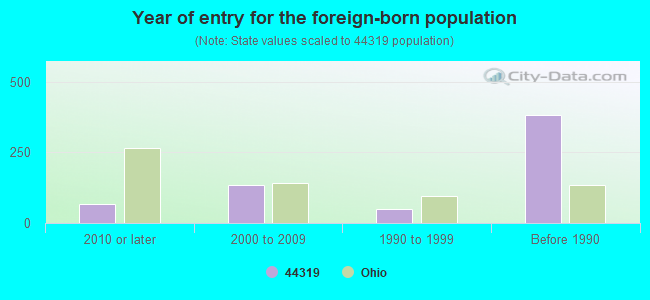


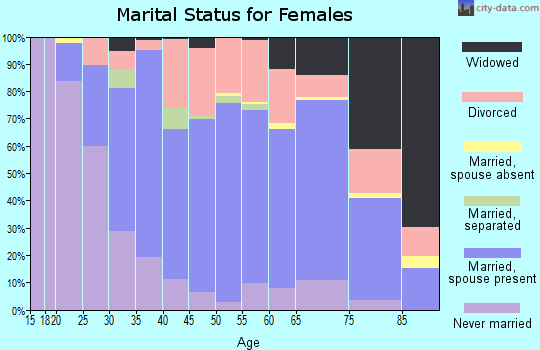
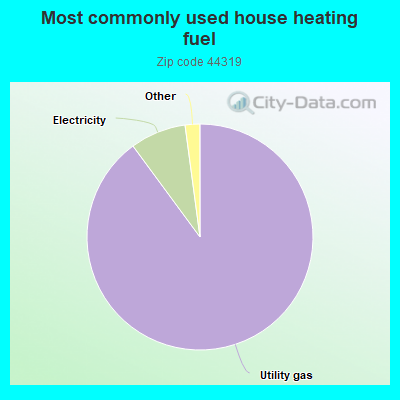
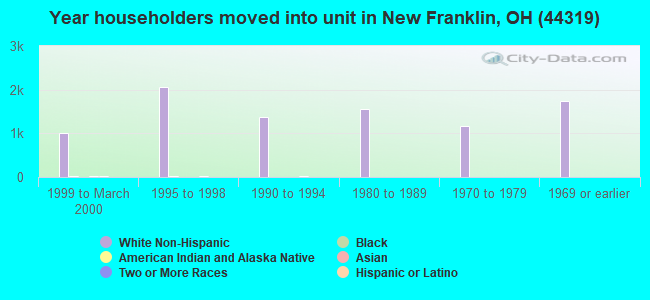
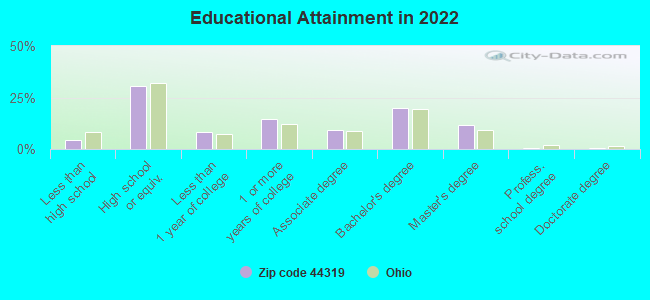
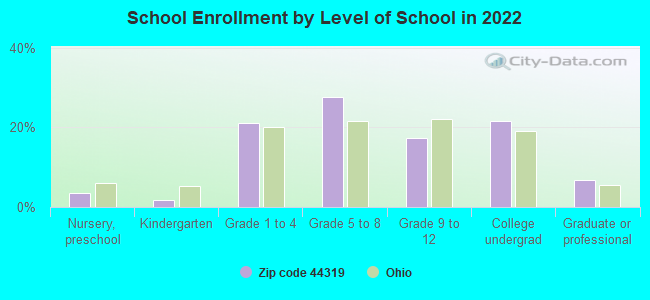
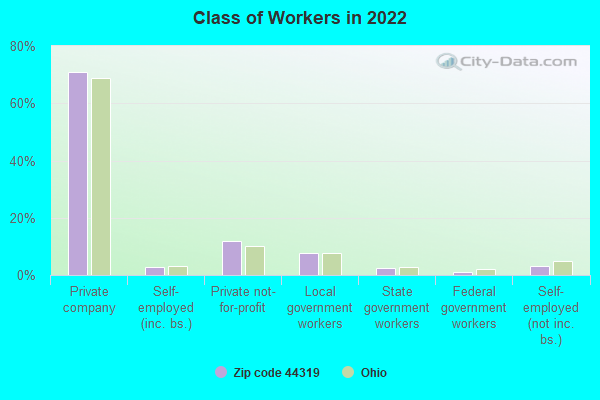
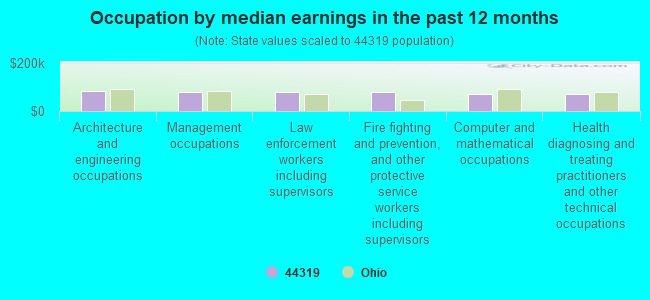
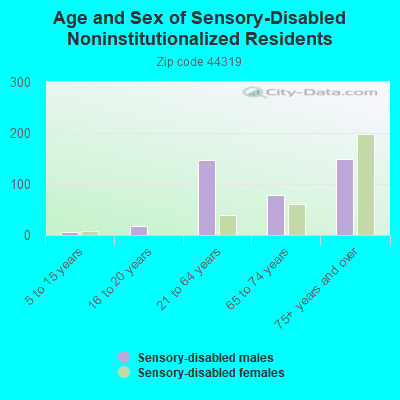
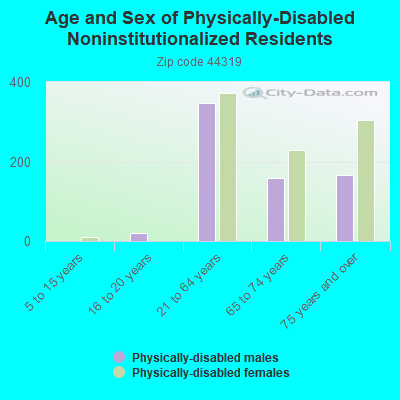
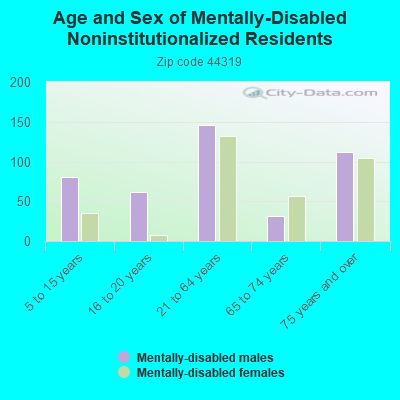
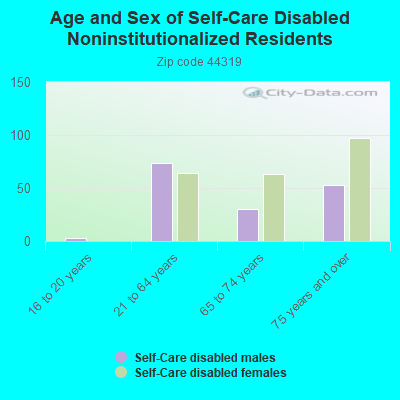
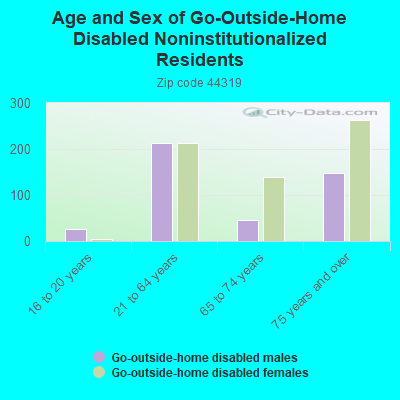
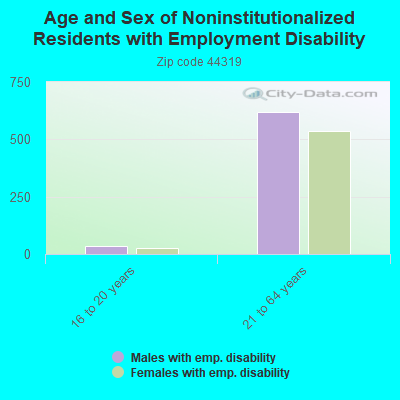
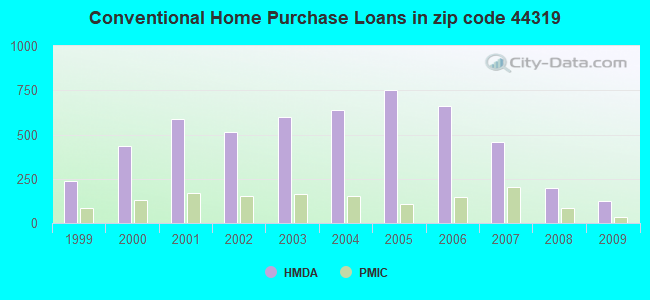
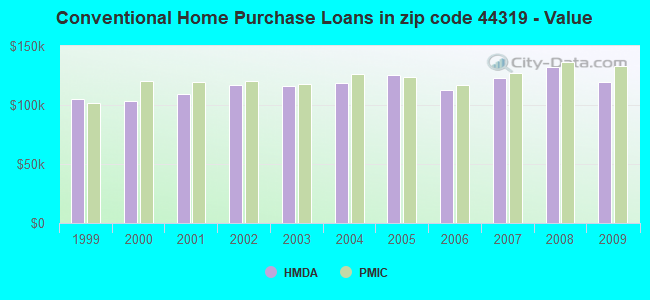
 According to the data from the years 2002 - 2018 the average number of fires per year is 90. The highest number of reported fire incidents - 122 took place in 2006, and the least - 34 in 2016. The data has a decreasing trend.
 When looking into fire subcategories, the most reports belonged to: Structure Fires (49.1%), and Outside Fires (30.7%).