Estimated zip code population in 2022: 4,705 Zip code population in 2010: 4,727 Zip code population in 2000: 4,961
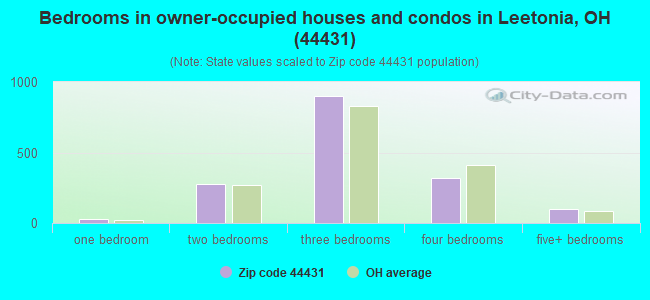
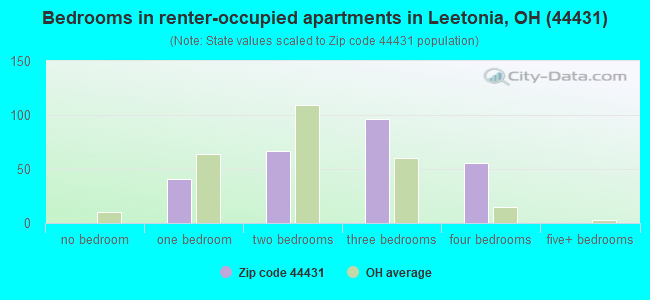
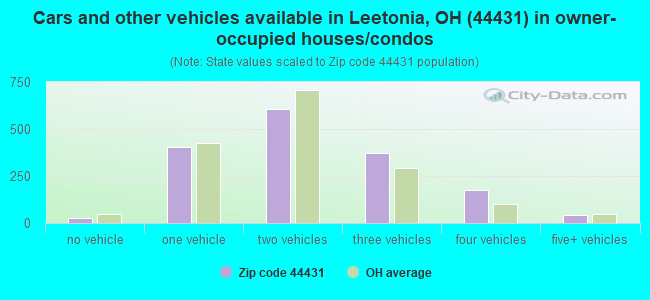
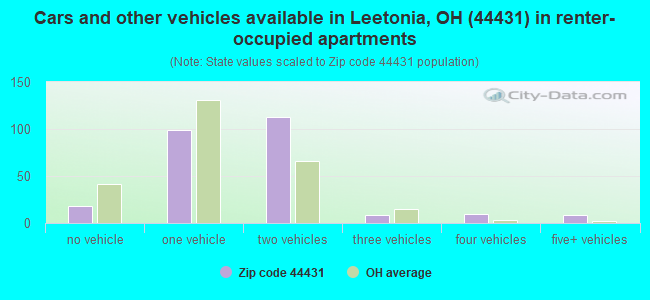
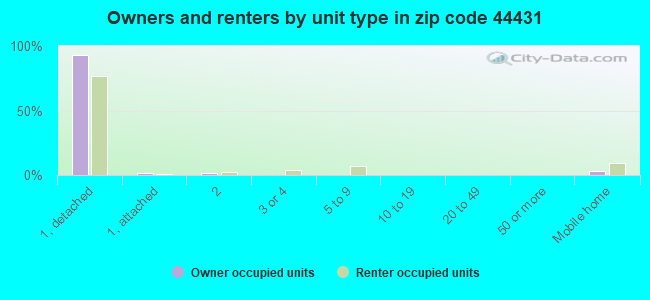
Houses and condos: 2,093 Renter-occupied apartments: 261
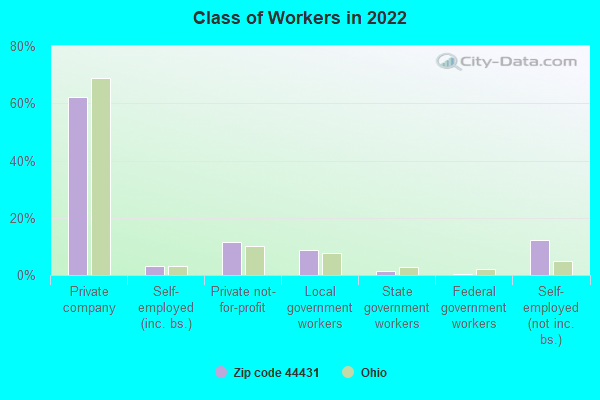
% of renters here:
14%
State:
33%
March 2022 cost of living index in zip code 44431: 82.8 (low, U.S. average is 100)
Land area: 26.3 sq. mi. Water area: 0.1 sq. mi.
Population density: 179 people per square mile
(very low).
OSM Map
General Map
Google Map
MSN Map
OSM Map
General Map
Google Map
MSN Map
OSM Map
General Map
Google Map
MSN Map
OSM Map
General Map
Google Map
MSN Map
Please wait while loading the map...
Real estate property taxes paid for housing units in 2022:
This zip code:
0.9% ($1,454)
Ohio:
1.3% ($2,639)
Median real estate property taxes paid for housing units with mortgages in 2022: $1,409 (0.9%) Median real estate property taxes paid for housing units with no mortgage in 2022: $1,513 (0.9%)
Business Search- 14 Million verified businesses
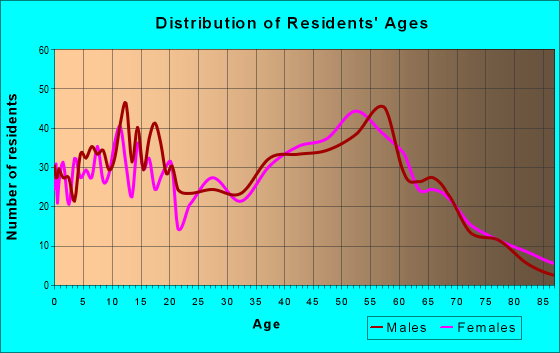
Males: 2,407
(51.2%)
Females: 2,298
(48.8%)
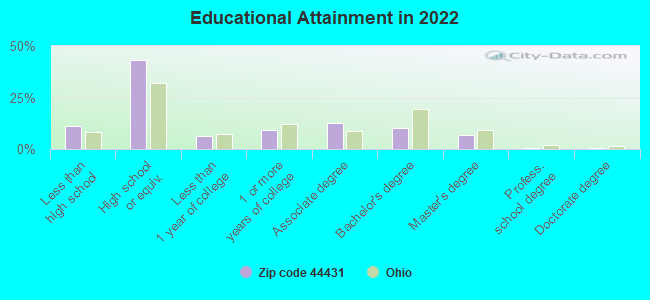
For population 25 years and over in 44431:
High school or higher: 87.6%
Bachelor's degree or higher: 17.7%
Graduate or professional degree: 7.8%
Unemployed: 3.3%
Mean travel time to work (commute): 23.6 minutes
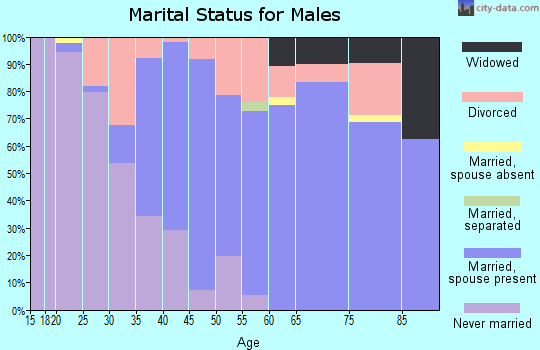
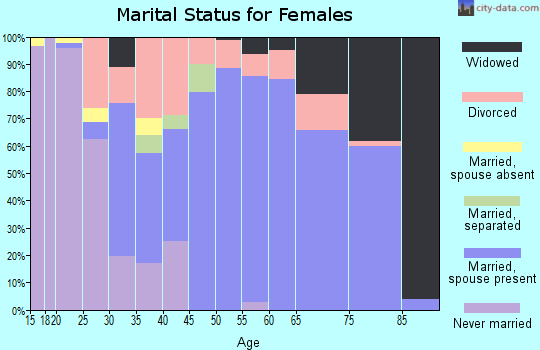
For population 15 years and over in 44431:
Never married: 23.5%
Now married: 56.1%
Separated: 1.7%
Widowed: 8.0%
Divorced: 10.7%
Zip code 44431 compared to state average:
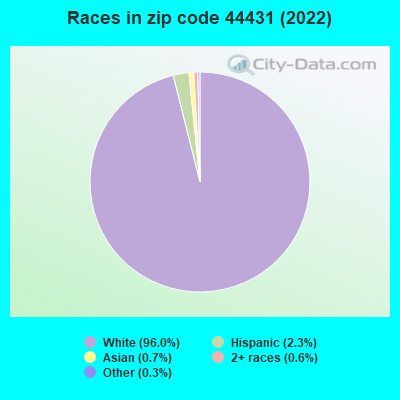
Black race population percentage significantly below state average.
Hispanic race population percentage below state average.
Median age above state average.
Foreign-born population percentage significantly below state average.
Renting percentage significantly below state average.
Length of stay since moving in above state average.
Percentage of population with a bachelor's degree or higher below state average.
Averages for the 2020 tax year for zip code 44431, filed in 2021:
Average Adjusted Gross Income (AGI) in 2020: $53,765 (Individual Income Tax Returns)
Here:
$53,765
State:
$67,288
Salary/wage: $45,782 (reported on 81.7% of returns)
Here:
$45,782
State:
$55,628
(% of AGI for various income ranges: 1147.7% for AGIs below $25k, 3580.4% for AGIs $25k-50k, 6336.9% for AGIs $50k-75k, 9202.0% for AGIs $75k-100k, 15037.1% for AGIs $100k-200k)
Taxable interest for individuals: $811 (reported on 24.3% of returns)
This zip code:
$811
Ohio:
$1,518
(% of AGI for various income ranges: 9.8% for AGIs below $25k, 9.2% for AGIs $25k-50k, 12.7% for AGIs $50k-75k, 56.7% for AGIs $75k-100k, 90.6% for AGIs $100k-200k)
Ordinary dividends: $2,807 (reported on 17.9% of returns)
Here:
$2,807
State:
$7,167
(% of AGI for various income ranges: 16.1% for AGIs below $25k, 33.8% for AGIs $25k-50k, 47.3% for AGIs $50k-75k, 33.3% for AGIs $75k-100k, 240.0% for AGIs $100k-200k)
Net capital gain/loss in AGI: +$7,141 (reported on 14.5% of returns)
Here:
+$7,141
State:
+$18,919
(% of AGI for various income ranges: 13.8% for AGIs below $25k, 31.8% for AGIs $25k-50k, 83.1% for AGIs $50k-75k, 84.0% for AGIs $75k-100k, 631.2% for AGIs $100k-200k)
Profit/loss from business: +$8,751 (reported on 14.9% of returns)
Here:
+$8,751
State:
+$13,744
(% of AGI for various income ranges: 67.9% for AGIs below $25k, 147.8% for AGIs $25k-50k, 185.8% for AGIs $50k-75k, 418.7% for AGIs $75k-100k, 490.0% for AGIs $100k-200k)
Taxable individual retirement arrangement distribution: $12,600 (reported on 9.8% of returns)
44431:
$12,600
Ohio:
$18,876
(% of AGI for various income ranges: 97.9% for AGIs below $25k, 86.2% for AGIs $25k-50k, 148.1% for AGIs $50k-75k, 321.3% for AGIs $75k-100k, 618.8% for AGIs $100k-200k)
Total itemized deductions: $36,960 (reported on 2.1% of returns)
Here:
$36,960
State:
$33,869
(% of AGI for various income ranges: 117.2% for AGIs $25k-50k, 742.4% for AGIs $100k-200k)
Charity contributions: $16,650 (reported on 1.7% of returns)
Here:
$16,650
State:
$14,577
(% of AGI for various income ranges: 391.8% for AGIs $100k-200k)
Taxes paid: $7,520 (reported on 2.1% of returns)
44431:
$7,520
State:
$7,681
(% of AGI for various income ranges: 21.8% for AGIs $25k-50k, 157.1% for AGIs $100k-200k)
Earned income credit: $2,168 (reported on 14.5% of returns)
Here:
$2,168
State:
$2,304
(% of AGI for various income ranges: 72.9% for AGIs below $25k, 65.8% for AGIs $25k-50k)
Percentage of individuals using paid preparers for their 2020 taxes: 94.0%
Here:
94%
State:
94%
(% for various income ranges: 92.7% for AGIs below $25k, 95.3% for AGIs $25k-50k, 94.4% for AGIs $50k-75k, 95.5% for AGIs $75k-100k, 92.6% for AGIs $100k-200k, 100.0% for AGIs over 200k)
Averages for the 2012 tax year for zip code 44431, filed in 2013:
Average Adjusted Gross Income (AGI) in 2012: $46,839 (Individual Income Tax Returns)
Here:
$46,839
State:
$54,926
Salary/wage: $38,352 (reported on 84.7% of returns)
Here:
$38,352
State:
$45,869
(% of AGI for various income ranges: 74.2% for AGIs below $25k, 79.2% for AGIs $25k-50k, 74.4% for AGIs $50k-75k, 78.9% for AGIs $75k-100k, 65.5% for AGIs $100k-200k, 27.4% for AGIs over 200k)
Taxable interest for individuals: $609 (reported on 29.4% of returns)
This zip code:
$609
Ohio:
$1,297
(% of AGI for various income ranges: 1.0% for AGIs below $25k, 0.4% for AGIs $25k-50k, 0.4% for AGIs $50k-75k, 0.3% for AGIs $75k-100k, 0.2% for AGIs $100k-200k, 0.2% for AGIs over 200k)
Ordinary dividends: $2,886 (reported on 18.7% of returns)
Here:
$2,886
State:
$5,821
(% of AGI for various income ranges: 1.3% for AGIs below $25k, 0.5% for AGIs $25k-50k, 0.8% for AGIs $50k-75k, 0.3% for AGIs $75k-100k, 3.4% for AGIs $100k-200k)
Net capital gain/loss in AGI: +$2,344 (reported on 11.5% of returns)
Here:
+$2,344
State:
+$11,232
(% of AGI for various income ranges: 0.9% for AGIs $75k-100k, 2.4% for AGIs $100k-200k)
Profit/loss from business: +$8,811 (reported on 15.3% of returns)
Here:
+$8,811
State:
+$12,773
(% of AGI for various income ranges: 6.0% for AGIs below $25k, 2.8% for AGIs $25k-50k, 4.1% for AGIs $50k-75k, 2.9% for AGIs $75k-100k, 1.7% for AGIs $100k-200k)
Taxable individual retirement arrangement distribution: $10,748 (reported on 9.8% of returns)
44431:
$10,748
Ohio:
$14,511
(% of AGI for various income ranges: 4.3% for AGIs below $25k, 1.9% for AGIs $25k-50k, 2.0% for AGIs $50k-75k, 3.1% for AGIs $75k-100k, 2.3% for AGIs $100k-200k)
Total itemized deductions: $19,416 (20% of AGI, reported on 19.1% of returns)
Here:
$19,416
State:
$21,278
Here:
20.1% of AGI
State:
18.8% of AGI
(% of AGI for various income ranges: 5.8% for AGIs below $25k, 4.7% for AGIs $25k-50k, 7.8% for AGIs $50k-75k, 7.2% for AGIs $75k-100k, 11.5% for AGIs $100k-200k, 11.2% for AGIs over 200k)
Charity contributions: $3,342 (reported on 14.0% of returns)
Here:
$3,342
State:
$3,943
(% of AGI for various income ranges: 0.7% for AGIs $25k-50k, 0.9% for AGIs $50k-75k, 1.1% for AGIs $75k-100k, 1.7% for AGIs $100k-200k, 1.4% for AGIs over 200k)
Taxes paid: $7,291 (reported on 18.7% of returns)
44431:
$7,291
State:
$9,568
(% of AGI for various income ranges: 0.8% for AGIs below $25k, 1.2% for AGIs $25k-50k, 2.5% for AGIs $50k-75k, 2.5% for AGIs $75k-100k, 5.4% for AGIs $100k-200k, 5.3% for AGIs over 200k)
Earned income credit: $2,256 (reported on 16.6% of returns)
Here:
$2,256
State:
$2,285
(% of AGI for various income ranges: 5.6% for AGIs below $25k, 1.0% for AGIs $25k-50k)
Percentage of individuals using paid preparers for their 2012 taxes: 60.0%
Here:
60%
State:
51%
(% for various income ranges: 52.7% for AGIs below $25k, 59.7% for AGIs $25k-50k, 61.1% for AGIs $50k-75k, 71.4% for AGIs $75k-100k, 76.5% for AGIs $100k-200k, 100.0% for AGIs over 200k)
Averages for the 2004 tax year for zip code 44431, filed in 2005:
Average Adjusted Gross Income (AGI) in 2004: $35,813 (Individual Income Tax Returns)
Here:
$35,813
State:
$44,480
Salary/wage: $32,352 (reported on 88.2% of returns)
Here:
$32,352
State:
$39,198
(% of AGI for various income ranges: 91.5% for AGIs below $10k, 82.0% for AGIs $10k-25k, 82.6% for AGIs $25k-50k, 87.6% for AGIs $50k-75k, 81.1% for AGIs $75k-100k, 57.0% for AGIs over 100k)
Taxable interest for individuals: $1,062 (reported on 42.9% of returns)
This zip code:
$1,062
Ohio:
$1,532
(% of AGI for various income ranges: 3.8% for AGIs below $10k, 2.4% for AGIs $10k-25k, 1.2% for AGIs $25k-50k, 0.5% for AGIs $50k-75k, 0.8% for AGIs $75k-100k, 1.8% for AGIs over 100k)
Taxable dividends: $2,903 (reported on 20.8% of returns)
Here:
$2,903
State:
$3,496
(% of AGI for various income ranges: 1.1% for AGIs below $10k, 1.0% for AGIs $10k-25k, 0.9% for AGIs $25k-50k, 0.5% for AGIs $50k-75k, 2.7% for AGIs $75k-100k, 4.7% for AGIs over 100k)
Net capital gain/loss: +$3,604 (reported on 15.3% of returns)
Here:
+$3,604
State:
+$8,582
(% of AGI for various income ranges: -0.5% for AGIs below $10k, 0.1% for AGIs $10k-25k, 0.8% for AGIs $25k-50k, 1.2% for AGIs $50k-75k, 1.5% for AGIs $75k-100k, 4.8% for AGIs over 100k)
Profit/loss from business: +$5,850 (reported on 13.3% of returns)
Here:
+$5,850
State:
+$10,813
(% of AGI for various income ranges: -9.6% for AGIs below $10k, 5.5% for AGIs $10k-25k, 2.9% for AGIs $25k-50k, 2.0% for AGIs $50k-75k, 1.3% for AGIs $75k-100k, 1.0% for AGIs over 100k)
IRA payment deduction: $2,792 (reported on 3.2% of returns)
44431:
$2,792
Ohio:
$2,794
(% of AGI for various income ranges: 0.2% for AGIs $10k-25k, 0.3% for AGIs $25k-50k, 0.3% for AGIs $50k-75k, 0.5% for AGIs $75k-100k)
Total itemized deductions: $14,753 (22% of AGI, reported on 23.2% of returns)
Here:
$14,753
State:
$17,503
Here:
22.0% of AGI
State:
20.8% of AGI
(% of AGI for various income ranges: 5.8% for AGIs $10k-25k, 7.2% for AGIs $25k-50k, 10.2% for AGIs $50k-75k, 11.5% for AGIs $75k-100k, 15.6% for AGIs over 100k)
Charity contributions deductions: $2,292 (3% of AGI, reported on 18.6% of returns)
Here:
$2,292
State:
$3,087
Here:
3.3% of AGI
State:
3.4% of AGI
(% of AGI for various income ranges: 0.5% for AGIs $10k-25k, 0.7% for AGIs $25k-50k, 1.2% for AGIs $50k-75k, 1.3% for AGIs $75k-100k, 2.6% for AGIs over 100k)
Total tax: $4,093 (reported on 75.7% of returns)
44431:
$4,093
State:
$6,781
(% of AGI for various income ranges: 2.4% for AGIs below $10k, 4.4% for AGIs $10k-25k, 6.5% for AGIs $25k-50k, 8.3% for AGIs $50k-75k, 10.5% for AGIs $75k-100k, 15.7% for AGIs over 100k)
Earned income credit: $1,605 (reported on 14.4% of returns)
Here:
$1,605
State:
$1,696
Percentage of individuals using paid preparers for their 2004 taxes: 58.2%
Here:
58%
State:
55%
(% for various income ranges: 43.2% for AGIs below $10k, 55.7% for AGIs $10k-25k, 64.3% for AGIs $25k-50k, 62.4% for AGIs $50k-75k, 68.8% for AGIs $75k-100k, 77.0% for AGIs over 100k)
Likely homosexual households (counted as self-reported same-sex unmarried-partner households)
Lesbian couples: 0.2% of all households
Gay men: 0.0% of all households
Household received Food Stamps/SNAP in the past 12 months: 174 Household did not receive Food Stamps/SNAP in the past 12 months: 1,705
Women who had a birth in the past 12 months: 52 (33 now married, 18 unmarried) Women who did not have a birth in the past 12 months: 804 (385 now married, 419 unmarried)
Housing units in zip code 44431 with a mortgage: 849 (148 second mortgage, 144 both second mortgage and home equity loan) Houses without a mortgage: 21
Median monthly owner costs for units with a mortgage: $1,109 Median monthly owner costs for units without a mortgage: $396
Residents with income below the poverty level in 2022:
This zip code:
9.4%
Whole state:
13.4%
Residents with income below 50% of the poverty level in 2022:
This zip code:
5.2%
Whole state:
7.0%
Median number of rooms in houses and condos:
Here:
6.4
State:
6.7
Median number of rooms in apartments:
Here:
6.0
State:
4.4
Notable locations in this zip code not listed on our city pages
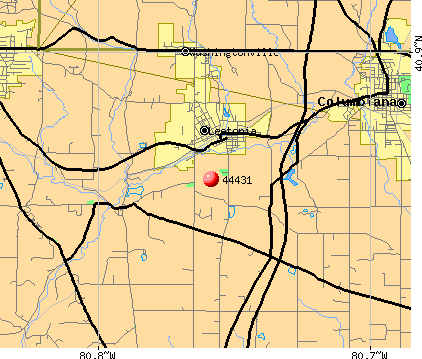
Churches in zip code 44431 include: Saint Jacobs Church (A), First Presbyterian Church of Leetonia (B), First United Methodist Church of Leetonia (C), Saint Patricks Catholic Church (D). Display/hide their locations on the map
Cemeteries: Bethel-Fairfield Cemetery (1), Cool Springs Cemetery (2), Switzer Cemetery (3), Easterly Cemetery (4), English Cemetery (5), Saint Jacobs Cemetery (6), Mount Calvary Cemetery (7). Display/hide their locations on the map
In group quarters: 9 (-1 institutionalized population)
Size of family households: 632 2-persons, 324 3-persons, 165 4-persons, 111 5-persons, 20 6-persons, 32 7-or-more-persons
Size of nonfamily households: 510 1-person, 80 2-persons
763 married couples with children.
245 single-parent households (78 men, 167 women).
96.3% of residents of 44431 zip code speak English at home.
1.1% of residents speak Spanish at home (100% very well).
2.1% of residents speak other Indo-European language at home (84% very well, 13% well, 3% not well).
0.6% of residents speak Asian or Pacific Island language at home (64% not well, 36% not at all).
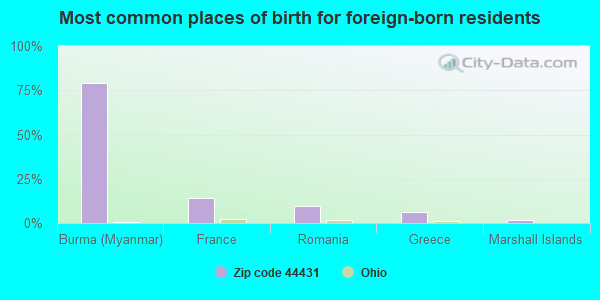
Foreign born population: 63 (1.4%) (64.9% of them are naturalized citizens)
This zip code:
1.4%
Whole state:
5.0%
79%Burma (Myanmar)
14%France
10%Romania
6%Greece
2%Marshall Islands
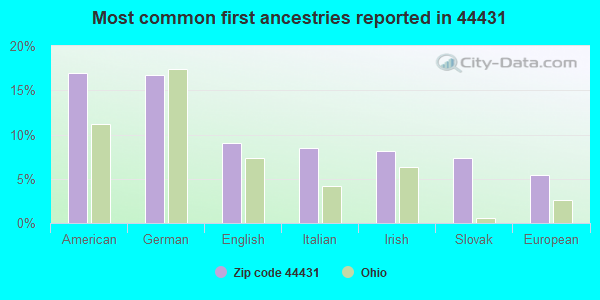
17%American
17%German
9%English
8%Italian
8%Irish
7%Slovak
5%European
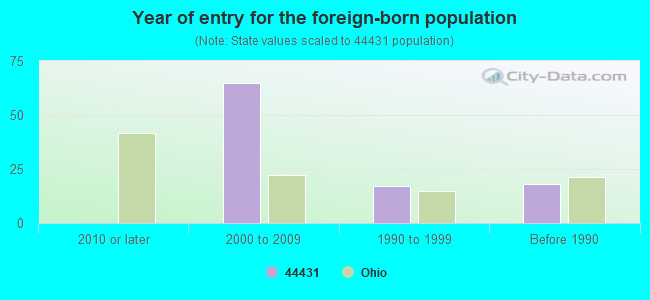
Year of entry for the foreign-born population
02010 or later
652000 to 2009
171990 to 1999
18Before 1990
Facilities with environmental interests located in this zip code:
A AND M AUTO BODY (2914 ST RTE 164 in LEETONIA, OH)
Small Quantity Generators, between 100 kg and 1000 kg of hazardous waste/month (Resource Conservation and Recovery Act (tracking hazardous waste)) - notification Organizations: MCMILLAN ALAN (CONTACT/OWNER)
Housing units lacking complete plumbing facilities: 0.9% Housing units lacking complete kitchen facilities: 3.3%
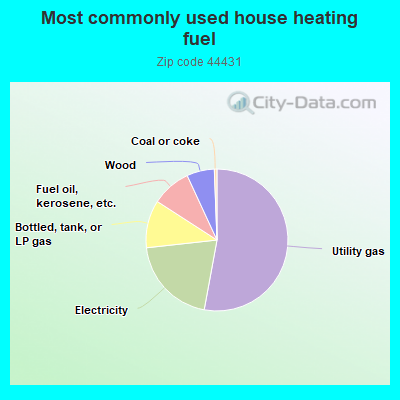
53.0%Utility gas
20.4%Electricity
10.9%Bottled, tank, or LP gas
9.0%Fuel oil, kerosene, etc.
6.3%Wood
0.6%Coal or coke
Population in 1990: 4,281. Population change in the 1990s: +680 (+15.9%).
Place of birth for U.S.-born residents:
This state: 3,822
Northeast: 438
Midwest: 115
South: 179
West: 45
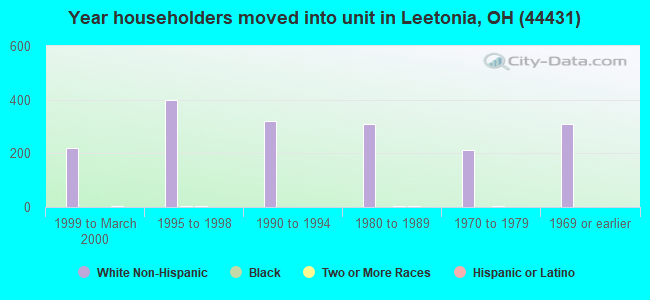
65% of the 44431 zip code residents lived in the same house 5 years ago. Out of people who lived in different houses, 69% lived in this county. Out of people who lived in different counties, 50% lived in Ohio.
92% of the 44431 zip code residents lived in the same house 1 year ago. Out of people who lived in different houses, 80% moved from this county. Out of people who lived in different houses, 14% moved from different county within same state. Out of people who lived in different houses, 3% moved from different state.
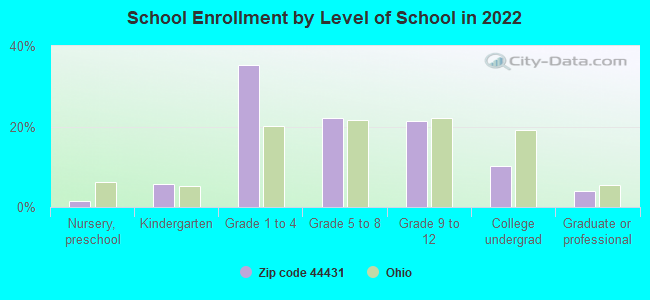
Private vs. public school enrollment:
Students in private schools in grades 1 to 8 (elementary and middle school): 129
Here:
22.2%
Ohio:
16.0%
Students in private schools in grades 9 to 12 (high school): 33
Here:
15.6%
Ohio:
13.1%
Students in private undergraduate colleges: 15
Here:
15.4%
Ohio:
22.3%
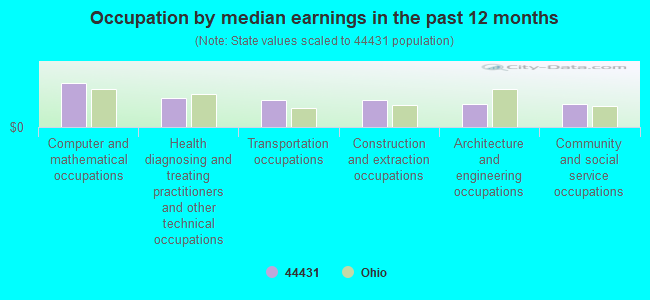
Occupation by median earnings in the past 12 months ($)
107,789Computer and mathematical occupations
69,897Health diagnosing and treating practitioners and other technical occupations
66,231Transportation occupations
64,970Construction and extraction occupations
55,420Architecture and engineering occupations
55,157Community and social service occupations
Top industries in this zip code by the number of employees in 2005:
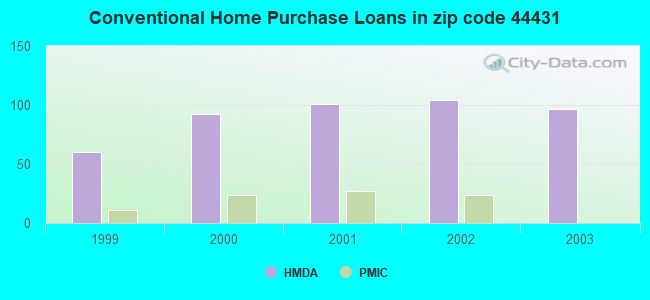
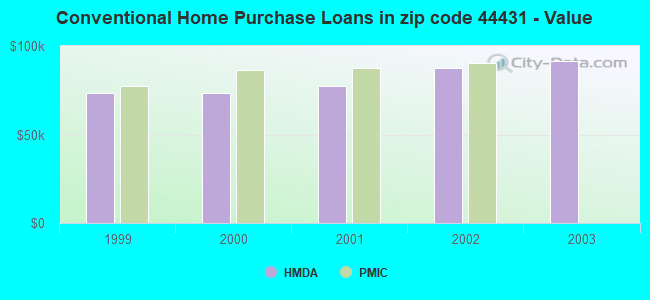
Detailed PMIC statistics for the following Tracts:9503.00
, 9504.00
2002 - 2018 National Fire Incident Reporting System (NFIRS) incidents
Based on the data from the years 2002 - 2018 the average number of fires per year is 23. The highest number of reported fires - 38 took place in 2009, and the least - 9 in 2018. The data has a decreasing trend.
When looking into fire subcategories, the most reports belonged to: Outside Fires (47.3%), and Structure Fires (37.1%).
Fire incident types reported to NFIRS in Zip Code 44431
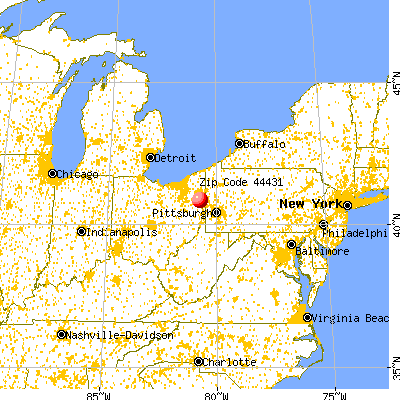


 Nearest zip codes: 44490, 44408, 44432, 44445, 44452, 44460.
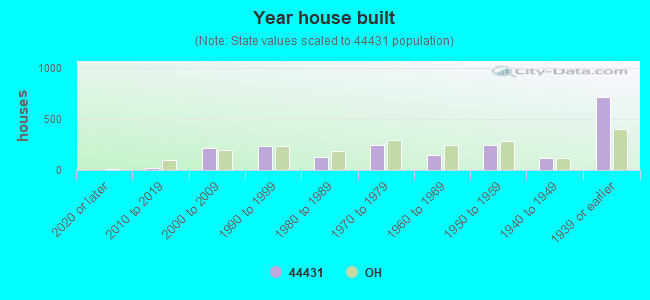


 Based on the data from the years 2002 - 2018 the average number of fires per year is 23. The highest number of reported fires - 38 took place in 2009, and the least - 9 in 2018. The data has a decreasing trend.
 When looking into fire subcategories, the most reports belonged to: Outside Fires (47.3%), and Structure Fires (37.1%).