Estimated median house/condo value in 2022: $185,060
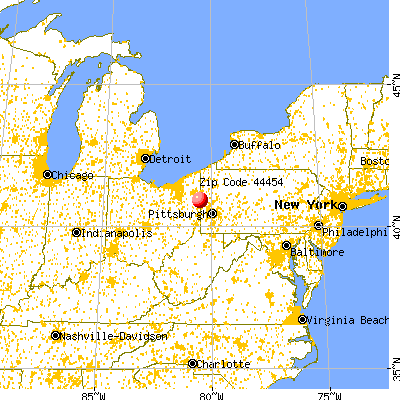
44454:
$185,060
Ohio:
$204,100
According to our research of Ohio and other state lists, there was 1 registered sex offender living in 44454 zip code as of April 26, 2024. The ratio of all residents to sex offenders in zip code 44454 is 954 to 1. The ratio of registered sex offenders to all residents in this zip code is lower than the state average.
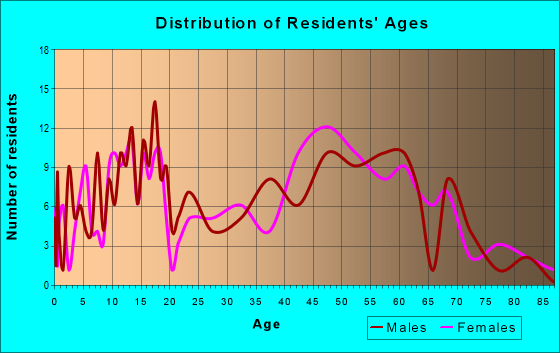
Median resident age:
This zip code:
59.5 years
Ohio median age:
39.9 years
Average household size:
This zip code:
2.0 people
Ohio:
2.4 people
Averages for the 2020 tax year for zip code 44454, filed in 2021:
Average Adjusted Gross Income (AGI) in 2020: $48,420 (Individual Income Tax Returns)
Here:
$48,420
State:
$67,288
Salary/wage: $42,274 (reported on 82.6% of returns)
Here:
$42,274
State:
$55,628
(% of AGI for various income ranges: 1128.2% for AGIs below $25k, 3582.0% for AGIs $25k-50k, 6380.0% for AGIs $50k-75k, 9366.7% for AGIs $75k-100k, 13102.5% for AGIs $100k-200k)
Taxable interest for individuals: $282 (reported on 23.9% of returns)
This zip code:
$282
Ohio:
$1,518
(% of AGI for various income ranges: 4.5% for AGIs below $25k, 7.0% for AGIs $25k-50k, 14.0% for AGIs $50k-75k, 30.0% for AGIs $100k-200k)
Ordinary dividends: $1,600 (reported on 17.4% of returns)
Here:
$1,600
State:
$7,167
(% of AGI for various income ranges: 103.0% for AGIs $25k-50k, 83.3% for AGIs $75k-100k)
Net capital gain/loss in AGI: +$657 (reported on 15.2% of returns)
Here:
+$657
State:
+$18,919
(% of AGI for various income ranges: 22.0% for AGIs $25k-50k, 80.0% for AGIs $75k-100k)
Profit/loss from business: +$8,760 (reported on 10.9% of returns)
Here:
+$8,760
State:
+$13,744
(% of AGI for various income ranges: 190.0% for AGIs below $25k, 458.0% for AGIs $50k-75k)
Taxable individual retirement arrangement distribution: $17,800 (reported on 8.7% of returns)
44454:
$17,800
Ohio:
$18,876
(% of AGI for various income ranges: 159.1% for AGIs below $25k, 1074.0% for AGIs $50k-75k)
Earned income credit: $1,800 (reported on 15.2% of returns)
Here:
$1,800
State:
$2,304
(% of AGI for various income ranges: 114.5% for AGIs below $25k)
Percentage of individuals using paid preparers for their 2020 taxes: 97.8%
Here:
98%
State:
94%
(% for various income ranges: 100.0% for AGIs below $25k, 92.3% for AGIs $25k-50k, 100.0% for AGIs $50k-75k, 100.0% for AGIs $75k-100k, 100.0% for AGIs $100k-200k)
Averages for the 2012 tax year for zip code 44454, filed in 2013:
Average Adjusted Gross Income (AGI) in 2012: $43,994 (Individual Income Tax Returns)
Here:
$43,994
State:
$54,926
Salary/wage: $37,074 (reported on 80.8% of returns)
Here:
$37,074
State:
$45,869
(% of AGI for various income ranges: 70.2% for AGIs below $25k, 66.7% for AGIs $25k-50k, 81.1% for AGIs $50k-75k, 76.3% for AGIs $75k-100k, 53.5% for AGIs $100k-200k)
Taxable interest for individuals: $329 (reported on 26.9% of returns)
This zip code:
$329
Ohio:
$1,297
(% of AGI for various income ranges: 0.2% for AGIs below $25k, 0.3% for AGIs $25k-50k, 0.2% for AGIs $75k-100k, 0.2% for AGIs $100k-200k)
Ordinary dividends: $1,180 (reported on 19.2% of returns)
Here:
$1,180
State:
$5,821
(% of AGI for various income ranges: 0.7% for AGIs below $25k, 1.3% for AGIs $25k-50k, 0.9% for AGIs $75k-100k)
Profit/loss from business: +$7,175 (reported on 15.4% of returns)
Here:
+$7,175
State:
+$12,773
(% of AGI for various income ranges: 7.9% for AGIs below $25k, 7.7% for AGIs $25k-50k, 0.4% for AGIs $75k-100k)
Taxable individual retirement arrangement distribution: $7,275 (reported on 7.7% of returns)
44454:
$7,275
Ohio:
$14,511
(% of AGI for various income ranges: 6.5% for AGIs $25k-50k)
Total itemized deductions: $16,940 (19% of AGI, reported on 19.2% of returns)
Here:
$16,940
State:
$21,278
Here:
18.6% of AGI
State:
18.8% of AGI
(% of AGI for various income ranges: 9.6% for AGIs below $25k, 6.7% for AGIs $50k-75k, 9.9% for AGIs $75k-100k, 10.4% for AGIs $100k-200k)
Charity contributions: $3,350 (reported on 11.5% of returns)
Here:
$3,350
State:
$3,943
(% of AGI for various income ranges: 0.5% for AGIs $25k-50k, 1.6% for AGIs $75k-100k, 1.7% for AGIs $100k-200k)
Taxes paid: $6,460 (reported on 19.2% of returns)
44454:
$6,460
State:
$9,568
(% of AGI for various income ranges: 2.3% for AGIs below $25k, 2.3% for AGIs $50k-75k, 3.9% for AGIs $75k-100k, 4.6% for AGIs $100k-200k)
Earned income credit: $1,900 (reported on 19.2% of returns)
Here:
$1,900
State:
$2,285
(% of AGI for various income ranges: 4.9% for AGIs below $25k, 1.3% for AGIs $25k-50k)
Percentage of individuals using paid preparers for their 2012 taxes: 65.4%
Here:
65%
State:
51%
(% for various income ranges: 54.5% for AGIs below $25k, 61.5% for AGIs $25k-50k, 75.0% for AGIs $50k-75k, 80.0% for AGIs $75k-100k, 100.0% for AGIs $100k-200k)
Averages for the 2004 tax year for zip code 44454, filed in 2005:
Average Adjusted Gross Income (AGI) in 2004: $35,096 (Individual Income Tax Returns)
Here:
$35,096
State:
$44,480
Salary/wage: $29,931 (reported on 86.8% of returns)
Here:
$29,931
State:
$39,198
(% of AGI for various income ranges: 91.0% for AGIs below $10k, 74.4% for AGIs $10k-25k, 82.4% for AGIs $25k-50k, 84.8% for AGIs $50k-75k, 82.6% for AGIs $75k-100k, 46.9% for AGIs over 100k)
Taxable interest for individuals: $904 (reported on 41.5% of returns)
This zip code:
$904
Ohio:
$1,532
(% of AGI for various income ranges: 2.8% for AGIs below $10k, 2.1% for AGIs $10k-25k, 0.7% for AGIs $25k-50k, 0.6% for AGIs $50k-75k, 0.1% for AGIs $75k-100k, 1.5% for AGIs over 100k)
Taxable dividends: $748 (reported on 20.8% of returns)
Here:
$748
State:
$3,496
(% of AGI for various income ranges: 0.2% for AGIs below $10k, 1.0% for AGIs $10k-25k, 0.3% for AGIs $25k-50k, 0.4% for AGIs $50k-75k, 0.5% for AGIs over 100k)
Net capital gain/loss: +$3,394 (reported on 11.9% of returns)
Here:
+$3,394
State:
+$8,582
(% of AGI for various income ranges: 0.1% for AGIs $10k-25k, 0.4% for AGIs $25k-50k, -0.2% for AGIs $50k-75k, 4.7% for AGIs over 100k)
Profit/loss from business: +$8,105 (reported on 15.5% of returns)
Here:
+$8,105
State:
+$10,813
(% of AGI for various income ranges: 8.3% for AGIs below $10k, 11.0% for AGIs $10k-25k, 3.2% for AGIs $25k-50k, 3.9% for AGIs $50k-75k)
IRA payment deduction: $3,143 (reported on 2.5% of returns)
44454:
$3,143
Ohio:
$2,794
Total itemized deductions: $16,198 (21% of AGI, reported on 20.0% of returns)
Here:
$16,198
State:
$17,503
Here:
21.0% of AGI
State:
20.8% of AGI
(% of AGI for various income ranges: 6.2% for AGIs $10k-25k, 6.7% for AGIs $25k-50k, 11.8% for AGIs $50k-75k, 14.0% for AGIs $75k-100k, 10.9% for AGIs over 100k)
Charity contributions deductions: $1,678 (2% of AGI, reported on 16.2% of returns)
Here:
$1,678
State:
$3,087
Here:
2.1% of AGI
State:
3.4% of AGI
(% of AGI for various income ranges: 0.6% for AGIs $10k-25k, 0.9% for AGIs $25k-50k, 0.6% for AGIs $50k-75k, 1.2% for AGIs $75k-100k, 0.8% for AGIs over 100k)
Total tax: $4,749 (reported on 74.0% of returns)
44454:
$4,749
State:
$6,781
(% of AGI for various income ranges: 2.6% for AGIs below $10k, 4.8% for AGIs $10k-25k, 6.4% for AGIs $25k-50k, 8.0% for AGIs $50k-75k, 10.2% for AGIs $75k-100k, 20.5% for AGIs over 100k)
Earned income credit: $1,723 (reported on 17.0% of returns)
Here:
$1,723
State:
$1,696
Percentage of individuals using paid preparers for their 2004 taxes: 57.0%
Here:
57%
State:
55%
(% for various income ranges: 53.1% for AGIs below $10k, 53.4% for AGIs $10k-25k, 60.1% for AGIs $25k-50k, 63.2% for AGIs $50k-75k, 52.4% for AGIs $75k-100k, 70.0% for AGIs over 100k)
Household received Food Stamps/SNAP in the past 12 months: 51 Household did not receive Food Stamps/SNAP in the past 12 months: 262
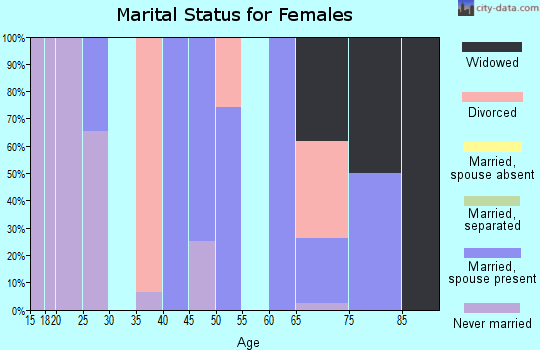
Women who had a birth in the past 12 months: 15 (16 now married, 0 unmarried) Women who did not have a birth in the past 12 months: 54 (14 now married, 39 unmarried)
Housing units in zip code 44454 with a mortgage: 187 (31 second mortgage, 31 both second mortgage and home equity loan) Houses without a mortgage: 1
Median monthly owner costs for units with a mortgage: $1,244 Median monthly owner costs for units without a mortgage: $354
Residents with income below the poverty level in 2022:
This zip code:
23.4%
Whole state:
13.4%
Residents with income below 50% of the poverty level in 2022:
This zip code:
11.9%
Whole state:
7.0%
Median number of rooms in houses and condos:
Here:
7.2
State:
6.7
Notable locations in this zip code not listed on our city pages
Population in 1990: 650. Population change in the 1990s: +627 (+96.5%).
Place of birth for U.S.-born residents:
This state: 561
Northeast: 62
South: 14
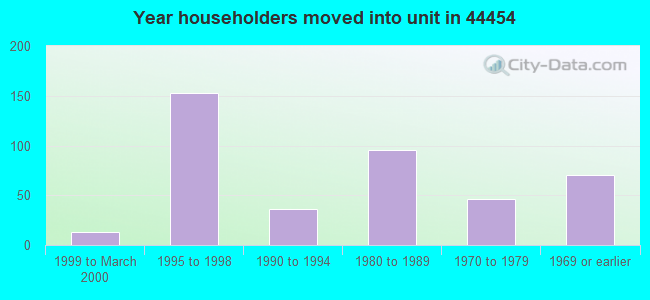
74% of the 44454 zip code residents lived in the same house 5 years ago. Out of people who lived in different houses, 62% lived in this county. Out of people who lived in different counties, 50% lived in Ohio.
99% of the 44454 zip code residents lived in the same house 1 year ago. Out of people who lived in different houses, 150% moved from this county.
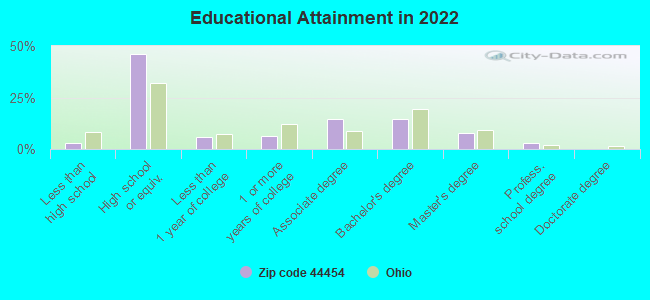
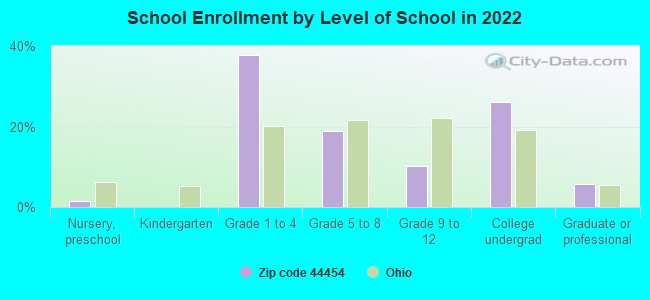
Private vs. public school enrollment:
Students in private schools in grades 1 to 8 (elementary and middle school): 26
Here:
63.7%
Ohio:
16.0%
Students in private schools in grades 9 to 12 (high school): 7
Here:
87.9%
Ohio:
13.1%
Students in private undergraduate colleges:
Here:
0.0%
Ohio:
22.3%
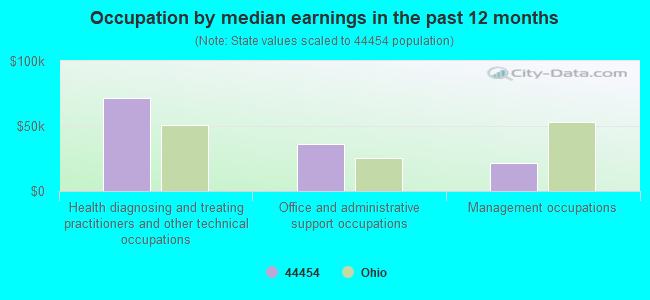
Occupation by median earnings in the past 12 months ($)
71,381Health diagnosing and treating practitioners and other technical occupations
35,900Office and administrative support occupations
21,779Management occupations
Top industries in this zip code by the number of employees in 2005:
Construction: Site Preparation Contractors (20-49 employees: 1 establishment)
Construction: Plumbing, Heating, and Air-Conditioning Contractors (10-19: 1, 5-9: 1)
Other Services (except Public Administration): Religious Organizations (10-19: 1, 1-4: 1)
Mining: Crushed and Broken Limestone Mining and Quarrying (1-4: 2)
Professional, Scientific, and Technical Services: Computer Systems Design Services (1-4: 1)
Finance and Insurance: Real Estate Investment Trusts (1-4: 1)
Professional, Scientific, and Technical Services: Engineering Services (1-4: 1)
People in group quarters in 2000:
13 people in homes for the mentally ill
Home Mortgage Disclosure Act Aggregated Statistics For Year 2009 (Based on 2 partial tracts)
A) FHA, FSA/RHS & VA Home Purchase Loans
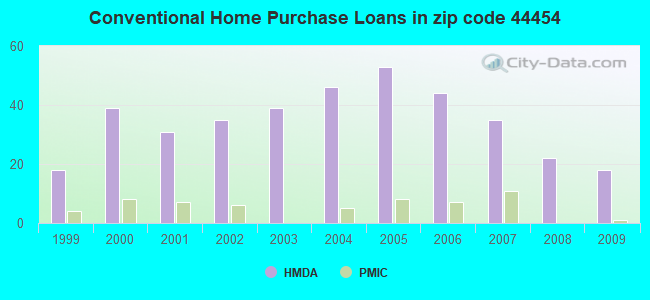
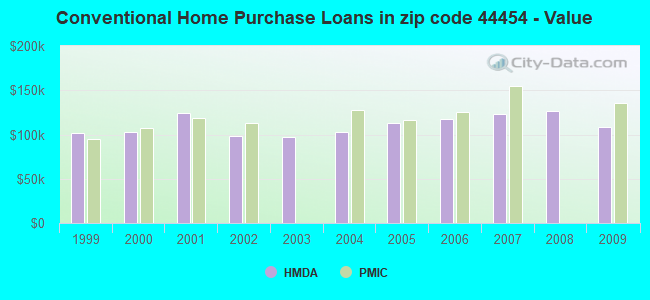
B) Conventional Home Purchase Loans
C) Refinancings
D) Home Improvement Loans
F) Non-occupant Loans on < 5 Family Dwellings (A B C & D)
G) Loans On Manufactured Home Dwelling (A B C & D)
Number
Average Value
Number
Average Value
Number
Average Value
Number
Average Value
Number
Average Value
Number
Average Value
LOANS ORIGINATED
7
$102,464
18
$107,977
51
$131,071
5
$21,036
2
$111,020
1
$60,620
APPLICATIONS APPROVED, NOT ACCEPTED
0
$0
1
$198,670
6
$102,500
0
$0
0
$0
1
$37,980
APPLICATIONS DENIED
1
$95,680
2
$96,595
22
$171,345
2
$16,980
0
$0
1
$37,980
APPLICATIONS WITHDRAWN
1
$101,890
1
$100,430
12
$107,125
0
$0
1
$40,900
1
$26,290
FILES CLOSED FOR INCOMPLETENESS
0
$0
0
$0
3
$137,680
0
$0
0
$0
0
$0
Aggregated Statistics For Year 2008 (Based on 2 partial tracts)
A) FHA, FSA/RHS & VA Home Purchase Loans
B) Conventional Home Purchase Loans
C) Refinancings
D) Home Improvement Loans
F) Non-occupant Loans on < 5 Family Dwellings (A B C & D)
G) Loans On Manufactured Home Dwelling (A B C & D)
Number
Average Value
Number
Average Value
Number
Average Value
Number
Average Value
Number
Average Value
Number
Average Value
LOANS ORIGINATED
5
$99,918
22
$126,392
37
$122,480
9
$36,561
2
$142,610
1
$47,840
APPLICATIONS APPROVED, NOT ACCEPTED
0
$0
0
$0
6
$84,543
2
$18,810
0
$0
0
$0
APPLICATIONS DENIED
3
$112,603
3
$189,053
29
$127,518
5
$36,594
1
$177,120
1
$110,290
APPLICATIONS WITHDRAWN
1
$44,920
0
$0
11
$122,541
0
$0
0
$0
0
$0
FILES CLOSED FOR INCOMPLETENESS
0
$0
0
$0
0
$0
0
$0
0
$0
0
$0
Aggregated Statistics For Year 2007 (Based on 2 partial tracts)
A) FHA, FSA/RHS & VA Home Purchase Loans
B) Conventional Home Purchase Loans
C) Refinancings
D) Home Improvement Loans
F) Non-occupant Loans on < 5 Family Dwellings (A B C & D)
G) Loans On Manufactured Home Dwelling (A B C & D)
Number
Average Value
Number
Average Value
Number
Average Value
Number
Average Value
Number
Average Value
Number
Average Value
LOANS ORIGINATED
1
$153,380
35
$123,271
32
$114,125
9
$41,592
4
$98,970
2
$83,265
APPLICATIONS APPROVED, NOT ACCEPTED
0
$0
1
$76,690
8
$118,325
1
$19,360
0
$0
1
$25,930
APPLICATIONS DENIED
1
$75,960
7
$94,066
31
$124,816
9
$31,976
3
$118,080
2
$88,745
APPLICATIONS WITHDRAWN
0
$0
3
$116,620
16
$129,395
3
$82,900
1
$90,200
0
$0
FILES CLOSED FOR INCOMPLETENESS
0
$0
0
$0
4
$112,755
0
$0
0
$0
0
$0
Aggregated Statistics For Year 2006 (Based on 2 partial tracts)
A) FHA, FSA/RHS & VA Home Purchase Loans
B) Conventional Home Purchase Loans
C) Refinancings
D) Home Improvement Loans
F) Non-occupant Loans on < 5 Family Dwellings (A B C & D)
G) Loans On Manufactured Home Dwelling (A B C & D)
Number
Average Value
Number
Average Value
Number
Average Value
Number
Average Value
Number
Average Value
Number
Average Value
LOANS ORIGINATED
3
$100,673
44
$117,636
54
$95,797
4
$27,572
5
$95,682
4
$53,775
APPLICATIONS APPROVED, NOT ACCEPTED
0
$0
5
$109,780
11
$138,345
2
$32,685
0
$0
0
$0
APPLICATIONS DENIED
0
$0
8
$153,292
55
$134,712
8
$50,718
3
$108,463
3
$32,747
APPLICATIONS WITHDRAWN
0
$0
3
$88,743
19
$133,259
2
$28,305
0
$0
0
$0
FILES CLOSED FOR INCOMPLETENESS
0
$0
0
$0
7
$140,080
1
$98,240
0
$0
0
$0
Aggregated Statistics For Year 2005 (Based on 2 partial tracts)
A) FHA, FSA/RHS & VA Home Purchase Loans
B) Conventional Home Purchase Loans
C) Refinancings
D) Home Improvement Loans
F) Non-occupant Loans on < 5 Family Dwellings (A B C & D)
G) Loans On Manufactured Home Dwelling (A B C & D)
Number
Average Value
Number
Average Value
Number
Average Value
Number
Average Value
Number
Average Value
Number
Average Value
LOANS ORIGINATED
2
$91,115
53
$113,288
52
$92,262
10
$47,841
6
$95,500
4
$77,148
APPLICATIONS APPROVED, NOT ACCEPTED
0
$0
5
$98,970
13
$110,459
1
$35,060
1
$90,200
1
$54,410
APPLICATIONS DENIED
0
$0
7
$215,469
43
$111,760
10
$28,047
2
$73,405
2
$45,650
APPLICATIONS WITHDRAWN
0
$0
6
$123,803
30
$124,411
2
$181,685
1
$26,660
0
$0
FILES CLOSED FOR INCOMPLETENESS
0
$0
0
$0
7
$127,299
0
$0
0
$0
0
$0
Aggregated Statistics For Year 2004 (Based on 2 partial tracts)
A) FHA, FSA/RHS & VA Home Purchase Loans
B) Conventional Home Purchase Loans
C) Refinancings
D) Home Improvement Loans
E) Loans on Dwellings For 5+ Families
F) Non-occupant Loans on < 5 Family Dwellings (A B C & D)
G) Loans On Manufactured Home Dwelling (A B C & D)
Number
Average Value
Number
Average Value
Number
Average Value
Number
Average Value
Number
Average Value
Number
Average Value
Number
Average Value
LOANS ORIGINATED
1
$105,180
46
$102,288
72
$97,995
8
$67,425
1
$3,527,830
8
$123,026
3
$45,773
APPLICATIONS APPROVED, NOT ACCEPTED
0
$0
6
$82,170
12
$96,808
1
$32,500
0
$0
1
$178,220
1
$65,370
APPLICATIONS DENIED
0
$0
9
$99,091
40
$101,507
5
$11,468
0
$0
2
$99,515
4
$48,208
APPLICATIONS WITHDRAWN
0
$0
6
$149,975
30
$116,414
3
$63,543
0
$0
1
$27,390
2
$59,530
FILES CLOSED FOR INCOMPLETENESS
0
$0
1
$46,020
7
$127,820
0
$0
0
$0
0
$0
0
$0
Aggregated Statistics For Year 2003 (Based on 2 partial tracts)
A) FHA, FSA/RHS & VA Home Purchase Loans
B) Conventional Home Purchase Loans
C) Refinancings
D) Home Improvement Loans
F) Non-occupant Loans on < 5 Family Dwellings (A B C & D)
Number
Average Value
Number
Average Value
Number
Average Value
Number
Average Value
Number
Average Value
LOANS ORIGINATED
1
$150,830
39
$97,153
133
$102,802
12
$29,429
6
$99,213
APPLICATIONS APPROVED, NOT ACCEPTED
0
$0
4
$100,705
16
$91,437
1
$43,460
0
$0
APPLICATIONS DENIED
1
$112,480
5
$117,376
37
$101,259
2
$20,450
1
$81,070
APPLICATIONS WITHDRAWN
0
$0
5
$122,708
24
$103,443
0
$0
4
$63,818
FILES CLOSED FOR INCOMPLETENESS
0
$0
1
$96,410
4
$85,730
0
$0
0
$0
Aggregated Statistics For Year 2002 (Based on 2 partial tracts)
A) FHA, FSA/RHS & VA Home Purchase Loans
B) Conventional Home Purchase Loans
C) Refinancings
D) Home Improvement Loans
F) Non-occupant Loans on < 5 Family Dwellings (A B C & D)
Number
Average Value
Number
Average Value
Number
Average Value
Number
Average Value
Number
Average Value
LOANS ORIGINATED
3
$99,213
35
$98,802
76
$103,068
9
$13,797
5
$103,862
APPLICATIONS APPROVED, NOT ACCEPTED
0
$0
4
$58,432
20
$97,326
1
$29,580
0
$0
APPLICATIONS DENIED
0
$0
9
$44,879
37
$94,054
5
$17,164
2
$62,995
APPLICATIONS WITHDRAWN
0
$0
5
$89,986
17
$94,415
2
$31,955
0
$0
FILES CLOSED FOR INCOMPLETENESS
0
$0
1
$71,210
8
$101,024
0
$0
0
$0
Aggregated Statistics For Year 2001 (Based on 2 partial tracts)
A) FHA, FSA/RHS & VA Home Purchase Loans
B) Conventional Home Purchase Loans
C) Refinancings
D) Home Improvement Loans
F) Non-occupant Loans on < 5 Family Dwellings (A B C & D)
Number
Average Value
Number
Average Value
Number
Average Value
Number
Average Value
Number
Average Value
LOANS ORIGINATED
2
$103,535
31
$124,392
87
$89,978
7
$22,486
4
$58,888
APPLICATIONS APPROVED, NOT ACCEPTED
0
$0
6
$75,048
18
$86,978
1
$9,130
0
$0
APPLICATIONS DENIED
0
$0
13
$75,962
34
$95,253
4
$21,730
0
$0
APPLICATIONS WITHDRAWN
0
$0
3
$61,840
16
$86,119
3
$14,000
1
$71,210
FILES CLOSED FOR INCOMPLETENESS
0
$0
0
$0
5
$78,664
0
$0
0
$0
Aggregated Statistics For Year 2000 (Based on 2 partial tracts)
A) FHA, FSA/RHS & VA Home Purchase Loans
B) Conventional Home Purchase Loans
C) Refinancings
D) Home Improvement Loans
F) Non-occupant Loans on < 5 Family Dwellings (A B C & D)
Number
Average Value
Number
Average Value
Number
Average Value
Number
Average Value
Number
Average Value
LOANS ORIGINATED
4
$89,658
39
$102,790
38
$67,783
15
$8,813
4
$103,535
APPLICATIONS APPROVED, NOT ACCEPTED
0
$0
7
$52,119
9
$69,186
3
$7,303
0
$0
APPLICATIONS DENIED
1
$71,940
9
$47,720
18
$64,133
7
$13,513
1
$71,210
APPLICATIONS WITHDRAWN
0
$0
3
$79,250
12
$79,644
2
$17,345
0
$0
FILES CLOSED FOR INCOMPLETENESS
0
$0
0
$0
2
$52,405
0
$0
0
$0
Aggregated Statistics For Year 1999 (Based on 1 partial tract)
A) FHA, FSA/RHS & VA Home Purchase Loans
B) Conventional Home Purchase Loans
C) Refinancings
D) Home Improvement Loans
F) Non-occupant Loans on < 5 Family Dwellings (A B C & D)


 Nearest zip codes: 44442, 44443, 16112, 44413, 16120, 44445.