Estimated zip code population in 2022: 1,835 Zip code population in 2010: 1,890 Zip code population in 2000: 1,689
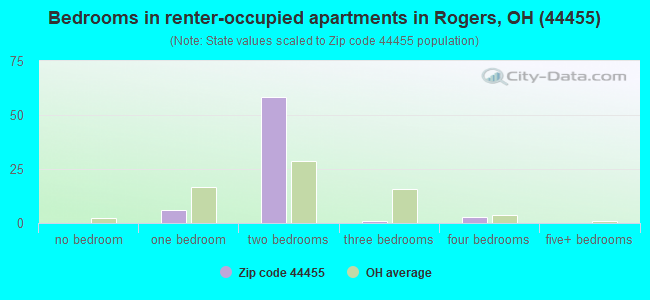
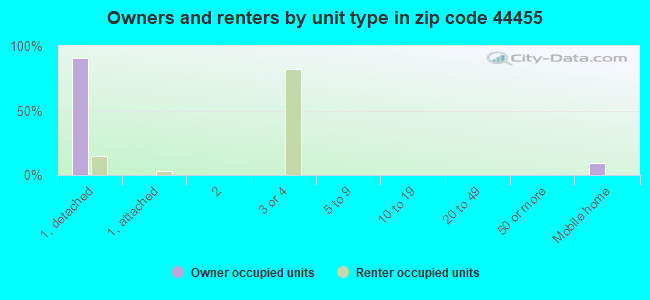
Houses and condos: 648 Renter-occupied apartments: 68
% of renters here:
11%
State:
33%
March 2022 cost of living index in zip code 44455: 81.5 (low, U.S. average is 100)
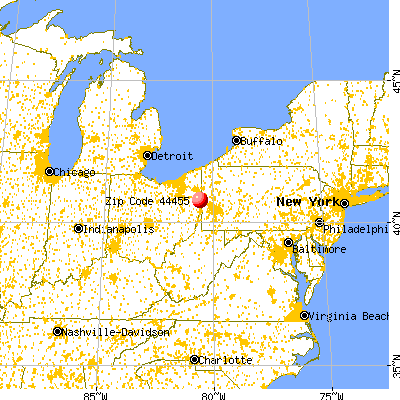
Land area: 20.7 sq. mi. Water area: 0.0 sq. mi.
Population density: 89 people per square mile
(very low).
OSM Map
General Map
Google Map
MSN Map
OSM Map
General Map
Google Map
MSN Map
OSM Map
General Map
Google Map
MSN Map
OSM Map
General Map
Google Map
MSN Map
Please wait while loading the map...
Real estate property taxes paid for housing units in 2022:
This zip code:
1.1% ($1,606)
Ohio:
1.3% ($2,639)
Median real estate property taxes paid for housing units with mortgages in 2022: $1,817 (1.1%) Median real estate property taxes paid for housing units with no mortgage in 2022: $1,446 (1.1%)
Business Search- 14 Million verified businesses
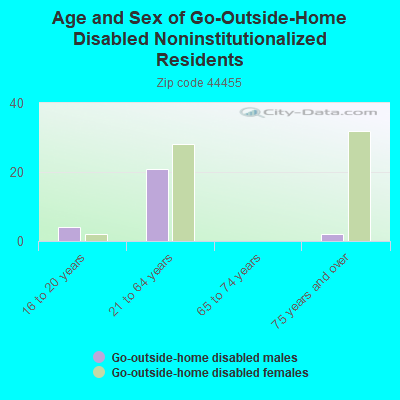
Males: 786
(42.9%)
Females: 1,048
(57.1%)
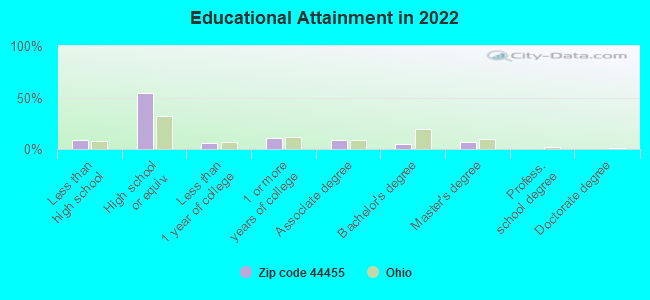
For population 25 years and over in 44455:
High school or higher: 89.9%
Bachelor's degree or higher: 11.4%
Graduate or professional degree: 6.4%
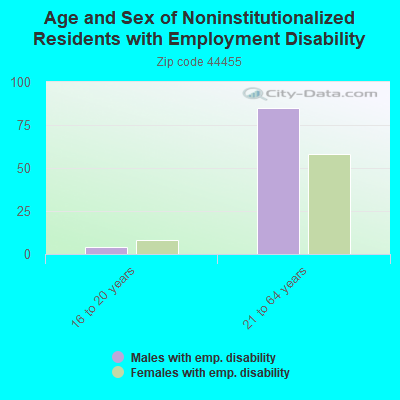
Unemployed: 1.3%
Mean travel time to work (commute): 38.6 minutes
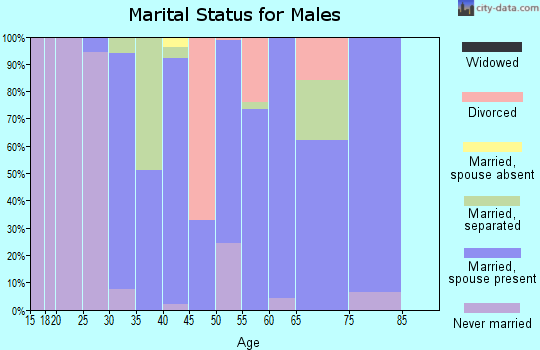
For population 15 years and over in 44455:
Never married: 30.9%
Now married: 56.4%
Separated: 0.4%
Widowed: 3.4%
Divorced: 9.0%
Zip code 44455 compared to state average:
Unemployed percentage below state average.
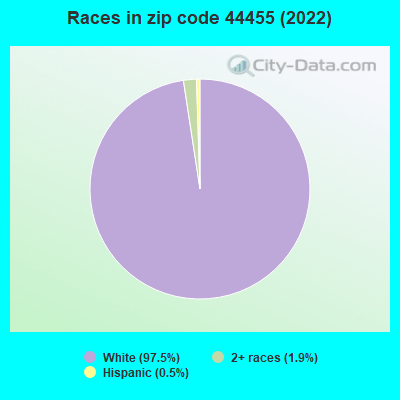
Black race population percentage significantly below state average.
Hispanic race population percentage significantly below state average.
Foreign-born population percentage significantly below state average.
Renting percentage significantly below state average.
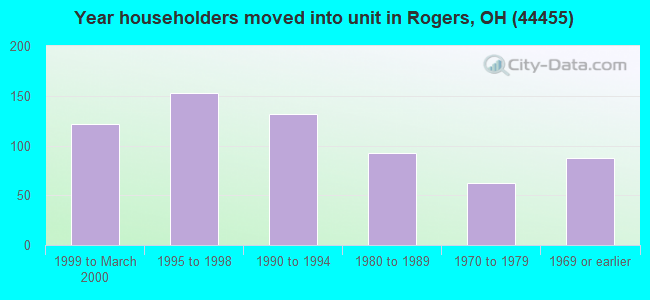
Length of stay since moving in significantly above state average.
Number of college students significantly below state average.
Percentage of population with a bachelor's degree or higher significantly below state average.
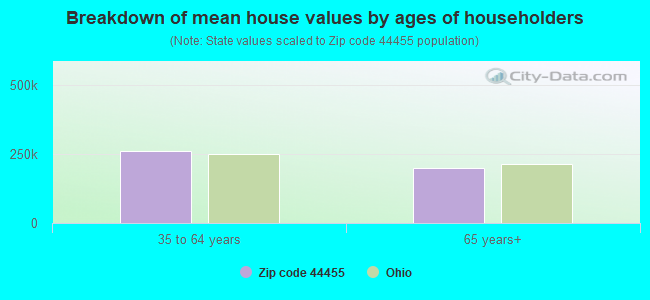
Estimated median house/condo value in 2022: $147,981
44455:
$147,981
Ohio:
$204,100
According to our research of Ohio and other state lists, there was 1 registered sex offender living in 44455 zip code as of April 27, 2024. The ratio of all residents to sex offenders in zip code 44455 is 1,606 to 1. The ratio of registered sex offenders to all residents in this zip code is much lower than the state average.
Median resident age:
This zip code:
43.3 years
Ohio median age:
39.9 years
Average household size:
This zip code:
2.8 people
Ohio:
2.4 people
Averages for the 2020 tax year for zip code 44455, filed in 2021:
Average Adjusted Gross Income (AGI) in 2020: $47,661 (Individual Income Tax Returns)
Here:
$47,661
State:
$67,288
Salary/wage: $42,510 (reported on 85.1% of returns)
Here:
$42,510
State:
$55,628
(% of AGI for various income ranges: 1102.1% for AGIs below $25k, 3363.7% for AGIs $25k-50k, 6806.7% for AGIs $50k-75k, 8972.0% for AGIs $75k-100k, 19210.0% for AGIs $100k-200k)
Taxable interest for individuals: $542 (reported on 16.2% of returns)
This zip code:
$542
Ohio:
$1,518
(% of AGI for various income ranges: 8.4% for AGIs below $25k, 16.3% for AGIs $25k-50k, 13.3% for AGIs $50k-75k, 15.0% for AGIs $100k-200k)
Ordinary dividends: $914 (reported on 9.5% of returns)
Here:
$914
State:
$7,167
(% of AGI for various income ranges: 20.0% for AGIs $25k-50k, 52.0% for AGIs $75k-100k)
Net capital gain/loss in AGI: +$2,225 (reported on 5.4% of returns)
Here:
+$2,225
State:
+$18,919
(% of AGI for various income ranges: 98.9% for AGIs $50k-75k)
Profit/loss from business: +$8,282 (reported on 14.9% of returns)
Here:
+$8,282
State:
+$13,744
(% of AGI for various income ranges: 207.4% for AGIs below $25k, 165.8% for AGIs $25k-50k, 224.4% for AGIs $50k-75k)
Taxable individual retirement arrangement distribution: $14,560 (reported on 6.8% of returns)
44455:
$14,560
Ohio:
$18,876
(% of AGI for various income ranges: 147.4% for AGIs $25k-50k, 896.0% for AGIs $75k-100k)
Earned income credit: $2,144 (reported on 21.6% of returns)
Here:
$2,144
State:
$2,304
(% of AGI for various income ranges: 101.6% for AGIs below $25k, 78.9% for AGIs $25k-50k)
Percentage of individuals using paid preparers for their 2020 taxes: 95.9%
Here:
96%
State:
94%
(% for various income ranges: 92.3% for AGIs below $25k, 95.7% for AGIs $25k-50k, 100.0% for AGIs $50k-75k, 100.0% for AGIs $75k-100k, 100.0% for AGIs $100k-200k)
Averages for the 2012 tax year for zip code 44455, filed in 2013:
Average Adjusted Gross Income (AGI) in 2012: $50,647 (Individual Income Tax Returns)
Here:
$50,647
State:
$54,926
Salary/wage: $35,607 (reported on 88.9% of returns)
Here:
$35,607
State:
$45,869
(% of AGI for various income ranges: 82.2% for AGIs below $25k, 78.6% for AGIs $25k-50k, 82.2% for AGIs $50k-75k, 75.4% for AGIs $75k-100k, 80.8% for AGIs $100k-200k)
Taxable interest for individuals: $229 (reported on 21.0% of returns)
This zip code:
$229
Ohio:
$1,297
(% of AGI for various income ranges: 0.2% for AGIs below $25k, 0.1% for AGIs $50k-75k, 0.3% for AGIs $100k-200k)
Ordinary dividends: $844 (reported on 11.1% of returns)
Here:
$844
State:
$5,821
(% of AGI for various income ranges: 0.8% for AGIs below $25k, 0.6% for AGIs $100k-200k)
Profit/loss from business: +$6,770 (reported on 12.3% of returns)
Here:
+$6,770
State:
+$12,773
(% of AGI for various income ranges: 6.4% for AGIs below $25k, 3.2% for AGIs $25k-50k, 2.0% for AGIs $50k-75k)
Taxable individual retirement arrangement distribution: $4,875 (reported on 4.9% of returns)
44455:
$4,875
Ohio:
$14,511
(% of AGI for various income ranges: 2.4% for AGIs $25k-50k)
Total itemized deductions: $17,792 (16% of AGI, reported on 16.0% of returns)
Here:
$17,792
State:
$21,278
Here:
15.7% of AGI
State:
18.8% of AGI
(% of AGI for various income ranges: 5.3% for AGIs $25k-50k, 5.4% for AGIs $50k-75k, 8.0% for AGIs $75k-100k, 15.3% for AGIs $100k-200k)
Charity contributions: $4,529 (reported on 8.6% of returns)
Here:
$4,529
State:
$3,943
(% of AGI for various income ranges: 1.3% for AGIs $50k-75k, 3.2% for AGIs $100k-200k)
Taxes paid: $6,215 (reported on 16.0% of returns)
44455:
$6,215
State:
$9,568
(% of AGI for various income ranges: 1.3% for AGIs $25k-50k, 1.6% for AGIs $50k-75k, 2.0% for AGIs $75k-100k, 6.9% for AGIs $100k-200k)
Earned income credit: $2,275 (reported on 19.8% of returns)
Here:
$2,275
State:
$2,285
(% of AGI for various income ranges: 7.4% for AGIs below $25k, 0.9% for AGIs $25k-50k)
Percentage of individuals using paid preparers for their 2012 taxes: 56.8%
Here:
57%
State:
51%
(% for various income ranges: 45.5% for AGIs below $25k, 59.1% for AGIs $25k-50k, 61.5% for AGIs $50k-75k, 66.7% for AGIs $75k-100k, 120.0% for AGIs $100k-200k, 0.0% for AGIs over 200k)
Averages for the 2004 tax year for zip code 44455, filed in 2005:
Average Adjusted Gross Income (AGI) in 2004: $32,510 (Individual Income Tax Returns)
Here:
$32,510
State:
$44,480
Salary/wage: $30,410 (reported on 88.2% of returns)
Here:
$30,410
State:
$39,198
(% of AGI for various income ranges: 100.3% for AGIs below $10k, 80.3% for AGIs $10k-25k, 85.1% for AGIs $25k-50k, 89.6% for AGIs $50k-75k, 84.3% for AGIs $75k-100k, 60.9% for AGIs over 100k)
Taxable interest for individuals: $498 (reported on 31.4% of returns)
This zip code:
$498
Ohio:
$1,532
(% of AGI for various income ranges: 2.9% for AGIs below $10k, 1.1% for AGIs $10k-25k, 0.3% for AGIs $25k-50k, 0.2% for AGIs $50k-75k, 0.2% for AGIs $75k-100k, 0.5% for AGIs over 100k)
Taxable dividends: $621 (reported on 12.6% of returns)
Here:
$621
State:
$3,496
(% of AGI for various income ranges: 0.1% for AGIs below $10k, 0.1% for AGIs $10k-25k, 0.4% for AGIs $25k-50k, 0.0% for AGIs $50k-75k, 0.8% for AGIs $75k-100k)
Net capital gain/loss: +$179 (reported on 7.4% of returns)
Here:
+$179
State:
+$8,582
Profit/loss from business: +$5,718 (reported on 14.6% of returns)
Here:
+$5,718
State:
+$10,813
(% of AGI for various income ranges: 1.0% for AGIs below $10k, 6.4% for AGIs $10k-25k, 3.4% for AGIs $25k-50k, 1.9% for AGIs $50k-75k)
IRA payment deduction: $2,500 (reported on 1.3% of returns)
44455:
$2,500
Ohio:
$2,794
Total itemized deductions: $13,529 (21% of AGI, reported on 20.3% of returns)
Here:
$13,529
State:
$17,503
Here:
21.4% of AGI
State:
20.8% of AGI
(% of AGI for various income ranges: 4.2% for AGIs $10k-25k, 7.0% for AGIs $25k-50k, 10.5% for AGIs $50k-75k, 11.0% for AGIs $75k-100k, 12.8% for AGIs over 100k)
Charity contributions deductions: $2,626 (4% of AGI, reported on 14.2% of returns)
Here:
$2,626
State:
$3,087
Here:
3.7% of AGI
State:
3.4% of AGI
(% of AGI for various income ranges: 3.5% for AGIs below $10k, 0.8% for AGIs $25k-50k, 1.2% for AGIs $50k-75k, 1.5% for AGIs $75k-100k, 2.5% for AGIs over 100k)
Total tax: $3,903 (reported on 70.9% of returns)
44455:
$3,903
State:
$6,781
(% of AGI for various income ranges: 2.9% for AGIs below $10k, 3.9% for AGIs $10k-25k, 6.6% for AGIs $25k-50k, 8.4% for AGIs $50k-75k, 10.7% for AGIs $75k-100k, 18.0% for AGIs over 100k)
Earned income credit: $1,713 (reported on 20.8% of returns)
Here:
$1,713
State:
$1,696
Percentage of individuals using paid preparers for their 2004 taxes: 54.7%
Here:
55%
State:
55%
(% for various income ranges: 46.3% for AGIs below $10k, 55.7% for AGIs $10k-25k, 56.2% for AGIs $25k-50k, 56.5% for AGIs $50k-75k, 61.1% for AGIs $75k-100k, 75.0% for AGIs over 100k)
Likely homosexual households (counted as self-reported same-sex unmarried-partner households)
Lesbian couples: 0.0% of all households
Gay men: 0.2% of all households
Household received Food Stamps/SNAP in the past 12 months: 27 Household did not receive Food Stamps/SNAP in the past 12 months: 608
Women who had a birth in the past 12 months: 4 (5 now married, 0 unmarried) Women who did not have a birth in the past 12 months: 414 (273 now married, 141 unmarried)
Housing units in zip code 44455 with a mortgage: 206 (31 second mortgage, 31 both second mortgage and home equity loan) Houses without a mortgage: 33
Median monthly owner costs for units with a mortgage: $1,224 Median monthly owner costs for units without a mortgage: $480
Residents with income below the poverty level in 2022:
This zip code:
5.4%
Whole state:
13.4%
Residents with income below 50% of the poverty level in 2022:
This zip code:
1.9%
Whole state:
7.0%
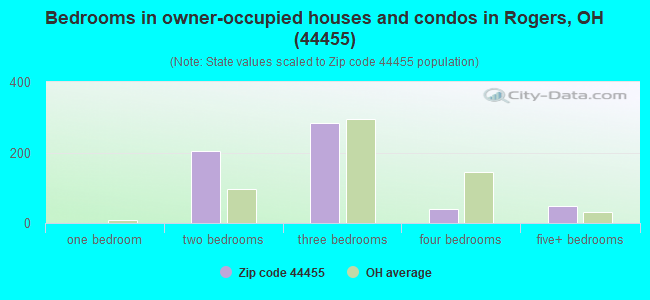
Median number of rooms in houses and condos:
Here:
6.1
State:
6.7
Median number of rooms in apartments:
Here:
4.0
State:
4.4
Notable locations in this zip code not listed on our city pages
In group quarters: 17 (-1 institutionalized population)
Size of family households: 350 2-persons, 20 3-persons, 136 4-persons, 56 5-persons, 10 7-or-more-persons
Size of nonfamily households: 57 1-person, 1 2-persons
291 married couples with children.
2 single-parent households (2 women).
99.6% of residents of 44455 zip code speak English at home.
0.2% of residents speak Spanish at home (100% very well).
Foreign born population: 0 (0.0%)
:
0.0%
Whole state:
5.0%
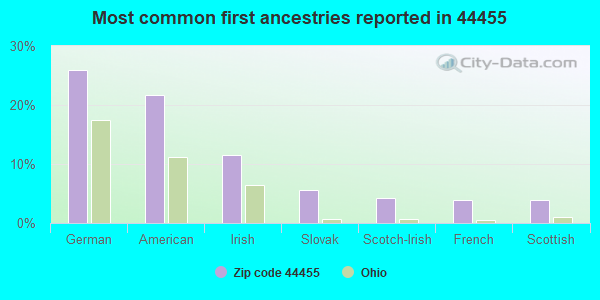
26%German
22%American
12%Irish
6%Slovak
4%Scotch-Irish
4%French
4%Scottish
Housing units lacking complete kitchen facilities: 0.1%
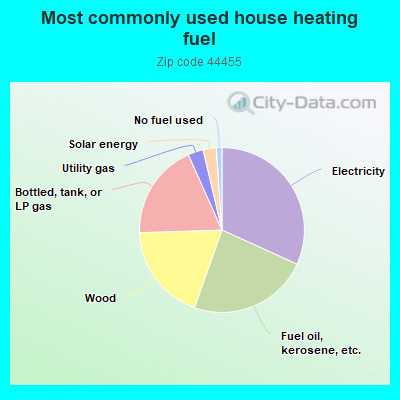
31.9%Electricity
23.7%Fuel oil, kerosene, etc.
19.1%Wood
18.9%Bottled, tank, or LP gas
3.0%Utility gas
2.6%Solar energy
1.1%No fuel used
Population in 1990: 1,418. Population change in the 1990s: +271 (+19.1%).
Place of birth for U.S.-born residents:
This state: 1,438
Northeast: 235
Midwest: 29
South: 126
West: 4
71% of the 44455 zip code residents lived in the same house 5 years ago. Out of people who lived in different houses, 79% lived in this county. Out of people who lived in different counties, 50% lived in Ohio.
96% of the 44455 zip code residents lived in the same house 1 year ago. Out of people who lived in different houses, 83% moved from this county. Out of people who lived in different houses, 6% moved from different county within same state. Out of people who lived in different houses, 15% moved from different state.
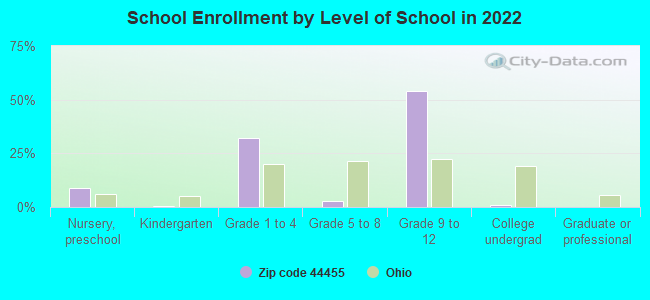
Private vs. public school enrollment:
Students in private schools in grades 1 to 8 (elementary and middle school):
Here:
0.0%
Ohio:
16.0%
Students in private schools in grades 9 to 12 (high school): 6
Here:
3.6%
Ohio:
13.1%
Students in private undergraduate colleges:
Here:
0.0%
Ohio:
22.3%
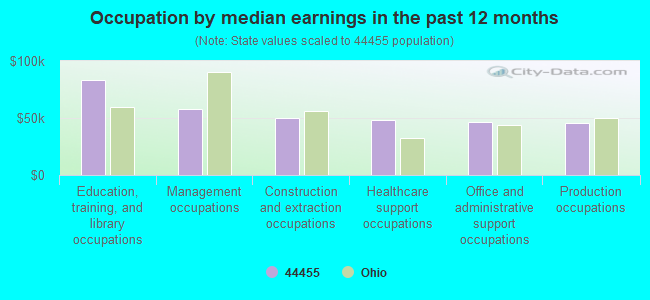
Occupation by median earnings in the past 12 months ($)
83,635Education, training, and library occupations
57,548Management occupations
50,026Construction and extraction occupations
48,670Healthcare support occupations
46,539Office and administrative support occupations
45,574Production occupations
Top industries in this zip code by the number of employees in 2005:
Real Estate and Rental and Leasing: Lessors of Nonresidential Buildings (except Miniwarehouses) (10-19 employees: 1 establishment)
Administrative and Support and Waste Management and Remediation Services: Solid Waste Collection (5-9: 1)
Accommodation and Food Services: Drinking Places (Alcoholic Beverages) (5-9: 1)
Health Care and Social Assistance: Other Residential Care Facilities (5-9: 1)
Administrative and Support and Waste Management and Remediation Services: Document Preparation Services (5-9: 1)
Other Services (except Public Administration): Religious Organizations (1-4: 2)
Construction: Site Preparation Contractors (1-4: 1)
People in group quarters in 2010:
19 people in residential treatment centers for juveniles (non-correctional)
5 people in workers' group living quarters and job corps centers
Fatal accident statistics in 2014:
Fatal accident count: 1
Vehicles involved in fatal accidents: 1
Fatal accidents caused by drunken drivers: 1
Fatalities: 1
Persons involved in fatal accidents: 1
Pedestrians involved in fatal accidents: 0
Fatal accident statistics in 2013:
Fatal accident count: 1
Vehicles involved in fatal accidents: 1
Fatal accidents caused by drunken drivers: 1
Fatalities: 1
Persons involved in fatal accidents: 1
Pedestrians involved in fatal accidents: 0
Home Mortgage Disclosure Act Aggregated Statistics For Year 2003 (Based on 4 partial tracts)
A) FHA, FSA/RHS & VA Home Purchase Loans
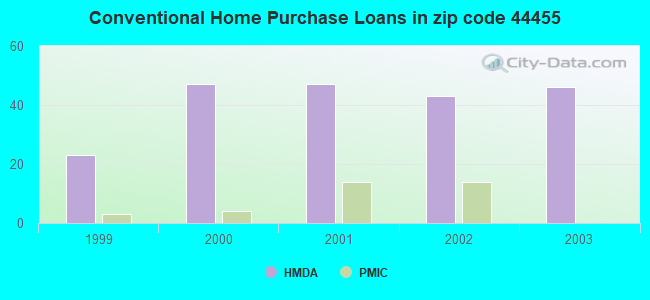
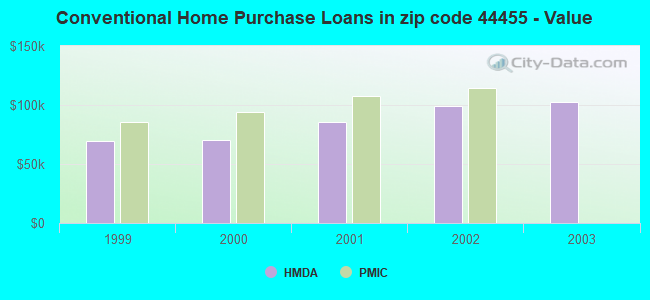
B) Conventional Home Purchase Loans
C) Refinancings
D) Home Improvement Loans
F) Non-occupant Loans on < 5 Family Dwellings (A B C & D)
Number
Average Value
Number
Average Value
Number
Average Value
Number
Average Value
Number
Average Value
LOANS ORIGINATED
5
$81,644
46
$102,862
188
$89,086
21
$30,994
7
$114,720
APPLICATIONS APPROVED, NOT ACCEPTED
0
$0
4
$81,238
32
$106,195
3
$50,937
1
$86,810
APPLICATIONS DENIED
1
$59,610
12
$77,850
87
$102,437
8
$11,234
1
$24,530
APPLICATIONS WITHDRAWN
0
$0
7
$102,841
37
$118,464
3
$26,463
1
$82,960
FILES CLOSED FOR INCOMPLETENESS
1
$45,900
2
$216,850
8
$131,504
0
$0
0
$0
Aggregated Statistics For Year 2002 (Based on 4 partial tracts)
A) FHA, FSA/RHS & VA Home Purchase Loans
B) Conventional Home Purchase Loans
C) Refinancings
D) Home Improvement Loans
F) Non-occupant Loans on < 5 Family Dwellings (A B C & D)
Number
Average Value
Number
Average Value
Number
Average Value
Number
Average Value
Number
Average Value
LOANS ORIGINATED
3
$85,807
43
$99,291
147
$89,457
13
$21,577
7
$98,736
APPLICATIONS APPROVED, NOT ACCEPTED
1
$79,440
8
$68,791
31
$81,063
3
$32,777
0
$0
APPLICATIONS DENIED
1
$82,110
17
$58,947
76
$96,404
6
$27,257
2
$47,690
APPLICATIONS WITHDRAWN
0
$0
5
$86,982
29
$97,597
2
$17,055
0
$0
FILES CLOSED FOR INCOMPLETENESS
0
$0
2
$86,185
11
$97,255
0
$0
0
$0
Aggregated Statistics For Year 2001 (Based on 4 partial tracts)
A) FHA, FSA/RHS & VA Home Purchase Loans
B) Conventional Home Purchase Loans
C) Refinancings
D) Home Improvement Loans
E) Loans on Dwellings For 5+ Families
F) Non-occupant Loans on < 5 Family Dwellings (A B C & D)
Number
Average Value
Number
Average Value
Number
Average Value
Number
Average Value
Number
Average Value
Number
Average Value
LOANS ORIGINATED
6
$64,570
47
$85,753
130
$85,453
15
$15,069
1
$347,290
7
$54,953
APPLICATIONS APPROVED, NOT ACCEPTED
0
$0
7
$48,721
24
$77,421
4
$17,860
0
$0
1
$44,210
APPLICATIONS DENIED
1
$36,800
30
$49,152
84
$80,440
12
$27,310
0
$0
6
$44,722
APPLICATIONS WITHDRAWN
0
$0
7
$86,124
33
$82,594
3
$29,343
0
$0
0
$0
FILES CLOSED FOR INCOMPLETENESS
0
$0
2
$67,735
9
$87,867
1
$12,790
0
$0
0
$0
Aggregated Statistics For Year 2000 (Based on 4 partial tracts)
A) FHA, FSA/RHS & VA Home Purchase Loans
B) Conventional Home Purchase Loans
C) Refinancings
D) Home Improvement Loans
F) Non-occupant Loans on < 5 Family Dwellings (A B C & D)
Number
Average Value
Number
Average Value
Number
Average Value
Number
Average Value
Number
Average Value
LOANS ORIGINATED
5
$71,980
47
$70,470
72
$65,301
25
$21,100
6
$73,103
APPLICATIONS APPROVED, NOT ACCEPTED
1
$58,750
10
$70,885
22
$62,680
4
$10,972
0
$0
APPLICATIONS DENIED
1
$51,080
27
$49,386
54
$79,738
13
$14,568
2
$31,125
APPLICATIONS WITHDRAWN
0
$0
5
$80,712
29
$66,043
4
$23,088
2
$45,665
FILES CLOSED FOR INCOMPLETENESS
0
$0
1
$109,320
7
$76,107
0
$0
0
$0
Aggregated Statistics For Year 1999 (Based on 2 partial tracts)
A) FHA, FSA/RHS & VA Home Purchase Loans
B) Conventional Home Purchase Loans
C) Refinancings
D) Home Improvement Loans
F) Non-occupant Loans on < 5 Family Dwellings (A B C & D)
Detailed PMIC statistics for the following Tracts:9514.00
, 9516.00
2002 - 2018 National Fire Incident Reporting System (NFIRS) incidents
Based on the data from the years 2002 - 2018 the average number of fire incidents per year is 18. The highest number of fires - 37 took place in 2017, and the least - 6 in 2011. The data has a decreasing trend.
When looking into fire subcategories, the most incidents belonged to: Structure Fires (53.4%), and Outside Fires (26.8%).
Fire incident types reported to NFIRS in Zip Code 44455


 Nearest zip codes: 44441, 44445, 44413, 43920, 44408, 16115.


 Based on the data from the years 2002 - 2018 the average number of fire incidents per year is 18. The highest number of fires - 37 took place in 2017, and the least - 6 in 2011. The data has a decreasing trend.
 When looking into fire subcategories, the most incidents belonged to: Structure Fires (53.4%), and Outside Fires (26.8%).