Estimated zip code population in 2022: 7,628 Zip code population in 2010: 6,858 Zip code population in 2000: 6,634
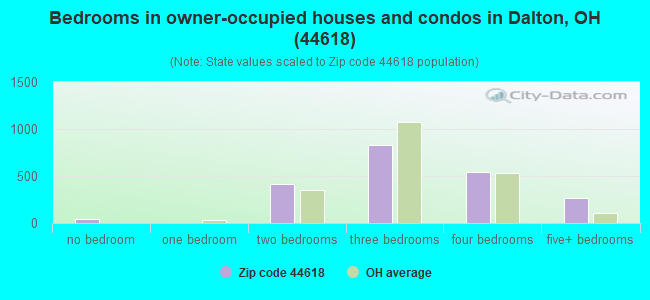
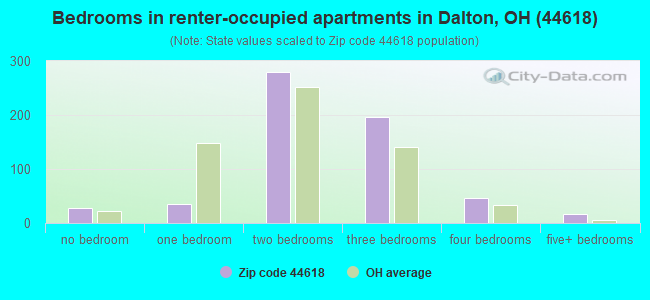
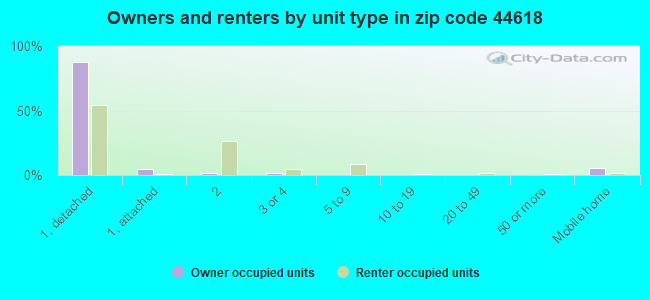
Houses and condos: 2,816 Renter-occupied apartments: 609
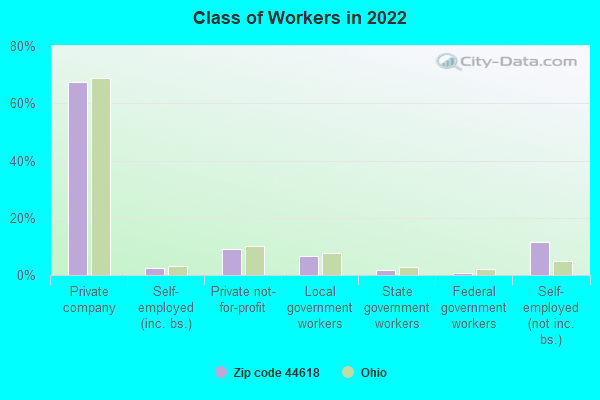
% of renters here:
23%
State:
33%
March 2022 cost of living index in zip code 44618: 83.7 (less than average, U.S. average is 100)
Land area: 42.2 sq. mi. Water area: 0.1 sq. mi.
Population density: 181 people per square mile
(very low).
OSM Map
General Map
Google Map
MSN Map
OSM Map
General Map
Google Map
MSN Map
OSM Map
General Map
Google Map
MSN Map
OSM Map
General Map
Google Map
MSN Map
Please wait while loading the map...
Real estate property taxes paid for housing units in 2022:
This zip code:
1.0% ($2,321)
Ohio:
1.3% ($2,639)
Median real estate property taxes paid for housing units with mortgages in 2022: $2,353 (1.0%) Median real estate property taxes paid for housing units with no mortgage in 2022: $2,283 (1.0%)
Business Search- 14 Million verified businesses
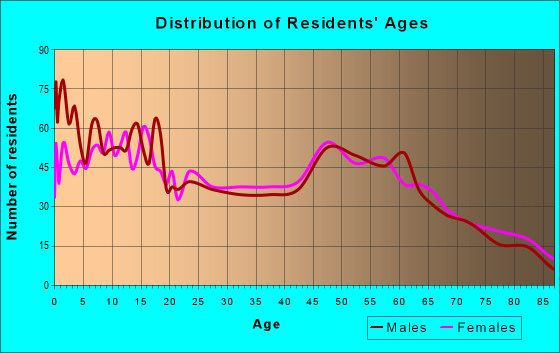
Males: 3,707
(48.6%)
Females: 3,921
(51.4%)
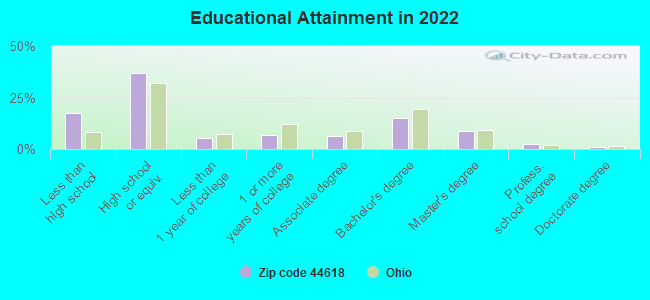
For population 25 years and over in 44618:
High school or higher: 81.5%
Bachelor's degree or higher: 26.6%
Graduate or professional degree: 11.8%
Unemployed: 0.9%
Mean travel time to work (commute): 19.3 minutes
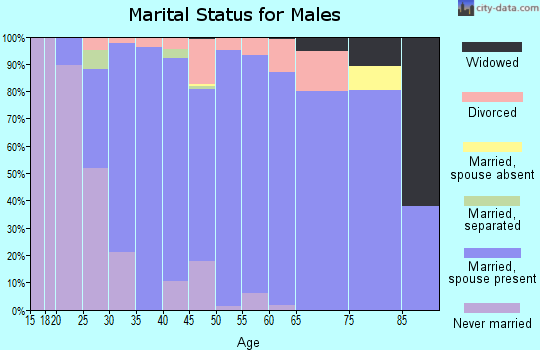
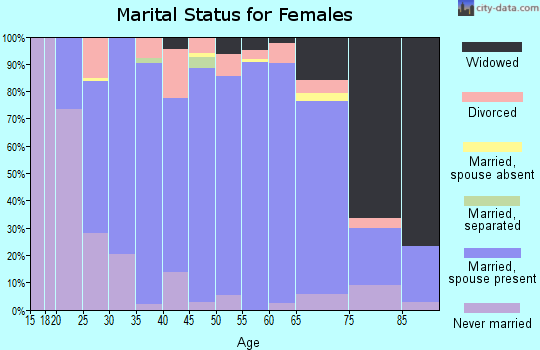
For population 15 years and over in 44618:
Never married: 23.8%
Now married: 63.4%
Separated: 1.3%
Widowed: 6.4%
Divorced: 5.1%
Zip code 44618 compared to state average:
Unemployed percentage significantly below state average.
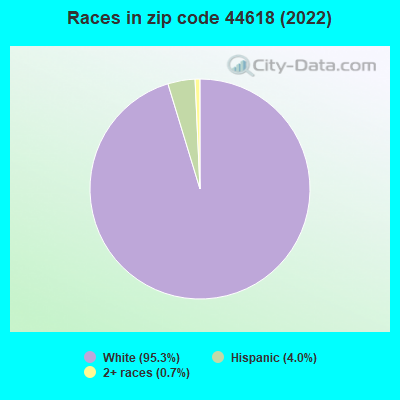
Black race population percentage significantly below state average.
Median age below state average.
Foreign-born population percentage significantly below state average.
Length of stay since moving in significantly above state average.
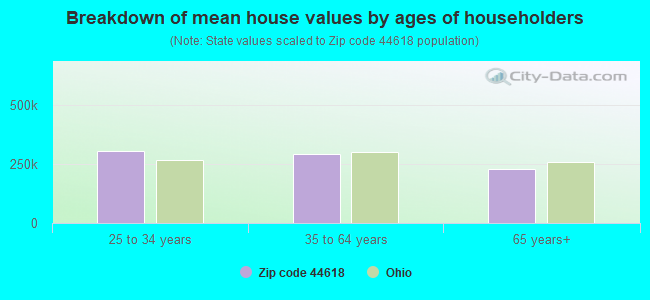
Estimated median house/condo value in 2022: $231,046
44618:
$231,046
Ohio:
$204,100
According to our research of Ohio and other state lists, there was 1 registered sex offender living in 44618 zip code as of April 27, 2024. The ratio of all residents to sex offenders in zip code 44618 is 6,834 to 1. The ratio of registered sex offenders to all residents in this zip code is much lower than the state average.
Median resident age:
This zip code:
34.5 years
Ohio median age:
39.9 years
Average household size:
This zip code:
2.8 people
Ohio:
2.4 people
Averages for the 2020 tax year for zip code 44618, filed in 2021:
Average Adjusted Gross Income (AGI) in 2020: $82,290 (Individual Income Tax Returns)
Here:
$82,290
State:
$67,288
Salary/wage: $52,332 (reported on 75.4% of returns)
Here:
$52,332
State:
$55,628
(% of AGI for various income ranges: 1331.6% for AGIs below $25k, 4176.4% for AGIs $25k-50k, 6573.5% for AGIs $50k-75k, 9521.3% for AGIs $75k-100k, 17927.4% for AGIs $100k-200k, 81080.0% for AGIs over 200k)
Taxable interest for individuals: $1,428 (reported on 37.2% of returns)
This zip code:
$1,428
Ohio:
$1,518
(% of AGI for various income ranges: 39.6% for AGIs below $25k, 42.6% for AGIs $25k-50k, 69.4% for AGIs $50k-75k, 89.6% for AGIs $75k-100k, 107.9% for AGIs $100k-200k, 2940.0% for AGIs over 200k)
Ordinary dividends: $7,092 (reported on 19.4% of returns)
Here:
$7,092
State:
$7,167
(% of AGI for various income ranges: 30.4% for AGIs below $25k, 61.2% for AGIs $25k-50k, 63.8% for AGIs $50k-75k, 181.7% for AGIs $75k-100k, 197.4% for AGIs $100k-200k, 13950.0% for AGIs over 200k)
Net capital gain/loss in AGI: +$95,282 (reported on 19.7% of returns)
Here:
+$95,282
State:
+$18,919
(% of AGI for various income ranges: 38.2% for AGIs below $25k, 80.0% for AGIs $25k-50k, 158.5% for AGIs $50k-75k, 348.7% for AGIs $75k-100k, 1070.0% for AGIs $100k-200k, 270805.0% for AGIs over 200k)
Profit/loss from business: +$23,790 (reported on 22.0% of returns)
Here:
+$23,790
State:
+$13,744
(% of AGI for various income ranges: 255.7% for AGIs below $25k, 372.8% for AGIs $25k-50k, 559.1% for AGIs $50k-75k, 694.8% for AGIs $75k-100k, 1809.5% for AGIs $100k-200k, 30615.0% for AGIs over 200k)
Taxable individual retirement arrangement distribution: $13,579 (reported on 12.3% of returns)
44618:
$13,579
Ohio:
$18,876
(% of AGI for various income ranges: 130.4% for AGIs below $25k, 169.6% for AGIs $25k-50k, 194.7% for AGIs $50k-75k, 431.7% for AGIs $75k-100k, 1062.1% for AGIs $100k-200k)
Self-employed (Keogh) retirement plans: $14,433 (reported on 1.0% of returns)
44618:
$14,433
Ohio:
$24,898
(% of AGI for various income ranges: 227.9% for AGIs $100k-200k)
Total itemized deductions: $69,889 (reported on 5.8% of returns)
Here:
$69,889
State:
$33,869
(% of AGI for various income ranges: 105.5% for AGIs below $25k, 172.4% for AGIs $50k-75k, 442.6% for AGIs $75k-100k, 884.7% for AGIs $100k-200k, 43890.0% for AGIs over 200k)
Charity contributions: $55,612 (reported on 5.5% of returns)
Here:
$55,612
State:
$14,577
(% of AGI for various income ranges: 55.4% for AGIs $25k-50k, 189.1% for AGIs $75k-100k, 437.9% for AGIs $100k-200k, 39550.0% for AGIs over 200k)
Taxes paid: $6,844 (reported on 5.8% of returns)
44618:
$6,844
State:
$7,681
(% of AGI for various income ranges: 15.9% for AGIs below $25k, 31.8% for AGIs $50k-75k, 72.6% for AGIs $75k-100k, 187.4% for AGIs $100k-200k, 2615.0% for AGIs over 200k)
Earned income credit: $2,062 (reported on 9.4% of returns)
Here:
$2,062
State:
$2,304
(% of AGI for various income ranges: 67.3% for AGIs below $25k, 53.6% for AGIs $25k-50k)
Percentage of individuals using paid preparers for their 2020 taxes: 93.9%
Here:
94%
State:
94%
(% for various income ranges: 93.2% for AGIs below $25k, 93.8% for AGIs $25k-50k, 94.3% for AGIs $50k-75k, 94.4% for AGIs $75k-100k, 94.9% for AGIs $100k-200k, 91.7% for AGIs over 200k)
Averages for the 2012 tax year for zip code 44618, filed in 2013:
Average Adjusted Gross Income (AGI) in 2012: $52,446 (Individual Income Tax Returns)
Here:
$52,446
State:
$54,926
Salary/wage: $42,041 (reported on 79.4% of returns)
Here:
$42,041
State:
$45,869
(% of AGI for various income ranges: 69.0% for AGIs below $25k, 72.5% for AGIs $25k-50k, 73.2% for AGIs $50k-75k, 72.8% for AGIs $75k-100k, 70.1% for AGIs $100k-200k, 33.6% for AGIs over 200k)
Taxable interest for individuals: $1,230 (reported on 37.2% of returns)
This zip code:
$1,230
Ohio:
$1,297
(% of AGI for various income ranges: 2.4% for AGIs below $25k, 0.9% for AGIs $25k-50k, 0.5% for AGIs $50k-75k, 0.7% for AGIs $75k-100k, 0.9% for AGIs $100k-200k, 0.7% for AGIs over 200k)
Ordinary dividends: $3,017 (reported on 19.6% of returns)
Here:
$3,017
State:
$5,821
(% of AGI for various income ranges: 1.7% for AGIs below $25k, 0.9% for AGIs $25k-50k, 0.7% for AGIs $50k-75k, 1.3% for AGIs $75k-100k, 1.3% for AGIs $100k-200k, 1.4% for AGIs over 200k)
Net capital gain/loss in AGI: +$11,448 (reported on 17.3% of returns)
Here:
+$11,448
State:
+$11,232
(% of AGI for various income ranges: 1.2% for AGIs below $25k, 1.3% for AGIs $25k-50k, 1.3% for AGIs $50k-75k, 1.8% for AGIs $75k-100k, 2.9% for AGIs $100k-200k, 11.3% for AGIs over 200k)
Profit/loss from business: +$16,868 (reported on 18.6% of returns)
Here:
+$16,868
State:
+$12,773
(% of AGI for various income ranges: 8.8% for AGIs below $25k, 5.3% for AGIs $25k-50k, 4.6% for AGIs $50k-75k, 7.1% for AGIs $75k-100k, 14.1% for AGIs $100k-200k)
Taxable individual retirement arrangement distribution: $9,778 (reported on 10.6% of returns)
44618:
$9,778
Ohio:
$14,511
(% of AGI for various income ranges: 4.4% for AGIs below $25k, 2.7% for AGIs $25k-50k, 1.8% for AGIs $50k-75k, 1.8% for AGIs $75k-100k, 3.0% for AGIs $100k-200k)
Total itemized deductions: $20,904 (19% of AGI, reported on 26.6% of returns)
Here:
$20,904
State:
$21,278
Here:
19.5% of AGI
State:
18.8% of AGI
(% of AGI for various income ranges: 6.6% for AGIs below $25k, 7.6% for AGIs $25k-50k, 10.4% for AGIs $50k-75k, 11.7% for AGIs $75k-100k, 15.5% for AGIs $100k-200k, 10.7% for AGIs over 200k)
Charity contributions: $6,805 (reported on 21.9% of returns)
Here:
$6,805
State:
$3,943
(% of AGI for various income ranges: 1.0% for AGIs below $25k, 1.7% for AGIs $25k-50k, 2.6% for AGIs $50k-75k, 3.0% for AGIs $75k-100k, 4.5% for AGIs $100k-200k, 3.6% for AGIs over 200k)
Taxes paid: $7,386 (reported on 26.6% of returns)
44618:
$7,386
State:
$9,568
(% of AGI for various income ranges: 1.0% for AGIs below $25k, 1.7% for AGIs $25k-50k, 3.2% for AGIs $50k-75k, 4.0% for AGIs $75k-100k, 6.0% for AGIs $100k-200k, 5.4% for AGIs over 200k)
Earned income credit: $2,056 (reported on 11.3% of returns)
Here:
$2,056
State:
$2,285
(% of AGI for various income ranges: 3.6% for AGIs below $25k, 0.7% for AGIs $25k-50k)
Percentage of individuals using paid preparers for their 2012 taxes: 66.4%
Here:
66%
State:
51%
(% for various income ranges: 60.6% for AGIs below $25k, 68.9% for AGIs $25k-50k, 72.0% for AGIs $50k-75k, 65.4% for AGIs $75k-100k, 65.0% for AGIs $100k-200k, 100.0% for AGIs over 200k)
Averages for the 2004 tax year for zip code 44618, filed in 2005:
Average Adjusted Gross Income (AGI) in 2004: $40,455 (Individual Income Tax Returns)
Here:
$40,455
State:
$44,480
Salary/wage: $35,404 (reported on 82.2% of returns)
Here:
$35,404
State:
$39,198
(% of AGI for various income ranges: 101.2% for AGIs below $10k, 70.0% for AGIs $10k-25k, 77.8% for AGIs $25k-50k, 80.2% for AGIs $50k-75k, 81.4% for AGIs $75k-100k, 50.8% for AGIs over 100k)
Taxable interest for individuals: $1,661 (reported on 52.0% of returns)
This zip code:
$1,661
Ohio:
$1,532
(% of AGI for various income ranges: 7.9% for AGIs below $10k, 3.1% for AGIs $10k-25k, 1.3% for AGIs $25k-50k, 1.0% for AGIs $50k-75k, 1.6% for AGIs $75k-100k, 3.7% for AGIs over 100k)
Taxable dividends: $1,983 (reported on 24.1% of returns)
Here:
$1,983
State:
$3,496
(% of AGI for various income ranges: 4.7% for AGIs below $10k, 1.1% for AGIs $10k-25k, 0.7% for AGIs $25k-50k, 0.5% for AGIs $50k-75k, 0.4% for AGIs $75k-100k, 2.6% for AGIs over 100k)
Net capital gain/loss: +$7,128 (reported on 19.3% of returns)
Here:
+$7,128
State:
+$8,582
(% of AGI for various income ranges: -0.6% for AGIs below $10k, 1.5% for AGIs $10k-25k, 1.7% for AGIs $25k-50k, 2.6% for AGIs $50k-75k, 3.2% for AGIs $75k-100k, 7.4% for AGIs over 100k)
Profit/loss from business: +$12,964 (reported on 18.6% of returns)
Here:
+$12,964
State:
+$10,813
(% of AGI for various income ranges: -6.7% for AGIs below $10k, 8.2% for AGIs $10k-25k, 5.7% for AGIs $25k-50k, 4.0% for AGIs $50k-75k, 3.3% for AGIs $75k-100k, 9.6% for AGIs over 100k)
Profit/loss from farming: +$5,276 (reported on 6.2% of returns)
Here:
+$5,276
State:
-$3,706
(% of AGI for various income ranges: 2.0% for AGIs below $10k, 0.8% for AGIs $10k-25k, 1.0% for AGIs $25k-50k, 2.0% for AGIs $50k-75k, -0.1% for AGIs over 100k)
IRA payment deduction: $2,888 (reported on 2.7% of returns)
44618:
$2,888
Ohio:
$2,794
Self-employed pension: $12,333 (reported on 0.5% of returns)
Here:
$12,333
Ohio:
$13,981
Total itemized deductions: $15,028 (20% of AGI, reported on 31.0% of returns)
Here:
$15,028
State:
$17,503
Here:
20.3% of AGI
State:
20.8% of AGI
(% of AGI for various income ranges: 10.7% for AGIs below $10k, 6.9% for AGIs $10k-25k, 9.5% for AGIs $25k-50k, 12.7% for AGIs $50k-75k, 15.1% for AGIs $75k-100k, 12.5% for AGIs over 100k)
Charity contributions deductions: $4,571 (6% of AGI, reported on 26.2% of returns)
Here:
$4,571
State:
$3,087
Here:
5.8% of AGI
State:
3.4% of AGI
(% of AGI for various income ranges: 1.4% for AGIs below $10k, 1.2% for AGIs $10k-25k, 2.1% for AGIs $25k-50k, 2.9% for AGIs $50k-75k, 3.5% for AGIs $75k-100k, 4.6% for AGIs over 100k)
Total tax: $5,301 (reported on 77.7% of returns)
44618:
$5,301
State:
$6,781
(% of AGI for various income ranges: 4.1% for AGIs below $10k, 4.8% for AGIs $10k-25k, 6.8% for AGIs $25k-50k, 7.7% for AGIs $50k-75k, 9.4% for AGIs $75k-100k, 19.6% for AGIs over 100k)
Earned income credit: $1,468 (reported on 9.0% of returns)
Here:
$1,468
State:
$1,696
Percentage of individuals using paid preparers for their 2004 taxes: 63.9%
Here:
64%
State:
55%
(% for various income ranges: 52.9% for AGIs below $10k, 65.8% for AGIs $10k-25k, 68.3% for AGIs $25k-50k, 62.0% for AGIs $50k-75k, 63.2% for AGIs $75k-100k, 75.5% for AGIs over 100k)
Likely homosexual households (counted as self-reported same-sex unmarried-partner households)
Lesbian couples: 0.0% of all households
Gay men: 0.2% of all households
Household received Food Stamps/SNAP in the past 12 months: 100 Household did not receive Food Stamps/SNAP in the past 12 months: 2,576
Women who had a birth in the past 12 months: 193 (150 now married, 44 unmarried) Women who did not have a birth in the past 12 months: 1,359 (752 now married, 606 unmarried)
Housing units in zip code 44618 with a mortgage: 1,104 (152 second mortgage, 123 both second mortgage and home equity loan) Houses without a mortgage: 116
Median monthly owner costs for units with a mortgage: $1,246 Median monthly owner costs for units without a mortgage: $525
Residents with income below the poverty level in 2022:
This zip code:
9.0%
Whole state:
13.4%
Residents with income below 50% of the poverty level in 2022:
This zip code:
6.4%
Whole state:
7.0%
Median number of rooms in houses and condos:
Here:
7.1
State:
6.7
Median number of rooms in apartments:
Here:
4.8
State:
4.4
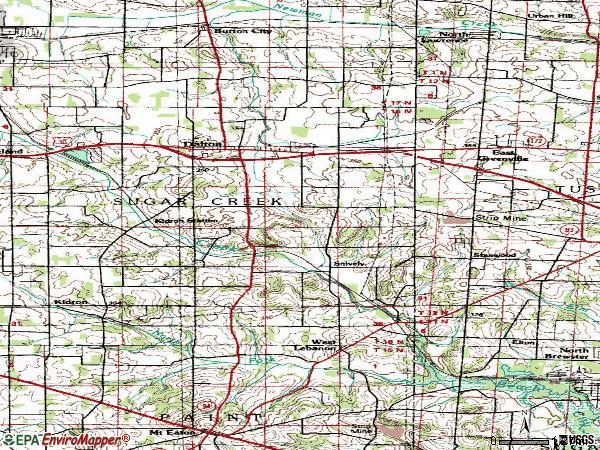
Notable locations in this zip code not listed on our city pages
Notable locations in zip code 44618: Kidron Station (A), Sunny Slope Dairy Farm (B), Dalton Sewage Treatment Plant (C), Nussbaum Farms (D), Spuhler Farms (E), Milgood Farms (F), Johnson Farms (G), Eberly Farms (H), Mercadel Farm (I), Raygor Farms (J), Hauenstein Farm (K), Amstutz Farm (L), McGinn Farms (M), Willowwood Farm (N), Pauli Farm (O), Shadyview Farms (P), Regnew Farms (Q), Good Farm (R), Hillcrest Farm (S), Renwind Farms (T). Display/hide their locations on the map
Churches in zip code 44618 include: County Line Mennonite Church (A), Sonnenberg Mennonite Church (B), Kidron Mennonite Church (C), Martin's Mennonite Church (D), Pleasant Valley Church (E), Salem Mennonite Church (F), Stanwood Evangelical and Reformed Church (G). Display/hide their locations on the map
Cemeteries: Union Cemetery (1), West Lebanon Lutheran Cemetery (2), Sugar Creek Township Cemetery (3), Sonnenberg Mennonite Cemetery (4), Salem Mennonite Cemetery (5), Pleasant Valley Cemetery (6), Martins Mennonite Cemetery (7). Display/hide their locations on the map
In group quarters: 96 (-1 institutionalized population)
Size of family households: 994 2-persons, 363 3-persons, 247 4-persons, 172 5-persons, 118 6-persons, 155 7-or-more-persons
Size of nonfamily households: 565 1-person, 52 2-persons
1,838 married couples with children.
301 single-parent households (7 men, 294 women).
79.8% of residents of 44618 zip code speak English at home.
2.2% of residents speak Spanish at home (86% very well, 5% well, 7% not well, 2% not at all).
19.0% of residents speak other Indo-European language at home (60% very well, 37% well, 2% not well).
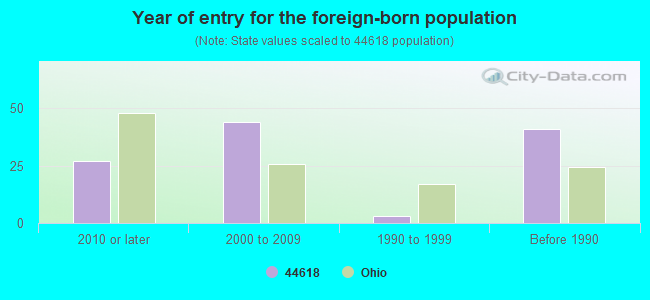
0.8% of residents speak other language at home (85% very well, 15% not well).
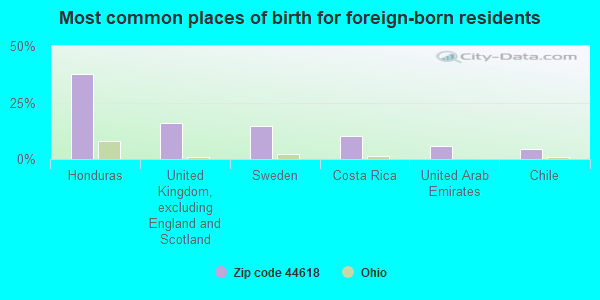
Foreign born population: 87 (1.1%) (23.6% of them are naturalized citizens)
This zip code:
1.1%
Whole state:
5.0%
38%Honduras
16%United Kingdom, excluding England and Scotland
15%Sweden
10%Costa Rica
6%United Arab Emirates
5%Chile
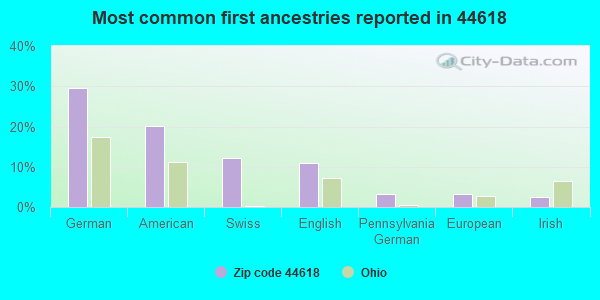
29%German
20%American
12%Swiss
11%English
3%Pennsylvania German
3%European
2%Irish
Year of entry for the foreign-born population
272010 or later
442000 to 2009
31990 to 1999
41Before 1990
Facilities with environmental interests located in this zip code:
BUCKEYE NUTRITION (330 E SCHULTZ AVE in DALTON, OH)
Conditionally Exempt Small Quantity Generators, less than 100 kg/month of hazardous waste (Resource Conservation and Recovery Act (tracking hazardous waste)) - notification Organizations: BUCKEYE FEED MILLS INC (CONTACT/OWNER)
Housing units lacking complete plumbing facilities: 2.6% Housing units lacking complete kitchen facilities: 3.9%
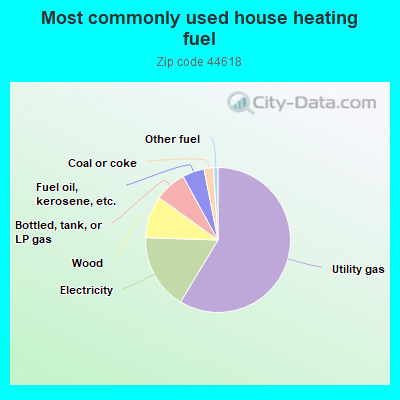
58.7%Utility gas
16.9%Electricity
9.4%Wood
7.1%Bottled, tank, or LP gas
4.9%Fuel oil, kerosene, etc.
2.1%Coal or coke
1.0%Other fuel
Population in 1990: 6,069. Population change in the 1990s: +565 (+9.3%).
Place of birth for U.S.-born residents:
This state: 6,730
Northeast: 273
Midwest: 148
South: 197
West: 159
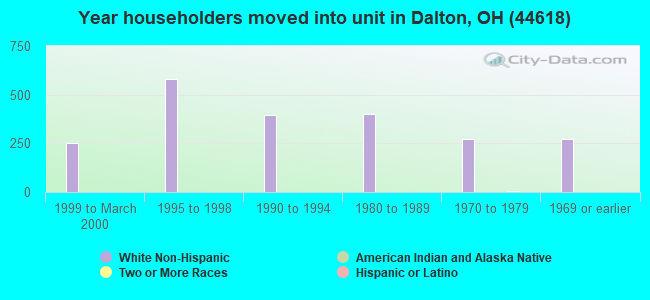
65% of the 44618 zip code residents lived in the same house 5 years ago. Out of people who lived in different houses, 65% lived in this county. Out of people who lived in different counties, 50% lived in Ohio.
94% of the 44618 zip code residents lived in the same house 1 year ago. Out of people who lived in different houses, 66% moved from this county. Out of people who lived in different houses, 29% moved from different county within same state. Out of people who lived in different houses, 6% moved from different state. Out of people who lived in different houses, 0% moved from abroad.
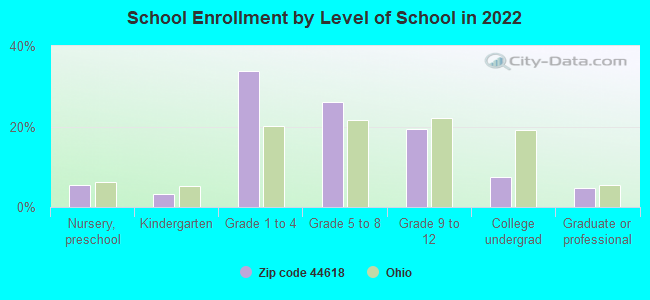
Private vs. public school enrollment:
Students in private schools in grades 1 to 8 (elementary and middle school): 399
Here:
39.7%
Ohio:
16.0%
Students in private schools in grades 9 to 12 (high school): 42
Here:
13.3%
Ohio:
13.1%
Students in private undergraduate colleges: 25
Here:
20.7%
Ohio:
22.3%
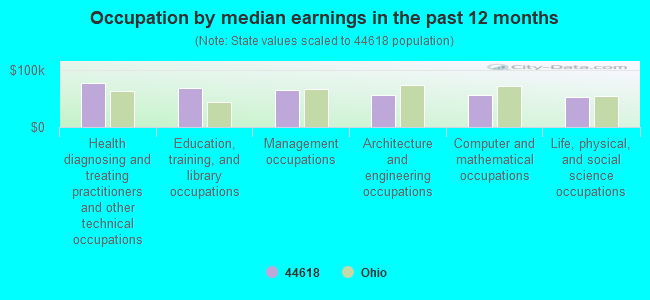
Occupation by median earnings in the past 12 months ($)
76,755Health diagnosing and treating practitioners and other technical occupations
68,124Education, training, and library occupations
64,825Management occupations
55,584Architecture and engineering occupations
55,318Computer and mathematical occupations
51,895Life, physical, and social science occupations
Companies with federal contracts located in this zip code:
SANTMYER OIL CO OF ASHLAND INC (39 N COCHRAN ST in DALTON, OH; small business)
$1,407 with Army for Fuel Oils. Signed on 2004-12-03. Completion date: 2004-12-31.
Top industries in this zip code by the number of employees in 2005:
Health Care and Social Assistance: Nursing Care Facilities (100-249 employees: 1 establishment)
Construction: Site Preparation Contractors (50-99: 1, 1-4: 4)
Accommodation and Food Services: Limited-Service Restaurants (20-49: 2, 5-9: 1)
Accommodation and Food Services: Full-Service Restaurants (50-99: 1)
Construction: New Housing Operative Builders (20-49: 1, 10-19: 1)
People in group quarters in 2010:
72 people in nursing facilities/skilled-nursing facilities
People in group quarters in 2000:
120 people in nursing homes
Fatal accident statistics in 2013:
Fatal accident count: 2
Vehicles involved in fatal accidents: 3
Fatal accidents caused by drunken drivers: 1
Fatalities: 2
Persons involved in fatal accidents: 5
Pedestrians involved in fatal accidents: 0
Fatal accident statistics in 2012:
Fatal accident count: 2
Vehicles involved in fatal accidents: 4
Fatal accidents caused by drunken drivers: 0
Fatalities: 2
Persons involved in fatal accidents: 7
Pedestrians involved in fatal accidents: 0
Home Mortgage Disclosure Act Aggregated Statistics For Year 2009 (Based on 2 partial tracts)
A) FHA, FSA/RHS & VA Home Purchase Loans
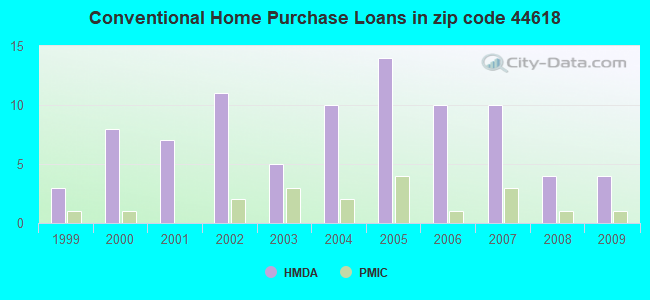
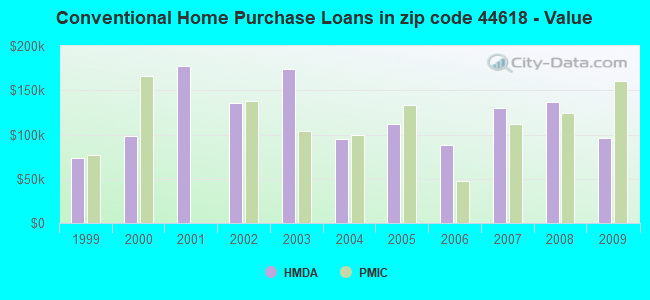
B) Conventional Home Purchase Loans
C) Refinancings
D) Home Improvement Loans
Number
Average Value
Number
Average Value
Number
Average Value
Number
Average Value
LOANS ORIGINATED
3
$128,977
4
$96,102
12
$147,766
0
$0
APPLICATIONS APPROVED, NOT ACCEPTED
0
$0
0
$0
1
$219,000
0
$0
APPLICATIONS DENIED
0
$0
0
$0
6
$155,347
1
$28,770
APPLICATIONS WITHDRAWN
0
$0
0
$0
3
$124,900
0
$0
FILES CLOSED FOR INCOMPLETENESS
0
$0
0
$0
1
$123,700
0
$0
Aggregated Statistics For Year 2008 (Based on 2 partial tracts)
A) FHA, FSA/RHS & VA Home Purchase Loans
B) Conventional Home Purchase Loans
C) Refinancings
D) Home Improvement Loans
F) Non-occupant Loans on < 5 Family Dwellings (A B C & D)
Number
Average Value
Number
Average Value
Number
Average Value
Number
Average Value
Number
Average Value
LOANS ORIGINATED
3
$113,033
4
$136,648
10
$141,179
2
$19,960
3
$74,557
APPLICATIONS APPROVED, NOT ACCEPTED
0
$0
1
$116,870
1
$215,760
0
$0
0
$0
APPLICATIONS DENIED
0
$0
1
$149,950
8
$123,478
2
$37,040
0
$0
APPLICATIONS WITHDRAWN
0
$0
1
$93,860
1
$277,610
0
$0
0
$0
FILES CLOSED FOR INCOMPLETENESS
0
$0
0
$0
1
$120,830
0
$0
0
$0
Aggregated Statistics For Year 2007 (Based on 2 partial tracts)
A) FHA, FSA/RHS & VA Home Purchase Loans
B) Conventional Home Purchase Loans
C) Refinancings
D) Home Improvement Loans
F) Non-occupant Loans on < 5 Family Dwellings (A B C & D)
G) Loans On Manufactured Home Dwelling (A B C & D)
Number
Average Value
Number
Average Value
Number
Average Value
Number
Average Value
Number
Average Value
Number
Average Value
LOANS ORIGINATED
1
$141,320
10
$130,175
13
$95,238
3
$39,077
1
$160,380
1
$39,560
APPLICATIONS APPROVED, NOT ACCEPTED
0
$0
1
$238,410
5
$100,400
1
$60,050
0
$0
0
$0
APPLICATIONS DENIED
0
$0
2
$154,270
12
$115,102
3
$24,693
0
$0
0
$0
APPLICATIONS WITHDRAWN
0
$0
0
$0
5
$98,530
0
$0
0
$0
1
$62,210
FILES CLOSED FOR INCOMPLETENESS
0
$0
0
$0
1
$111,840
0
$0
0
$0
0
$0
Aggregated Statistics For Year 2006 (Based on 2 partial tracts)
A) FHA, FSA/RHS & VA Home Purchase Loans
B) Conventional Home Purchase Loans
C) Refinancings
D) Home Improvement Loans
F) Non-occupant Loans on < 5 Family Dwellings (A B C & D)
Number
Average Value
Number
Average Value
Number
Average Value
Number
Average Value
Number
Average Value
LOANS ORIGINATED
1
$100,330
10
$87,599
18
$145,938
4
$38,658
1
$113,630
APPLICATIONS APPROVED, NOT ACCEPTED
0
$0
1
$107,520
5
$155,706
0
$0
0
$0
APPLICATIONS DENIED
0
$0
2
$78,750
14
$138,986
2
$63,830
0
$0
APPLICATIONS WITHDRAWN
0
$0
0
$0
6
$112,675
1
$51,420
0
$0
FILES CLOSED FOR INCOMPLETENESS
0
$0
0
$0
1
$206,410
0
$0
0
$0
Aggregated Statistics For Year 2005 (Based on 2 partial tracts)
A) FHA, FSA/RHS & VA Home Purchase Loans
B) Conventional Home Purchase Loans
C) Refinancings
D) Home Improvement Loans
F) Non-occupant Loans on < 5 Family Dwellings (A B C & D)
Number
Average Value
Number
Average Value
Number
Average Value
Number
Average Value
Number
Average Value
LOANS ORIGINATED
1
$181,960
14
$112,066
20
$137,673
2
$43,510
1
$39,200
APPLICATIONS APPROVED, NOT ACCEPTED
0
$0
0
$0
5
$102,558
1
$106,080
0
$0
APPLICATIONS DENIED
0
$0
3
$65,207
13
$100,162
1
$86,300
2
$52,140
APPLICATIONS WITHDRAWN
0
$0
1
$31,290
13
$194,378
2
$86,845
0
$0
FILES CLOSED FOR INCOMPLETENESS
0
$0
0
$0
2
$147,795
0
$0
0
$0
Aggregated Statistics For Year 2004 (Based on 2 partial tracts)
B) Conventional Home Purchase Loans
C) Refinancings
D) Home Improvement Loans
F) Non-occupant Loans on < 5 Family Dwellings (A B C & D)
G) Loans On Manufactured Home Dwelling (A B C & D)
Number
Average Value
Number
Average Value
Number
Average Value
Number
Average Value
Number
Average Value
LOANS ORIGINATED
10
$94,611
21
$150,980
2
$25,890
1
$36,680
1
$44,590
APPLICATIONS APPROVED, NOT ACCEPTED
1
$143,120
4
$138,985
0
$0
0
$0
1
$47,830
APPLICATIONS DENIED
3
$72,760
15
$110,757
3
$49,147
1
$39,920
1
$65,090
APPLICATIONS WITHDRAWN
0
$0
8
$123,972
0
$0
0
$0
0
$0
FILES CLOSED FOR INCOMPLETENESS
0
$0
2
$89,720
0
$0
0
$0
0
$0
Aggregated Statistics For Year 2003 (Based on 2 partial tracts)
B) Conventional Home Purchase Loans
C) Refinancings
D) Home Improvement Loans
F) Non-occupant Loans on < 5 Family Dwellings (A B C & D)
Number
Average Value
Number
Average Value
Number
Average Value
Number
Average Value
LOANS ORIGINATED
5
$174,478
46
$129,831
1
$32,000
1
$85,940
APPLICATIONS APPROVED, NOT ACCEPTED
0
$0
7
$93,239
0
$0
0
$0
APPLICATIONS DENIED
0
$0
10
$114,389
1
$7,910
0
$0
APPLICATIONS WITHDRAWN
0
$0
5
$229,424
0
$0
0
$0
FILES CLOSED FOR INCOMPLETENESS
0
$0
0
$0
0
$0
0
$0
Aggregated Statistics For Year 2002 (Based on 2 partial tracts)
A) FHA, FSA/RHS & VA Home Purchase Loans
B) Conventional Home Purchase Loans
C) Refinancings
D) Home Improvement Loans
F) Non-occupant Loans on < 5 Family Dwellings (A B C & D)
Number
Average Value
Number
Average Value
Number
Average Value
Number
Average Value
Number
Average Value
LOANS ORIGINATED
1
$79,110
11
$136,125
35
$135,579
2
$30,745
1
$95,650
APPLICATIONS APPROVED, NOT ACCEPTED
0
$0
0
$0
7
$112,760
1
$7,190
0
$0
APPLICATIONS DENIED
0
$0
0
$0
10
$137,367
1
$31,640
0
$0
APPLICATIONS WITHDRAWN
0
$0
1
$182,680
5
$71,272
2
$28,050
0
$0
FILES CLOSED FOR INCOMPLETENESS
0
$0
0
$0
1
$90,980
0
$0
0
$0
Aggregated Statistics For Year 2001 (Based on 2 partial tracts)
A) FHA, FSA/RHS & VA Home Purchase Loans
B) Conventional Home Purchase Loans
C) Refinancings
D) Home Improvement Loans
Number
Average Value
Number
Average Value
Number
Average Value
Number
Average Value
LOANS ORIGINATED
1
$78,030
7
$177,694
26
$97,438
3
$18,580
APPLICATIONS APPROVED, NOT ACCEPTED
0
$0
2
$69,405
6
$101,347
1
$5,390
APPLICATIONS DENIED
0
$0
4
$53,760
15
$88,198
2
$18,520
APPLICATIONS WITHDRAWN
0
$0
0
$0
4
$104,105
0
$0
FILES CLOSED FOR INCOMPLETENESS
0
$0
0
$0
1
$140,600
0
$0
Aggregated Statistics For Year 2000 (Based on 2 partial tracts)
B) Conventional Home Purchase Loans
C) Refinancings
D) Home Improvement Loans
F) Non-occupant Loans on < 5 Family Dwellings (A B C & D)
Number
Average Value
Number
Average Value
Number
Average Value
Number
Average Value
LOANS ORIGINATED
8
$97,856
12
$74,737
4
$24,092
1
$60,050
APPLICATIONS APPROVED, NOT ACCEPTED
1
$36,680
4
$84,595
1
$38,120
0
$0
APPLICATIONS DENIED
2
$44,230
8
$100,732
4
$19,238
0
$0
APPLICATIONS WITHDRAWN
2
$97,630
5
$68,684
0
$0
1
$59,690
FILES CLOSED FOR INCOMPLETENESS
0
$0
1
$100,330
0
$0
0
$0
Aggregated Statistics For Year 1999 (Based on 1 partial tract)
Detailed PMIC statistics for the following Tracts:7147.02
2002 - 2018 National Fire Incident Reporting System (NFIRS) incidents
According to the data from the years 2002 - 2018 the average number of fire incidents per year is 28. The highest number of reported fire incidents - 49 took place in 2010, and the least - 5 in 2002. The data has an increasing trend.
When looking into fire subcategories, the most incidents belonged to: Structure Fires (55.6%), and Outside Fires (30.9%).
Fire incident types reported to NFIRS in Zip Code 44618


+$5,276
-$3,706
(% of AGI for various income ranges: 2.0% for AGIs below $10k, 0.8% for AGIs $10k-25k, 1.0% for AGIs $25k-50k, 2.0% for AGIs $50k-75k, -0.1% for AGIs over 100k) Nearest zip codes: 44659, 44666, 44613, 44667, 44647, 44606.
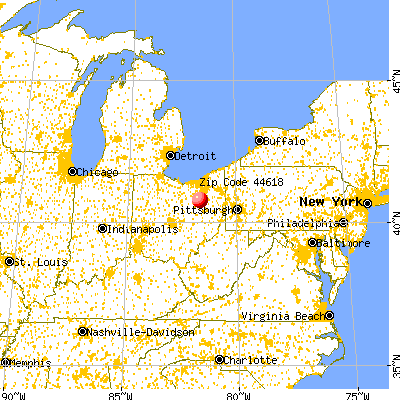


 According to the data from the years 2002 - 2018 the average number of fire incidents per year is 28. The highest number of reported fire incidents - 49 took place in 2010, and the least - 5 in 2002. The data has an increasing trend.
 When looking into fire subcategories, the most incidents belonged to: Structure Fires (55.6%), and Outside Fires (30.9%).