Estimated zip code population in 2022: 13,813
Zip code population in 2010: 13,818
Zip code population in 2000: 14,882
Houses and condos: 6,067
Renter-occupied apartments: 1,457
% of renters here:
26%State:
33%
March 2022 cost of living index in zip code 44875: 89.9
(less than average, U.S. average is 100)
Land area: 79.1
sq. mi.
Water area: 0.4
sq. mi.
Population density: 175 people per square mile (very low).
OSM Map
General Map
Google Map
MSN Map
OSM Map
General Map
Google Map
MSN Map
OSM Map
General Map
Google Map
MSN Map
OSM Map
General Map
Google Map
MSN Map
Please wait while loading the map...
Real estate property taxes paid for housing units in 2022:
This zip code:
1.0% ($1,530)Ohio:
1.3% ($2,639)
Median real estate property taxes paid for housing units with mortgages in 2022: $1,662 (1.0%)
Median real estate property taxes paid for housing units with no mortgage in 2022: $1,366 (1.0%)
Profiles of local businesses
Business Search - 14 Million verified businesses
Males: 6,367 Females: 7,445
For population 25 years and over in 44875:
High school or higher: 90.9%Bachelor's degree or higher: 16.3%Graduate or professional degree: 7.5%Unemployed: 2.8%Mean travel time to work (commute): 20.7 minutes
For population 15 years and over in 44875:
Never married: 19.5%Now married: 57.8%Separated: 0.3%Widowed: 8.9%Divorced: 13.4%
Zip code 44875 compared to state average:
Black race population percentage significantly below state average. Hispanic race population percentage below state average. Foreign-born population percentage significantly below state average. Length of stay since moving in significantly above state average. Number of college students below state average. Percentage of population with a bachelor's degree or higher below state average. 13,092 94.8% White 327 2.4% Hispanic or Latino 172 1.2% Asian 149 1.1% Two or more races 67 0.5% Black 2 0.01% American Indian
Data:
Median household income ($)
Median household income (% change since 2000)
Household income diversity
Ratio of average income to average house value (%)
Ratio of average income to average rent
Median household income ($) - White
Median household income ($) - Black or African American
Median household income ($) - Asian
Median household income ($) - Hispanic or Latino
Median household income ($) - American Indian and Alaska Native
Median household income ($) - Multirace
Median household income ($) - Other Race
Median household income for houses/condos with a mortgage ($)
Median household income for apartments without a mortgage ($)
Races - White alone (%)
Races - White alone (% change since 2000)
Races - Black alone (%)
Races - Black alone (% change since 2000)
Races - American Indian alone (%)
Races - American Indian alone (% change since 2000)
Races - Asian alone (%)
Races - Asian alone (% change since 2000)
Races - Hispanic (%)
Races - Hispanic (% change since 2000)
Races - Native Hawaiian and Other Pacific Islander alone (%)
Races - Native Hawaiian and Other Pacific Islander alone (% change since 2000)
Races - Two or more races (%)
Races - Two or more races (% change since 2000)
Races - Other race alone (%)
Races - Other race alone (% change since 2000)
Racial diversity
Unemployment (%)
Unemployment (% change since 2000)
Unemployment (%) - White
Unemployment (%) - Black or African American
Unemployment (%) - Asian
Unemployment (%) - Hispanic or Latino
Unemployment (%) - American Indian and Alaska Native
Unemployment (%) - Multirace
Unemployment (%) - Other Race
Population density (people per square mile)
Population - Males (%)
Population - Females (%)
Population - Males (%) - White
Population - Males (%) - Black or African American
Population - Males (%) - Asian
Population - Males (%) - Hispanic or Latino
Population - Males (%) - American Indian and Alaska Native
Population - Males (%) - Multirace
Population - Males (%) - Other Race
Population - Females (%) - White
Population - Females (%) - Black or African American
Population - Females (%) - Asian
Population - Females (%) - Hispanic or Latino
Population - Females (%) - American Indian and Alaska Native
Population - Females (%) - Multirace
Population - Females (%) - Other Race
Coronavirus confirmed cases (Apr 25, 2024)
Deaths caused by coronavirus (Apr 25, 2024)
Coronavirus confirmed cases (per 100k population) (Apr 25, 2024)
Deaths caused by coronavirus (per 100k population) (Apr 25, 2024)
Daily increase in number of cases (Apr 25, 2024)
Weekly increase in number of cases (Apr 25, 2024)
Cases doubled (in days) (Apr 25, 2024)
Hospitalized patients (Apr 18, 2022)
Negative test results (Apr 18, 2022)
Total test results (Apr 18, 2022)
COVID Vaccine doses distributed (per 100k population) (Sep 19, 2023)
COVID Vaccine doses administered (per 100k population) (Sep 19, 2023)
COVID Vaccine doses distributed (Sep 19, 2023)
COVID Vaccine doses administered (Sep 19, 2023)
Likely homosexual households (%)
Likely homosexual households (% change since 2000)
Likely homosexual households - Lesbian couples (%)
Likely homosexual households - Lesbian couples (% change since 2000)
Likely homosexual households - Gay men (%)
Likely homosexual households - Gay men (% change since 2000)
Cost of living index
Median gross rent ($)
Median contract rent ($)
Median monthly housing costs ($)
Median house or condo value ($)
Median house or condo value ($ change since 2000)
Mean house or condo value by units in structure - 1, detached ($)
Mean house or condo value by units in structure - 1, attached ($)
Mean house or condo value by units in structure - 2 ($)
Mean house or condo value by units in structure by units in structure - 3 or 4 ($)
Mean house or condo value by units in structure - 5 or more ($)
Mean house or condo value by units in structure - Boat, RV, van, etc. ($)
Mean house or condo value by units in structure - Mobile home ($)
Median house or condo value ($) - White
Median house or condo value ($) - Black or African American
Median house or condo value ($) - Asian
Median house or condo value ($) - Hispanic or Latino
Median house or condo value ($) - American Indian and Alaska Native
Median house or condo value ($) - Multirace
Median house or condo value ($) - Other Race
Median resident age
Resident age diversity
Median resident age - Males
Median resident age - Females
Median resident age - White
Median resident age - Black or African American
Median resident age - Asian
Median resident age - Hispanic or Latino
Median resident age - American Indian and Alaska Native
Median resident age - Multirace
Median resident age - Other Race
Median resident age - Males - White
Median resident age - Males - Black or African American
Median resident age - Males - Asian
Median resident age - Males - Hispanic or Latino
Median resident age - Males - American Indian and Alaska Native
Median resident age - Males - Multirace
Median resident age - Males - Other Race
Median resident age - Females - White
Median resident age - Females - Black or African American
Median resident age - Females - Asian
Median resident age - Females - Hispanic or Latino
Median resident age - Females - American Indian and Alaska Native
Median resident age - Females - Multirace
Median resident age - Females - Other Race
Commute - mean travel time to work (minutes)
Travel time to work - Less than 5 minutes (%)
Travel time to work - Less than 5 minutes (% change since 2000)
Travel time to work - 5 to 9 minutes (%)
Travel time to work - 5 to 9 minutes (% change since 2000)
Travel time to work - 10 to 19 minutes (%)
Travel time to work - 10 to 19 minutes (% change since 2000)
Travel time to work - 20 to 29 minutes (%)
Travel time to work - 20 to 29 minutes (% change since 2000)
Travel time to work - 30 to 39 minutes (%)
Travel time to work - 30 to 39 minutes (% change since 2000)
Travel time to work - 40 to 59 minutes (%)
Travel time to work - 40 to 59 minutes (% change since 2000)
Travel time to work - 60 to 89 minutes (%)
Travel time to work - 60 to 89 minutes (% change since 2000)
Travel time to work - 90 or more minutes (%)
Travel time to work - 90 or more minutes (% change since 2000)
Marital status - Never married (%)
Marital status - Now married (%)
Marital status - Separated (%)
Marital status - Widowed (%)
Marital status - Divorced (%)
Median family income ($)
Median family income (% change since 2000)
Median non-family income ($)
Median non-family income (% change since 2000)
Median per capita income ($)
Median per capita income (% change since 2000)
Median family income ($) - White
Median family income ($) - Black or African American
Median family income ($) - Asian
Median family income ($) - Hispanic or Latino
Median family income ($) - American Indian and Alaska Native
Median family income ($) - Multirace
Median family income ($) - Other Race
Median year house/condo built
Median year apartment built
Year house built - Built 2005 or later (%)
Year house built - Built 2000 to 2004 (%)
Year house built - Built 1990 to 1999 (%)
Year house built - Built 1980 to 1989 (%)
Year house built - Built 1970 to 1979 (%)
Year house built - Built 1960 to 1969 (%)
Year house built - Built 1950 to 1959 (%)
Year house built - Built 1940 to 1949 (%)
Year house built - Built 1939 or earlier (%)
Average household size
Household density (households per square mile)
Average household size - White
Average household size - Black or African American
Average household size - Asian
Average household size - Hispanic or Latino
Average household size - American Indian and Alaska Native
Average household size - Multirace
Average household size - Other Race
Occupied housing units (%)
Vacant housing units (%)
Owner occupied housing units (%)
Renter occupied housing units (%)
Vacancy status - For rent (%)
Vacancy status - For sale only (%)
Vacancy status - Rented or sold, not occupied (%)
Vacancy status - For seasonal, recreational, or occasional use (%)
Vacancy status - For migrant workers (%)
Vacancy status - Other vacant (%)
Residents with income below the poverty level (%)
Residents with income below 50% of the poverty level (%)
Children below poverty level (%)
Poor families by family type - Married-couple family (%)
Poor families by family type - Male, no wife present (%)
Poor families by family type - Female, no husband present (%)
Poverty status for native-born residents (%)
Poverty status for foreign-born residents (%)
Poverty among high school graduates not in families (%)
Poverty among people who did not graduate high school not in families (%)
Residents with income below the poverty level (%) - White
Residents with income below the poverty level (%) - Black or African American
Residents with income below the poverty level (%) - Asian
Residents with income below the poverty level (%) - Hispanic or Latino
Residents with income below the poverty level (%) - American Indian and Alaska Native
Residents with income below the poverty level (%) - Multirace
Residents with income below the poverty level (%) - Other Race
Air pollution - Air Quality Index (AQI)
Air pollution - CO
Air pollution - NO2
Air pollution - SO2
Air pollution - Ozone
Air pollution - PM10
Air pollution - PM25
Air pollution - Pb
Crime - Murders per 100,000 population
Crime - Rapes per 100,000 population
Crime - Robberies per 100,000 population
Crime - Assaults per 100,000 population
Crime - Burglaries per 100,000 population
Crime - Thefts per 100,000 population
Crime - Auto thefts per 100,000 population
Crime - Arson per 100,000 population
Crime - City-data.com crime index
Crime - Violent crime index
Crime - Property crime index
Crime - Murders per 100,000 population (5 year average)
Crime - Rapes per 100,000 population (5 year average)
Crime - Robberies per 100,000 population (5 year average)
Crime - Assaults per 100,000 population (5 year average)
Crime - Burglaries per 100,000 population (5 year average)
Crime - Thefts per 100,000 population (5 year average)
Crime - Auto thefts per 100,000 population (5 year average)
Crime - Arson per 100,000 population (5 year average)
Crime - City-data.com crime index (5 year average)
Crime - Violent crime index (5 year average)
Crime - Property crime index (5 year average)
1996 Presidential Elections Results (%) - Democratic Party (Clinton)
1996 Presidential Elections Results (%) - Republican Party (Dole)
1996 Presidential Elections Results (%) - Other
2000 Presidential Elections Results (%) - Democratic Party (Gore)
2000 Presidential Elections Results (%) - Republican Party (Bush)
2000 Presidential Elections Results (%) - Other
2004 Presidential Elections Results (%) - Democratic Party (Kerry)
2004 Presidential Elections Results (%) - Republican Party (Bush)
2004 Presidential Elections Results (%) - Other
2008 Presidential Elections Results (%) - Democratic Party (Obama)
2008 Presidential Elections Results (%) - Republican Party (McCain)
2008 Presidential Elections Results (%) - Other
2012 Presidential Elections Results (%) - Democratic Party (Obama)
2012 Presidential Elections Results (%) - Republican Party (Romney)
2012 Presidential Elections Results (%) - Other
2016 Presidential Elections Results (%) - Democratic Party (Clinton)
2016 Presidential Elections Results (%) - Republican Party (Trump)
2016 Presidential Elections Results (%) - Other
2020 Presidential Elections Results (%) - Democratic Party (Biden)
2020 Presidential Elections Results (%) - Republican Party (Trump)
2020 Presidential Elections Results (%) - Other
Ancestries Reported - Arab (%)
Ancestries Reported - Czech (%)
Ancestries Reported - Danish (%)
Ancestries Reported - Dutch (%)
Ancestries Reported - English (%)
Ancestries Reported - French (%)
Ancestries Reported - French Canadian (%)
Ancestries Reported - German (%)
Ancestries Reported - Greek (%)
Ancestries Reported - Hungarian (%)
Ancestries Reported - Irish (%)
Ancestries Reported - Italian (%)
Ancestries Reported - Lithuanian (%)
Ancestries Reported - Norwegian (%)
Ancestries Reported - Polish (%)
Ancestries Reported - Portuguese (%)
Ancestries Reported - Russian (%)
Ancestries Reported - Scotch-Irish (%)
Ancestries Reported - Scottish (%)
Ancestries Reported - Slovak (%)
Ancestries Reported - Subsaharan African (%)
Ancestries Reported - Swedish (%)
Ancestries Reported - Swiss (%)
Ancestries Reported - Ukrainian (%)
Ancestries Reported - United States (%)
Ancestries Reported - Welsh (%)
Ancestries Reported - West Indian (%)
Ancestries Reported - Other (%)
Educational Attainment - No schooling completed (%)
Educational Attainment - Less than high school (%)
Educational Attainment - High school or equivalent (%)
Educational Attainment - Less than 1 year of college (%)
Educational Attainment - 1 or more years of college (%)
Educational Attainment - Associate degree (%)
Educational Attainment - Bachelor's degree (%)
Educational Attainment - Master's degree (%)
Educational Attainment - Professional school degree (%)
Educational Attainment - Doctorate degree (%)
School Enrollment - Nursery, preschool (%)
School Enrollment - Kindergarten (%)
School Enrollment - Grade 1 to 4 (%)
School Enrollment - Grade 5 to 8 (%)
School Enrollment - Grade 9 to 12 (%)
School Enrollment - College undergrad (%)
School Enrollment - Graduate or professional (%)
School Enrollment - Not enrolled in school (%)
School enrollment - Public schools (%)
School enrollment - Private schools (%)
School enrollment - Not enrolled (%)
Median number of rooms in houses and condos
Median number of rooms in apartments
Housing units lacking complete plumbing facilities (%)
Housing units lacking complete kitchen facilities (%)
Density of houses
Urban houses (%)
Rural houses (%)
Households with people 60 years and over (%)
Households with people 65 years and over (%)
Households with people 75 years and over (%)
Households with one or more nonrelatives (%)
Households with no nonrelatives (%)
Population in households (%)
Family households (%)
Nonfamily households (%)
Population in families (%)
Family households with own children (%)
Median number of bedrooms in owner occupied houses
Mean number of bedrooms in owner occupied houses
Median number of bedrooms in renter occupied houses
Mean number of bedrooms in renter occupied houses
Median number of vehichles in owner occupied houses
Mean number of vehichles in owner occupied houses
Median number of vehichles in renter occupied houses
Mean number of vehichles in renter occupied houses
Mortgage status - with mortgage (%)
Mortgage status - with second mortgage (%)
Mortgage status - with home equity loan (%)
Mortgage status - with both second mortgage and home equity loan (%)
Mortgage status - without a mortgage (%)
Average family size
Average family size - White
Average family size - Black or African American
Average family size - Asian
Average family size - Hispanic or Latino
Average family size - American Indian and Alaska Native
Average family size - Multirace
Average family size - Other Race
Geographical mobility - Same house 1 year ago (%)
Geographical mobility - Moved within same county (%)
Geographical mobility - Moved from different county within same state (%)
Geographical mobility - Moved from different state (%)
Geographical mobility - Moved from abroad (%)
Place of birth - Born in state of residence (%)
Place of birth - Born in other state (%)
Place of birth - Native, outside of US (%)
Place of birth - Foreign born (%)
Housing units in structures - 1, detached (%)
Housing units in structures - 1, attached (%)
Housing units in structures - 2 (%)
Housing units in structures - 3 or 4 (%)
Housing units in structures - 5 to 9 (%)
Housing units in structures - 10 to 19 (%)
Housing units in structures - 20 to 49 (%)
Housing units in structures - 50 or more (%)
Housing units in structures - Mobile home (%)
Housing units in structures - Boat, RV, van, etc. (%)
House/condo owner moved in on average (years ago)
Renter moved in on average (years ago)
Year householder moved into unit - Moved in 1999 to March 2000 (%)
Year householder moved into unit - Moved in 1995 to 1998 (%)
Year householder moved into unit - Moved in 1990 to 1994 (%)
Year householder moved into unit - Moved in 1980 to 1989 (%)
Year householder moved into unit - Moved in 1970 to 1979 (%)
Year householder moved into unit - Moved in 1969 or earlier (%)
Means of transportation to work - Drove car alone (%)
Means of transportation to work - Carpooled (%)
Means of transportation to work - Public transportation (%)
Means of transportation to work - Bus or trolley bus (%)
Means of transportation to work - Streetcar or trolley car (%)
Means of transportation to work - Subway or elevated (%)
Means of transportation to work - Railroad (%)
Means of transportation to work - Ferryboat (%)
Means of transportation to work - Taxicab (%)
Means of transportation to work - Motorcycle (%)
Means of transportation to work - Bicycle (%)
Means of transportation to work - Walked (%)
Means of transportation to work - Other means (%)
Working at home (%)
Industry diversity
Most Common Industries - Agriculture, forestry, fishing and hunting, and mining (%)
Most Common Industries - Agriculture, forestry, fishing and hunting (%)
Most Common Industries - Mining, quarrying, and oil and gas extraction (%)
Most Common Industries - Construction (%)
Most Common Industries - Manufacturing (%)
Most Common Industries - Wholesale trade (%)
Most Common Industries - Retail trade (%)
Most Common Industries - Transportation and warehousing, and utilities (%)
Most Common Industries - Transportation and warehousing (%)
Most Common Industries - Utilities (%)
Most Common Industries - Information (%)
Most Common Industries - Finance and insurance, and real estate and rental and leasing (%)
Most Common Industries - Finance and insurance (%)
Most Common Industries - Real estate and rental and leasing (%)
Most Common Industries - Professional, scientific, and management, and administrative and waste management services (%)
Most Common Industries - Professional, scientific, and technical services (%)
Most Common Industries - Management of companies and enterprises (%)
Most Common Industries - Administrative and support and waste management services (%)
Most Common Industries - Educational services, and health care and social assistance (%)
Most Common Industries - Educational services (%)
Most Common Industries - Health care and social assistance (%)
Most Common Industries - Arts, entertainment, and recreation, and accommodation and food services (%)
Most Common Industries - Arts, entertainment, and recreation (%)
Most Common Industries - Accommodation and food services (%)
Most Common Industries - Other services, except public administration (%)
Most Common Industries - Public administration (%)
Occupation diversity
Most Common Occupations - Management, business, science, and arts occupations (%)
Most Common Occupations - Management, business, and financial occupations (%)
Most Common Occupations - Management occupations (%)
Most Common Occupations - Business and financial operations occupations (%)
Most Common Occupations - Computer, engineering, and science occupations (%)
Most Common Occupations - Computer and mathematical occupations (%)
Most Common Occupations - Architecture and engineering occupations (%)
Most Common Occupations - Life, physical, and social science occupations (%)
Most Common Occupations - Education, legal, community service, arts, and media occupations (%)
Most Common Occupations - Community and social service occupations (%)
Most Common Occupations - Legal occupations (%)
Most Common Occupations - Education, training, and library occupations (%)
Most Common Occupations - Arts, design, entertainment, sports, and media occupations (%)
Most Common Occupations - Healthcare practitioners and technical occupations (%)
Most Common Occupations - Health diagnosing and treating practitioners and other technical occupations (%)
Most Common Occupations - Health technologists and technicians (%)
Most Common Occupations - Service occupations (%)
Most Common Occupations - Healthcare support occupations (%)
Most Common Occupations - Protective service occupations (%)
Most Common Occupations - Fire fighting and prevention, and other protective service workers including supervisors (%)
Most Common Occupations - Law enforcement workers including supervisors (%)
Most Common Occupations - Food preparation and serving related occupations (%)
Most Common Occupations - Building and grounds cleaning and maintenance occupations (%)
Most Common Occupations - Personal care and service occupations (%)
Most Common Occupations - Sales and office occupations (%)
Most Common Occupations - Sales and related occupations (%)
Most Common Occupations - Office and administrative support occupations (%)
Most Common Occupations - Natural resources, construction, and maintenance occupations (%)
Most Common Occupations - Farming, fishing, and forestry occupations (%)
Most Common Occupations - Construction and extraction occupations (%)
Most Common Occupations - Installation, maintenance, and repair occupations (%)
Most Common Occupations - Production, transportation, and material moving occupations (%)
Most Common Occupations - Production occupations (%)
Most Common Occupations - Transportation occupations (%)
Most Common Occupations - Material moving occupations (%)
People in Group quarters - Institutionalized population (%)
People in Group quarters - Correctional institutions (%)
People in Group quarters - Federal prisons and detention centers (%)
People in Group quarters - Halfway houses (%)
People in Group quarters - Local jails and other confinement facilities (including police lockups) (%)
People in Group quarters - Military disciplinary barracks (%)
People in Group quarters - State prisons (%)
People in Group quarters - Other types of correctional institutions (%)
People in Group quarters - Nursing homes (%)
People in Group quarters - Hospitals/wards, hospices, and schools for the handicapped (%)
People in Group quarters - Hospitals/wards and hospices for chronically ill (%)
People in Group quarters - Hospices or homes for chronically ill (%)
People in Group quarters - Military hospitals or wards for chronically ill (%)
People in Group quarters - Other hospitals or wards for chronically ill (%)
People in Group quarters - Hospitals or wards for drug/alcohol abuse (%)
People in Group quarters - Mental (Psychiatric) hospitals or wards (%)
People in Group quarters - Schools, hospitals, or wards for the mentally retarded (%)
People in Group quarters - Schools, hospitals, or wards for the physically handicapped (%)
People in Group quarters - Institutions for the deaf (%)
People in Group quarters - Institutions for the blind (%)
People in Group quarters - Orthopedic wards and institutions for the physically handicapped (%)
People in Group quarters - Wards in general hospitals for patients who have no usual home elsewhere (%)
People in Group quarters - Wards in military hospitals for patients who have no usual home elsewhere (%)
People in Group quarters - Juvenile institutions (%)
People in Group quarters - Long-term care (%)
People in Group quarters - Homes for abused, dependent, and neglected children (%)
People in Group quarters - Residential treatment centers for emotionally disturbed children (%)
People in Group quarters - Training schools for juvenile delinquents (%)
People in Group quarters - Short-term care, detention or diagnostic centers for delinquent children (%)
People in Group quarters - Type of juvenile institution unknown (%)
People in Group quarters - Noninstitutionalized population (%)
People in Group quarters - College dormitories (includes college quarters off campus) (%)
People in Group quarters - Military quarters (%)
People in Group quarters - On base (%)
People in Group quarters - Barracks, unaccompanied personnel housing (UPH), (Enlisted/Officer), ;and similar group living quarters for military personnel (%)
People in Group quarters - Transient quarters for temporary residents (%)
People in Group quarters - Military ships (%)
People in Group quarters - Group homes (%)
People in Group quarters - Homes or halfway houses for drug/alcohol abuse (%)
People in Group quarters - Homes for the mentally ill (%)
People in Group quarters - Homes for the mentally retarded (%)
People in Group quarters - Homes for the physically handicapped (%)
People in Group quarters - Other group homes (%)
People in Group quarters - Religious group quarters (%)
People in Group quarters - Dormitories (%)
People in Group quarters - Agriculture workers' dormitories on farms (%)
People in Group quarters - Job Corps and vocational training facilities (%)
People in Group quarters - Other workers' dormitories (%)
People in Group quarters - Crews of maritime vessels (%)
People in Group quarters - Other nonhousehold living situations (%)
People in Group quarters - Other noninstitutional group quarters (%)
Residents speaking English at home (%)
Residents speaking English at home - Born in the United States (%)
Residents speaking English at home - Native, born elsewhere (%)
Residents speaking English at home - Foreign born (%)
Residents speaking Spanish at home (%)
Residents speaking Spanish at home - Born in the United States (%)
Residents speaking Spanish at home - Native, born elsewhere (%)
Residents speaking Spanish at home - Foreign born (%)
Residents speaking other language at home (%)
Residents speaking other language at home - Born in the United States (%)
Residents speaking other language at home - Native, born elsewhere (%)
Residents speaking other language at home - Foreign born (%)
Class of Workers - Employee of private company (%)
Class of Workers - Self-employed in own incorporated business (%)
Class of Workers - Private not-for-profit wage and salary workers (%)
Class of Workers - Local government workers (%)
Class of Workers - State government workers (%)
Class of Workers - Federal government workers (%)
Class of Workers - Self-employed workers in own not incorporated business and Unpaid family workers (%)
House heating fuel used in houses and condos - Utility gas (%)
House heating fuel used in houses and condos - Bottled, tank, or LP gas (%)
House heating fuel used in houses and condos - Electricity (%)
House heating fuel used in houses and condos - Fuel oil, kerosene, etc. (%)
House heating fuel used in houses and condos - Coal or coke (%)
House heating fuel used in houses and condos - Wood (%)
House heating fuel used in houses and condos - Solar energy (%)
House heating fuel used in houses and condos - Other fuel (%)
House heating fuel used in houses and condos - No fuel used (%)
House heating fuel used in apartments - Utility gas (%)
House heating fuel used in apartments - Bottled, tank, or LP gas (%)
House heating fuel used in apartments - Electricity (%)
House heating fuel used in apartments - Fuel oil, kerosene, etc. (%)
House heating fuel used in apartments - Coal or coke (%)
House heating fuel used in apartments - Wood (%)
House heating fuel used in apartments - Solar energy (%)
House heating fuel used in apartments - Other fuel (%)
House heating fuel used in apartments - No fuel used (%)
Armed forces status - In Armed Forces (%)
Armed forces status - Civilian (%)
Armed forces status - Civilian - Veteran (%)
Armed forces status - Civilian - Nonveteran (%)
Fatal accidents locations in years 2005-2021
Fatal accidents locations in 2005
Fatal accidents locations in 2006
Fatal accidents locations in 2007
Fatal accidents locations in 2008
Fatal accidents locations in 2009
Fatal accidents locations in 2010
Fatal accidents locations in 2011
Fatal accidents locations in 2012
Fatal accidents locations in 2013
Fatal accidents locations in 2014
Fatal accidents locations in 2015
Fatal accidents locations in 2016
Fatal accidents locations in 2017
Fatal accidents locations in 2018
Fatal accidents locations in 2019
Fatal accidents locations in 2020
Fatal accidents locations in 2021
Alcohol use - People drinking some alcohol every month (%)
Alcohol use - People not drinking at all (%)
Alcohol use - Average days/month drinking alcohol
Alcohol use - Average drinks/week
Alcohol use - Average days/year people drink much
Audiometry - Average condition of hearing (%)
Audiometry - People that can hear a whisper from across a quiet room (%)
Audiometry - People that can hear normal voice from across a quiet room (%)
Audiometry - Ears ringing, roaring, buzzing (%)
Audiometry - Had a job exposure to loud noise (%)
Audiometry - Had off-work exposure to loud noise (%)
Blood Pressure & Cholesterol - Has high blood pressure (%)
Blood Pressure & Cholesterol - Checking blood pressure at home (%)
Blood Pressure & Cholesterol - Frequently checking blood cholesterol (%)
Blood Pressure & Cholesterol - Has high cholesterol level (%)
Consumer Behavior - Money monthly spent on food at supermarket/grocery store
Consumer Behavior - Money monthly spent on food at other stores
Consumer Behavior - Money monthly spent on eating out
Consumer Behavior - Money monthly spent on carryout/delivered foods
Consumer Behavior - Income spent on food at supermarket/grocery store (%)
Consumer Behavior - Income spent on food at other stores (%)
Consumer Behavior - Income spent on eating out (%)
Consumer Behavior - Income spent on carryout/delivered foods (%)
Current Health Status - General health condition (%)
Current Health Status - Blood donors (%)
Current Health Status - Has blood ever tested for HIV virus (%)
Current Health Status - Left-handed people (%)
Dermatology - People using sunscreen (%)
Diabetes - Diabetics (%)
Diabetes - Had a blood test for high blood sugar (%)
Diabetes - People taking insulin (%)
Diet Behavior & Nutrition - Diet health (%)
Diet Behavior & Nutrition - Milk product consumption (# of products/month)
Diet Behavior & Nutrition - Meals not home prepared (#/week)
Diet Behavior & Nutrition - Meals from fast food or pizza place (#/week)
Diet Behavior & Nutrition - Ready-to-eat foods (#/month)
Diet Behavior & Nutrition - Frozen meals/pizza (#/month)
Drug Use - People that ever used marijuana or hashish (%)
Drug Use - Ever used hard drugs (%)
Drug Use - Ever used any form of cocaine (%)
Drug Use - Ever used heroin (%)
Drug Use - Ever used methamphetamine (%)
Health Insurance - People covered by health insurance (%)
Kidney Conditions-Urology - Avg. # of times urinating at night
Medical Conditions - People with asthma (%)
Medical Conditions - People with anemia (%)
Medical Conditions - People with psoriasis (%)
Medical Conditions - People with overweight (%)
Medical Conditions - Elderly people having difficulties in thinking or remembering (%)
Medical Conditions - People who ever received blood transfusion (%)
Medical Conditions - People having trouble seeing even with glass/contacts (%)
Medical Conditions - People with arthritis (%)
Medical Conditions - People with gout (%)
Medical Conditions - People with congestive heart failure (%)
Medical Conditions - People with coronary heart disease (%)
Medical Conditions - People with angina pectoris (%)
Medical Conditions - People who ever had heart attack (%)
Medical Conditions - People who ever had stroke (%)
Medical Conditions - People with emphysema (%)
Medical Conditions - People with thyroid problem (%)
Medical Conditions - People with chronic bronchitis (%)
Medical Conditions - People with any liver condition (%)
Medical Conditions - People who ever had cancer or malignancy (%)
Mental Health - People who have little interest in doing things (%)
Mental Health - People feeling down, depressed, or hopeless (%)
Mental Health - People who have trouble sleeping or sleeping too much (%)
Mental Health - People feeling tired or having little energy (%)
Mental Health - People with poor appetite or overeating (%)
Mental Health - People feeling bad about themself (%)
Mental Health - People who have trouble concentrating on things (%)
Mental Health - People moving or speaking slowly or too fast (%)
Mental Health - People having thoughts they would be better off dead (%)
Oral Health - Average years since last visit a dentist
Oral Health - People embarrassed because of mouth (%)
Oral Health - People with gum disease (%)
Oral Health - General health of teeth and gums (%)
Oral Health - Average days a week using dental floss/device
Oral Health - Average days a week using mouthwash for dental problem
Oral Health - Average number of teeth
Pesticide Use - Households using pesticides to control insects (%)
Pesticide Use - Households using pesticides to kill weeds (%)
Physical Activity - People doing vigorous-intensity work activities (%)
Physical Activity - People doing moderate-intensity work activities (%)
Physical Activity - People walking or bicycling (%)
Physical Activity - People doing vigorous-intensity recreational activities (%)
Physical Activity - People doing moderate-intensity recreational activities (%)
Physical Activity - Average hours a day doing sedentary activities
Physical Activity - Average hours a day watching TV or videos
Physical Activity - Average hours a day using computer
Physical Functioning - People having limitations keeping them from working (%)
Physical Functioning - People limited in amount of work they can do (%)
Physical Functioning - People that need special equipment to walk (%)
Physical Functioning - People experiencing confusion/memory problems (%)
Physical Functioning - People requiring special healthcare equipment (%)
Prescription Medications - Average number of prescription medicines taking
Preventive Aspirin Use - Adults 40+ taking low-dose aspirin (%)
Reproductive Health - Vaginal deliveries (%)
Reproductive Health - Cesarean deliveries (%)
Reproductive Health - Deliveries resulted in a live birth (%)
Reproductive Health - Pregnancies resulted in a delivery (%)
Reproductive Health - Women breastfeeding newborns (%)
Reproductive Health - Women that had a hysterectomy (%)
Reproductive Health - Women that had both ovaries removed (%)
Reproductive Health - Women that have ever taken birth control pills (%)
Reproductive Health - Women taking birth control pills (%)
Reproductive Health - Women that have ever used Depo-Provera or injectables (%)
Reproductive Health - Women that have ever used female hormones (%)
Sexual Behavior - People 18+ that ever had sex (vaginal, anal, or oral) (%)
Sexual Behavior - Males 18+ that ever had vaginal sex with a woman (%)
Sexual Behavior - Males 18+ that ever performed oral sex on a woman (%)
Sexual Behavior - Males 18+ that ever had anal sex with a woman (%)
Sexual Behavior - Males 18+ that ever had any sex with a man (%)
Sexual Behavior - Females 18+ that ever had vaginal sex with a man (%)
Sexual Behavior - Females 18+ that ever performed oral sex on a man (%)
Sexual Behavior - Females 18+ that ever had anal sex with a man (%)
Sexual Behavior - Females 18+ that ever had any kind of sex with a woman (%)
Sexual Behavior - Average age people first had sex
Sexual Behavior - Average number of female sex partners in lifetime (males 18+)
Sexual Behavior - Average number of female vaginal sex partners in lifetime (males 18+)
Sexual Behavior - Average age people first performed oral sex on a woman (18+)
Sexual Behavior - Average number of woman performed oral sex on in lifetime (18+)
Sexual Behavior - Average number of male sex partners in lifetime (males 18+)
Sexual Behavior - Average number of male anal sex partners in lifetime (males 18+)
Sexual Behavior - Average age people first performed oral sex on a man (18+)
Sexual Behavior - Average number of male oral sex partners in lifetime (18+)
Sexual Behavior - People using protection when performing oral sex (%)
Sexual Behavior - Average number of times people have vaginal or anal sex a year
Sexual Behavior - People having sex without condom (%)
Sexual Behavior - Average number of male sex partners in lifetime (females 18+)
Sexual Behavior - Average number of male vaginal sex partners in lifetime (females 18+)
Sexual Behavior - Average number of female sex partners in lifetime (females 18+)
Sexual Behavior - Circumcised males 18+ (%)
Sleep Disorders - Average hours sleeping at night
Sleep Disorders - People that has trouble sleeping (%)
Smoking-Cigarette Use - People smoking cigarettes (%)
Taste & Smell - People 40+ having problems with smell (%)
Taste & Smell - People 40+ having problems with taste (%)
Taste & Smell - People 40+ that ever had wisdom teeth removed (%)
Taste & Smell - People 40+ that ever had tonsils teeth removed (%)
Taste & Smell - People 40+ that ever had a loss of consciousness because of a head injury (%)
Taste & Smell - People 40+ that ever had a broken nose or other serious injury to face or skull (%)
Taste & Smell - People 40+ that ever had two or more sinus infections (%)
Weight - Average height (inches)
Weight - Average weight (pounds)
Weight - Average BMI
Weight - People that are obese (%)
Weight - People that ever were obese (%)
Weight - People trying to lose weight (%)
Urban population: 9,392
Rural population: 4,420
Estimated median house/condo value in 2022: $154,439
44875:
$154,439Ohio:
$204,100
According to our research of Ohio and other state lists, there were 25 registered sex offenders living in 44875 zip code as of April 25, 2024 . The ratio of all residents to sex offenders in zip code 44875 is 543 to 1.The ratio of registered sex offenders to all residents in this zip code is near the state average.
Median resident age: This zip code:
42.2 yearsOhio median age:
39.9 years
Average household size: This zip code:
2.4 peopleOhio:
2.4 people
Averages for the 2020 tax year for zip code 44875, filed in 2021:
Average Adjusted Gross Income (AGI) in 2020: $48,888 (Individual Income Tax Returns) Here:
$48,888State:
$67,288
Salary/wage: $42,888 (reported on 79.6% of returns )Here:
$42,888State:
$55,628
(% of AGI for various income ranges: 1083.0% for AGIs below $25k , 3348.1% for AGIs $25k-50k , 5871.2% for AGIs $50k-75k , 8784.1% for AGIs $75k-100k , 14666.9% for AGIs $100k-200k ) Taxable interest for individuals: $989 (reported on 22.7% of returns )This zip code:
$989Ohio:
$1,518
(% of AGI for various income ranges: 15.7% for AGIs below $25k , 17.3% for AGIs $25k-50k , 29.5% for AGIs $50k-75k , 47.7% for AGIs $75k-100k , 86.4% for AGIs $100k-200k ) Ordinary dividends: $3,555 (reported on 16.0% of returns )(% of AGI for various income ranges: 21.8% for AGIs below $25k , 30.5% for AGIs $25k-50k , 82.9% for AGIs $50k-75k , 145.2% for AGIs $75k-100k , 295.9% for AGIs $100k-200k ) Net capital gain/loss in AGI: +$6,023 (reported on 14.7% of returns )Here:
+$6,023State:
+$18,919
(% of AGI for various income ranges: 7.3% for AGIs below $25k , 23.5% for AGIs $25k-50k , 59.5% for AGIs $50k-75k , 206.4% for AGIs $75k-100k , 597.9% for AGIs $100k-200k ) Profit/loss from business: +$14,415 (reported on 10.1% of returns )Here:
+$14,415State:
+$13,744
(% of AGI for various income ranges: 71.4% for AGIs below $25k , 57.5% for AGIs $25k-50k , 155.7% for AGIs $50k-75k , 323.0% for AGIs $75k-100k , 503.1% for AGIs $100k-200k ) Taxable individual retirement arrangement distribution: $12,592 (reported on 11.3% of returns )44875:
$12,592Ohio:
$18,876
(% of AGI for various income ranges: 89.5% for AGIs below $25k , 120.1% for AGIs $25k-50k , 230.0% for AGIs $50k-75k , 345.0% for AGIs $75k-100k , 652.3% for AGIs $100k-200k ) Total itemized deductions: $27,225 (reported on 2.4% of returns )Here:
$27,225State:
$33,869
(% of AGI for various income ranges: 57.6% for AGIs below $25k , 78.0% for AGIs $50k-75k , 147.0% for AGIs $75k-100k , 523.6% for AGIs $100k-200k ) Charity contributions: $11,736 (reported on 1.6% of returns )Here:
$11,736State:
$14,577
(% of AGI for various income ranges: 14.5% for AGIs $25k-50k , 43.6% for AGIs $75k-100k , 220.5% for AGIs $100k-200k ) Taxes paid: $5,567 (reported on 2.2% of returns )(% of AGI for various income ranges: 2.7% for AGIs below $25k , 14.1% for AGIs $50k-75k , 34.8% for AGIs $75k-100k , 132.1% for AGIs $100k-200k ) Earned income credit: $2,249 (reported on 15.1% of returns )(% of AGI for various income ranges: 77.1% for AGIs below $25k , 57.0% for AGIs $25k-50k , 2.3% for AGIs $50k-75k ) Percentage of individuals using paid preparers for their 2020 taxes: 96.9%(% for various income ranges: 96.5% for AGIs below $25k , 97.5% for AGIs $25k-50k , 97.3% for AGIs $50k-75k , 95.1% for AGIs $75k-100k , 98.4% for AGIs $100k-200k , 85.7% for AGIs over 200k )
Averages for the 2012 tax year for zip code 44875, filed in 2013:
Average Adjusted Gross Income (AGI) in 2012: $41,822 (Individual Income Tax Returns) Here:
$41,822State:
$54,926
Salary/wage: $37,248 (reported on 82.3% of returns )Here:
$37,248State:
$45,869
(% of AGI for various income ranges: 69.2% for AGIs below $25k , 76.4% for AGIs $25k-50k , 75.7% for AGIs $50k-75k , 78.0% for AGIs $75k-100k , 72.5% for AGIs $100k-200k , 46.5% for AGIs over 200k ) Taxable interest for individuals: $1,213 (reported on 28.1% of returns )This zip code:
$1,213Ohio:
$1,297
(% of AGI for various income ranges: 1.5% for AGIs below $25k , 0.7% for AGIs $25k-50k , 0.8% for AGIs $50k-75k , 0.4% for AGIs $75k-100k , 1.2% for AGIs $100k-200k , 0.3% for AGIs over 200k ) Ordinary dividends: $2,759 (reported on 17.7% of returns )(% of AGI for various income ranges: 1.2% for AGIs below $25k , 0.9% for AGIs $25k-50k , 1.2% for AGIs $50k-75k , 1.0% for AGIs $75k-100k , 1.4% for AGIs $100k-200k , 2.1% for AGIs over 200k ) Net capital gain/loss in AGI: +$5,255 (reported on 12.2% of returns )Here:
+$5,255State:
+$11,232
(% of AGI for various income ranges: 0.2% for AGIs $25k-50k , 0.4% for AGIs $50k-75k , 1.0% for AGIs $75k-100k , 2.3% for AGIs $100k-200k , 15.0% for AGIs over 200k ) Profit/loss from business: +$7,833 (reported on 10.7% of returns )Here:
+$7,833State:
+$12,773
(% of AGI for various income ranges: 4.6% for AGIs below $25k , 1.5% for AGIs $25k-50k , 1.8% for AGIs $50k-75k , 1.7% for AGIs $75k-100k , 2.2% for AGIs $100k-200k ) Taxable individual retirement arrangement distribution: $10,300 (reported on 11.6% of returns )44875:
$10,300Ohio:
$14,511
(% of AGI for various income ranges: 4.1% for AGIs below $25k , 2.6% for AGIs $25k-50k , 2.9% for AGIs $50k-75k , 3.0% for AGIs $75k-100k , 3.0% for AGIs $100k-200k ) Total itemized deductions: $15,963 (20% of AGI, reported on 20.5% of returns )Here:
$15,963State:
$21,278
Here:
20.5% of AGIState:
18.8% of AGI
(% of AGI for various income ranges: 4.7% for AGIs below $25k , 6.0% for AGIs $25k-50k , 7.7% for AGIs $50k-75k , 8.6% for AGIs $75k-100k , 10.7% for AGIs $100k-200k , 11.7% for AGIs over 200k ) Charity contributions: $3,837 (reported on 13.9% of returns )(% of AGI for various income ranges: 0.5% for AGIs below $25k , 0.7% for AGIs $25k-50k , 1.1% for AGIs $50k-75k , 1.5% for AGIs $75k-100k , 2.3% for AGIs $100k-200k , 2.6% for AGIs over 200k ) Taxes paid: $5,940 (reported on 20.5% of returns )(% of AGI for various income ranges: 0.6% for AGIs below $25k , 1.5% for AGIs $25k-50k , 2.7% for AGIs $50k-75k , 3.4% for AGIs $75k-100k , 5.2% for AGIs $100k-200k , 6.7% for AGIs over 200k ) Earned income credit: $2,277 (reported on 17.1% of returns )(% of AGI for various income ranges: 5.6% for AGIs below $25k , 1.0% for AGIs $25k-50k ) Percentage of individuals using paid preparers for their 2012 taxes: 60.1%(% for various income ranges: 54.3% for AGIs below $25k , 61.4% for AGIs $25k-50k , 65.3% for AGIs $50k-75k , 64.9% for AGIs $75k-100k , 68.4% for AGIs $100k-200k , 100.0% for AGIs over 200k )
Averages for the 2004 tax year for zip code 44875, filed in 2005:
Average Adjusted Gross Income (AGI) in 2004: $36,533 (Individual Income Tax Returns) Here:
$36,533State:
$44,480
Salary/wage: $33,596 (reported on 84.4% of returns )Here:
$33,596State:
$39,198
(% of AGI for various income ranges: 100.7% for AGIs below $10k , 70.7% for AGIs $10k-25k , 81.6% for AGIs $25k-50k , 83.1% for AGIs $50k-75k , 80.9% for AGIs $75k-100k , 62.0% for AGIs over 100k ) Taxable interest for individuals: $1,165 (reported on 45.1% of returns )This zip code:
$1,165Ohio:
$1,532
(% of AGI for various income ranges: 8.3% for AGIs below $10k , 2.6% for AGIs $10k-25k , 1.2% for AGIs $25k-50k , 1.2% for AGIs $50k-75k , 0.7% for AGIs $75k-100k , 1.2% for AGIs over 100k ) Taxable dividends: $1,964 (reported on 23.6% of returns )(% of AGI for various income ranges: 3.3% for AGIs below $10k , 1.4% for AGIs $10k-25k , 0.9% for AGIs $25k-50k , 1.0% for AGIs $50k-75k , 1.1% for AGIs $75k-100k , 2.1% for AGIs over 100k ) Net capital gain/loss: +$5,610 (reported on 17.3% of returns )Here:
+$5,610State:
+$8,582
(% of AGI for various income ranges: -2.7% for AGIs below $10k , 0.6% for AGIs $10k-25k , 0.7% for AGIs $25k-50k , 0.8% for AGIs $50k-75k , 2.4% for AGIs $75k-100k , 11.4% for AGIs over 100k ) Profit/loss from business: +$8,544 (reported on 11.4% of returns )Here:
+$8,544State:
+$10,813
(% of AGI for various income ranges: 4.6% for AGIs below $10k , 3.0% for AGIs $10k-25k , 2.3% for AGIs $25k-50k , 2.1% for AGIs $50k-75k , 2.8% for AGIs $75k-100k , 3.7% for AGIs over 100k ) Profit/loss from farming: +$1,605 (reported on 2.3% of returns )
Here : State :
(% of AGI for various income ranges: -3.9% for AGIs below $10k , -0.4% for AGIs $10k-25k , 0.1% for AGIs $25k-50k , 0.1% for AGIs $50k-75k , 1.2% for AGIs $75k-100k ) IRA payment deduction: $2,739 (reported on 1.9% of returns )(% of AGI for various income ranges: 0.2% for AGIs $10k-25k , 0.2% for AGIs $25k-50k , 0.1% for AGIs $50k-75k , 0.1% for AGIs $75k-100k , 0.1% for AGIs over 100k ) Self-employed pension: $9,952 (reported on 0.3% of returns )Total itemized deductions: $13,119 (20% of AGI, reported on 24.8% of returns )Here:
$13,119State:
$17,503
Here:
20.0% of AGIState:
20.8% of AGI
(% of AGI for various income ranges: 8.2% for AGIs below $10k , 5.9% for AGIs $10k-25k , 7.5% for AGIs $25k-50k , 9.5% for AGIs $50k-75k , 10.8% for AGIs $75k-100k , 11.0% for AGIs over 100k ) Charity contributions deductions: $2,700 (4% of AGI, reported on 18.8% of returns )Here:
3.8% of AGIState:
3.4% of AGI
(% of AGI for various income ranges: 0.2% for AGIs below $10k , 0.6% for AGIs $10k-25k , 1.1% for AGIs $25k-50k , 1.4% for AGIs $50k-75k , 1.8% for AGIs $75k-100k , 2.4% for AGIs over 100k ) Total tax: $4,521 (reported on 75.1% of returns )(% of AGI for various income ranges: 2.3% for AGIs below $10k , 3.9% for AGIs $10k-25k , 6.9% for AGIs $25k-50k , 8.9% for AGIs $50k-75k , 10.8% for AGIs $75k-100k , 17.6% for AGIs over 100k ) Earned income credit: $1,568 (reported on 12.6% of returns )Percentage of individuals using paid preparers for their 2004 taxes: 62.2%(% for various income ranges: 50.5% for AGIs below $10k , 64.6% for AGIs $10k-25k , 66.7% for AGIs $25k-50k , 61.1% for AGIs $50k-75k , 64.0% for AGIs $75k-100k , 74.8% for AGIs over 100k )
Estimated median household income in 2022: This zip code:
$61,145Ohio:
$65,720
Nearest zip codes: 44865 ,
44827 ,
44878 ,
44887 ,
44906 ,
44850 .
Percentage of family households: This zip code:
45.6%Ohio:
43.3%
Percentage of households with unmarried partners: This zip code:
9.0%Ohio:
44.6%
No gay or lesbian households reported
Household received Food Stamps/SNAP in the past 12 months: 612Household did not receive Food Stamps/SNAP in the past 12 months: 5,028
Women who had a birth in the past 12 months: 81 (53 now married , 28 unmarried) Women who did not have a birth in the past 12 months: 2,305 (1,352 now married , 951 unmarried)
Housing units in zip code 44875 with a mortgage: 2,475 (420
second mortgage , 397
both second mortgage and home equity loan )
Houses without a mortgage: 337
Median monthly owner costs for units with a mortgage: $1,114
Median monthly owner costs for units without a mortgage: $426
Residents with income below the poverty level in 2022:
This zip code:
12.4%Whole state:
13.4%
Residents with income below 50% of the poverty level in 2022:
This zip code:
6.4%Whole state:
7.0%
Median number of rooms in houses and condos: Median number of rooms in apartments: Notable locations in this zip code not listed on our city pages
Click to draw/clear zip code borders Notable locations in zip code 44875: (A) , Central Ohio Industrial Park (B) , Shelby Junction (C) , Fry Farm (D) , Cherwood Farms (E) , Medic Response Ambulance Service (F) , Shelby Fire Department (G) . Display/hide their locations on the map
Churches in zip code 44875 include: (A) , Saint Peters Church (B) , Sacred Heart of Jesus Church (C) , First Christian Church (D) , First Lutheran Church (E) , First United Church of Christ (F) , First United Presbyterian Church (G) , Most Pure Heart of Mary Catholic Church (H) , Saint Marks Episcopal Church (I) . Display/hide their locations on the map
Cemeteries: (1) , Hazel Brush Cemetery (2) , Coltman Cemetery (3) , Ganges Cemetery (4) , Mount Bethel Cemetery (5) , Bethlehem Cemetery (6) , Dunkard Cemetery (7) . Display/hide their locations on the map
Reservoirs: (A) , Shelby Upground Reservoir Number Two (B) , Cooke Pond Number One (C) , Cooke Pond Number Two (D) . Display/hide their locations on the map
Streams, rivers, and creeks: (A) , Marsh Run (B) , Bear Run (C) . Display/hide their locations on the map
Parks in zip code 44875 include: (1) , Seltzer Park (2) , McBride Park (3) . Display/hide their locations on the map
Year house built (houses)
0 2020 or later193 2010 to 2019374 2000 to 2009480 1990 to 1999285 1980 to 1989807 1970 to 1979713 1960 to 19691,154 1950 to 1959484 1940 to 19491,490 1939 or earlier
Zip code 44875 household income distribution in 2022 390 Less than $10,000335 $10,000 to $14,999227 $15,000 to $19,999138 $20,000 to $24,999266 $25,000 to $29,999220 $30,000 to $34,999243 $35,000 to $39,999216 $40,000 to $44,999243 $45,000 to $49,999438 $50,000 to $59,999722 $60,000 to $74,999732 $75,000 to $99,999857 $100,000 to $124,999296 $125,000 to $149,999248 $150,000 to $199,99967 $200,000 or moreEstimate of home value of owner-occupied houses/condos in 2022 in zip code 44875 48 Less than $10,00017 $10,000 to $14,99926 $15,000 to $19,99928 $20,000 to $24,9994 $25,000 to $29,99913 $30,000 to $34,99940 $40,000 to $49,99998 $50,000 to $59,999206 $60,000 to $69,999178 $70,000 to $79,999173 $80,000 to $89,999151 $90,000 to $99,999556 $100,000 to $124,999507 $125,000 to $149,999537 $150,000 to $174,999358 $175,000 to $199,999442 $200,000 to $249,999200 $250,000 to $299,999159 $300,000 to $399,99974 $400,000 to $499,99932 $500,000 to $749,99913 $750,000 to $999,999Rent paid by renters in 2022 in zip code 44875 16 Less than $10058 $150 to $1998 $200 to $24977 $300 to $34999 $350 to $39999 $400 to $449122 $450 to $499221 $500 to $549151 $550 to $599138 $600 to $649181 $650 to $69953 $700 to $74914 $750 to $79947 $800 to $89929 $1,000 to $1,249118 No cash rent
Median gross rent in 2022: $729.
Median price asked for vacant for-sale houses and condos in 2022: $272,960.
Estimated median house (or condo) value in 2022 for: White Non-Hispanic householders: $152,512Black or African American householders: $56,907American Indian or Alaska Native householders: $48,152Asian householders: $284,538Native Hawaiian and other Pacific Islander householders: $17,508Two or more races householders: $163,369Hispanic or Latino householders: $159,867Estimated median house or condo value in 2022: $154,439
44875:
$154,439Ohio:
$204,100
Lower value quartile - upper value quartile: $103,778 - $211,686
Mean price in 2022: Detached houses: $148,216Here:
$148,216State:
$254,366
Townhouses or other attached units: $1,749,702Here:
$1,749,702State:
$225,733
In 2-unit structures: $113,646Here:
$113,646State:
$144,384
Mobile homes: $25,266Here:
$25,266State:
$62,719
Housing units in structures:
One, detached: 4,900One, attached: 92Two: 2783 or 4: 2615 to 9: 26510 to 19: 57Mobile homes: 176Unemployment : 2.8%
Means of transportation to work in zip code 44875 83.1% 4,835 Drove a car alone6.9% 402 Carpooled0.4% 22 Bus or trolley bus0.3% 17 Bicycle0.7% 42 Walked0.2% 11 Other means6.4% 371 Worked at homeTravel time to work (commute) in zip code 44875 319 Less than 5 minutes661 5 to 9 minutes635 10 to 14 minutes964 15 to 19 minutes1,047 20 to 24 minutes544 25 to 29 minutes692 30 to 34 minutes87 35 to 39 minutes70 40 to 44 minutes119 45 to 59 minutes108 60 to 89 minutes89 90 or more minutes
Percentage of zip code residents living and working in this county: 81.1%
Household type by relationship:
Households: 13,813
Male householders: 2,925 (679 living alone ), Female householders: 2,715 (1,095 living alone )2,974 spouses (2,974 opposite-sex spouses ), 258 unmarried partners , (249 opposite-sex unmarried partners ), 3,644 children (3,427 natural , 60 adopted , 156 stepchildren ), 213 grandchildren , 83 brothers or sisters , 60 parents , 195 foster children , 143 other relatives , 359 non-relatives In group quarters: 238 (-1 institutionalized population )
Size of family households: 1,751 2-persons , 887 3-persons , 530 4-persons , 221 5-persons , 136 6-persons , 68 7-or-more-persons
Size of nonfamily households: 1,776 1-person , 201 2-persons , 24 4-persons , 56 5-persons
2,447 married couples with children. single-parent households (235 men , 262 women ).
96.6% of residents of 44875 zip code speak English at home. of residents speak Spanish at home (72% very well, 28% well ).of residents speak other Indo-European language at home (92% very well, 6% well, 3% not well ).
Foreign born population: 125 (0.9%)
(82.2%
of them are naturalized citizens )
This zip code:
0.9%Whole state:
5.0%
31% Colombia 23% Sweden 17% Honduras 16% England 16% France 7% Romania 5% North Macedonia (Macedonia) 42% German 18% American 12% English 4% Irish 3% European 1% Dutch 1% Polish
Year of entry for the foreign-born population
27 2010 or later 11 2000 to 2009 18 1990 to 1999 121 Before 1990
Facilities with environmental interests located in this zip code:
AMF BOWLING PRODUCTS GROUP (151 MARTIN DRIVE in SHELBY, OH)
STATE MASTER (Ohio general info) - PCS-OH0079383, National Pollutant Discharge Elimination System Permit, RCRA-OHD004216495, HAZARDOUS WASTE PROGRAM (Resource Conservation and Recovery Act (tracking hazardous waste)) Alternative names: A M F BOWLING PRODUCTS, AMF INC AMF BOWLING PRODUCTS GROUP
AMERICAN MUNICIPAL POWER OH SHELBY N GENERATING ST (3626 LONDON W RD in SHELBY, OH)
AIR PROGRAM (Clean Air Markets Division Business System) STATE MASTER (Ohio general info) - AIR MAJOR Organizations: AMERICAN MUNICIPAL POWER OF OH (CONTACT/OWNER)
, CITY OF SHELBY, OH (OWNER/OPERATOR)
Alternative names: AMERICAN MUNICIPAL POWER OH SHELBY N GENERATING STA, AMP-OHIO SHELBY NORTH
AUBURN ELEMENTARY SCHOOL (109 AUBURN AVE in SHELBY, OH)
(Geographic Names Information System) (National Center for Education Statistics) - STATE ID-001222 Organizations: SHELBY CITY SD (SCHOOL DISTRICT)
BILLS SUNOCO (31 S MANSFIELD RD in SHELBY, OH)
STATE MASTER (Ohio general info) - EPCRA, RCRA-OHD000667857, HAZARDOUS WASTE PROGRAM Conditionally Exempt Small Quantity Generators, less than 100 kg/month of hazardous waste (Resource Conservation and Recovery Act (tracking hazardous waste)) - notification Organizations: BILL ZEHNER (CONTACT/OWNER)
Alternative names: BILL'S SUNOCO STATION
CENTRAL ELEMENTARY SCHOOL (25 HIGH SCHOOL AVE in SHELBY, OH)
(Geographic Names Information System) (National Center for Education Statistics) - STATE ID-005546 Organizations: SHELBY CITY SD (SCHOOL DISTRICT)
ALLTEL - SHELBY (2976 MEYERS ROAD in SHELBY, OH)
(Integrated Compliance Information System) - ICIS-HQ-2000-6004, FORMAL ENFORCEMENT ACTION
BLOOM AND JOHNSON BODY SHOP (86 E MAIN ST in SHELBY, OH)
Small Quantity Generators, between 100 kg and 1000 kg of hazardous waste/month (Resource Conservation and Recovery Act (tracking hazardous waste)) - notification Organizations: LEE FAULKNER (CONTACT/OWNER)
CENTRAL RECONDITIONING (ST RTE 61 N in SHELBY, OH)
Small Quantity Generators, between 100 kg and 1000 kg of hazardous waste/month (Resource Conservation and Recovery Act (tracking hazardous waste)) - notification Organizations: DEBIEW EARL (CONTACT/OWNER)
Housing units lacking complete plumbing facilities: 0.9%
Housing units lacking complete kitchen facilities: 0.2%
59.4% Utility gas 18.2% Electricity 14.4% Bottled, tank, or LP gas 3.9% Wood 3.5% Fuel oil, kerosene, etc. 0.6% No fuel used
Population in 1990: 14,736. Population change in the 1990s: +146 (+1.0%).
Place of birth for U.S.-born residents:
This state: 11,488Northeast: 281Midwest: 429South: 1,026West: 374
60% of the 44875 zip code residents lived in the same house 5 years ago.
Out of people who lived in different houses, 69% lived in this county.
Out of people who lived in different counties, 50% lived in Ohio.
92% of the 44875 zip code residents lived in the same house 1 year ago.
Out of people who lived in different houses, 48% moved from this county.
Out of people who lived in different houses, 25% moved from different county within same state.
Out of people who lived in different houses, 30% moved from different state.
Private vs. public school enrollment:
Students in private schools in grades 1 to 8 (elementary and middle school): 231
Students in private schools in grades 9 to 12 (high school): 38
Students in private undergraduate colleges: 23
Occupation by median earnings in the past 12 months ($)
81,192 Management occupations 68,546 Construction and extraction occupations 64,382 Computer and mathematical occupations 55,899 Education, training, and library occupations 55,225 Architecture and engineering occupations 52,727 Business and financial operations occupations
Top industries in this zip code by the number of employees in 2005:
Health Care and Social Assistance: Nursing Care Facilities (100-249 employees: 1 establishment, 50-99 employees: 1 establishment, 5-9 employees: 1 establishment, 1-4 employees: 1 establishment)Accommodation and Food Services: Limited-Service Restaurants (20-49: 6, 5-9: 1, 1-4: 1)Wholesale Trade: Fresh Fruit and Vegetable Merchant Wholesalers (100-249: 1)Health Care and Social Assistance: General Medical and Surgical Hospitals (100-249: 1)Finance and Insurance: Commercial Banking (50-99: 1, 20-49: 1, 10-19: 1, 5-9: 5, 1-4: 3)Accommodation and Food Services: Full-Service Restaurants (50-99: 1, 20-49: 1, 10-19: 1, 5-9: 2, 1-4: 2)Other Services (except Public Administration): Religious Organizations (20-49: 2, 10-19: 2, 5-9: 4, 1-4: 6)
People in group quarters in 2010:
163 people in nursing facilities/skilled-nursing facilities
62 people in residential treatment centers for juveniles (non-correctional)
People in group quarters in 2000:
212 people in other types of correctional institutions
152 people in nursing homes
92 people in other noninstitutional group quarters
2 people in local jails and other confinement facilities (including police lockups)
Fatal accident statistics in 2014:
Fatal accident count: 2Vehicles involved in fatal accidents: 4Fatal accidents caused by drunken drivers: 0Fatalities: 2Persons involved in fatal accidents: 4Pedestrians involved in fatal accidents: 0
Fatal accident statistics in 2013:
Fatal accident count: 1Vehicles involved in fatal accidents: 2Fatal accidents caused by drunken drivers: 0Fatalities: 1Persons involved in fatal accidents: 2Pedestrians involved in fatal accidents: 0
Home Mortgage Disclosure Act Aggregated Statistics For Year 2009(Based on 1 full and 6 partial tracts) A) FHA, FSA/RHS & VA B) Conventional C) Refinancings D) Home Improvement Loans E) Loans on Dwellings For 5+ Families F) Non-occupant Loans on G) Loans On Manufactured Number Average Value Number Average Value Number Average Value Number Average Value Number Average Value Number Average Value Number Average Value
LOANS ORIGINATED 54 $85,964 74 $80,899 277 $100,150 30 $30,606 0 $0 31 $45,910 6 $73,128 APPLICATIONS APPROVED, NOT ACCEPTED 1 $249,540 8 $94,431 34 $110,311 3 $39,527 0 $0 0 $0 1 $72,820 APPLICATIONS DENIED 15 $75,101 15 $78,773 129 $102,835 24 $27,638 4 $125,730 7 $57,744 4 $49,278 APPLICATIONS WITHDRAWN 7 $66,510 3 $110,050 38 $112,448 3 $39,823 0 $0 0 $0 1 $68,270 FILES CLOSED FOR INCOMPLETENESS 4 $53,035 2 $36,570 11 $108,768 5 $60,504 0 $0 1 $45,510 1 $27,620
Aggregated Statistics For Year 2008(Based on 1 full and 6 partial tracts) A) FHA, FSA/RHS & VA B) Conventional C) Refinancings D) Home Improvement Loans F) Non-occupant Loans on G) Loans On Manufactured Number Average Value Number Average Value Number Average Value Number Average Value Number Average Value Number Average Value
LOANS ORIGINATED 72 $79,192 111 $90,402 174 $91,422 78 $38,188 28 $101,591 5 $18,318 APPLICATIONS APPROVED, NOT ACCEPTED 3 $97,157 13 $62,484 26 $110,816 11 $42,586 2 $131,000 0 $0 APPLICATIONS DENIED 17 $80,085 33 $68,736 204 $102,242 48 $37,019 22 $73,786 5 $40,526 APPLICATIONS WITHDRAWN 4 $66,475 19 $74,769 65 $103,198 3 $17,643 5 $56,650 2 $70,545 FILES CLOSED FOR INCOMPLETENESS 1 $80,780 2 $75,600 17 $112,022 3 $29,523 0 $0 0 $0
Aggregated Statistics For Year 2007(Based on 1 full and 6 partial tracts) A) FHA, FSA/RHS & VA B) Conventional C) Refinancings D) Home Improvement Loans E) Loans on Dwellings For 5+ Families F) Non-occupant Loans on G) Loans On Manufactured Number Average Value Number Average Value Number Average Value Number Average Value Number Average Value Number Average Value Number Average Value
LOANS ORIGINATED 20 $102,670 223 $86,255 260 $87,433 106 $32,253 0 $0 63 $61,781 13 $43,835 APPLICATIONS APPROVED, NOT ACCEPTED 1 $66,000 30 $125,036 46 $111,880 13 $22,508 2 $251,460 9 $118,922 2 $40,515 APPLICATIONS DENIED 6 $83,708 94 $87,730 325 $93,077 95 $49,318 3 $177,603 35 $80,248 11 $40,778 APPLICATIONS WITHDRAWN 1 $86,470 18 $134,280 96 $97,338 16 $34,404 0 $0 7 $77,363 1 $34,990 FILES CLOSED FOR INCOMPLETENESS 1 $88,000 5 $135,872 22 $91,980 1 $10,000 0 $0 3 $113,503 0 $0
Aggregated Statistics For Year 2006(Based on 1 full and 6 partial tracts) A) FHA, FSA/RHS & VA B) Conventional C) Refinancings D) Home Improvement Loans F) Non-occupant Loans on G) Loans On Manufactured Number Average Value Number Average Value Number Average Value Number Average Value Number Average Value Number Average Value
LOANS ORIGINATED 41 $95,059 342 $82,075 322 $92,792 124 $31,331 64 $80,621 12 $70,957 APPLICATIONS APPROVED, NOT ACCEPTED 5 $76,730 32 $89,057 71 $97,366 9 $20,984 12 $62,768 2 $24,310 APPLICATIONS DENIED 2 $78,960 109 $69,132 326 $97,148 87 $33,491 24 $43,449 8 $37,092 APPLICATIONS WITHDRAWN 2 $23,725 41 $84,507 137 $106,471 19 $80,134 8 $58,159 0 $0 FILES CLOSED FOR INCOMPLETENESS 4 $62,628 12 $74,628 53 $117,804 1 $29,000 0 $0 0 $0
Aggregated Statistics For Year 2005(Based on 1 full and 6 partial tracts) A) FHA, FSA/RHS & VA B) Conventional C) Refinancings D) Home Improvement Loans E) Loans on Dwellings For 5+ Families F) Non-occupant Loans on G) Loans On Manufactured Number Average Value Number Average Value Number Average Value Number Average Value Number Average Value Number Average Value Number Average Value
LOANS ORIGINATED 45 $95,320 304 $87,042 437 $96,807 108 $34,533 0 $0 65 $91,094 6 $54,097 APPLICATIONS APPROVED, NOT ACCEPTED 3 $109,333 28 $89,430 100 $88,123 20 $37,070 0 $0 5 $46,340 4 $44,880 APPLICATIONS DENIED 4 $70,700 88 $79,929 346 $100,057 59 $36,096 0 $0 21 $78,778 9 $50,424 APPLICATIONS WITHDRAWN 4 $70,612 33 $93,892 198 $109,801 34 $112,941 2 $186,445 17 $98,124 0 $0 FILES CLOSED FOR INCOMPLETENESS 2 $91,095 17 $151,558 60 $111,619 0 $0 0 $0 4 $42,700 0 $0
Aggregated Statistics For Year 2004(Based on 1 full and 6 partial tracts) A) FHA, FSA/RHS & VA B) Conventional C) Refinancings D) Home Improvement Loans E) Loans on Dwellings For 5+ Families F) Non-occupant Loans on G) Loans On Manufactured Number Average Value Number Average Value Number Average Value Number Average Value Number Average Value Number Average Value Number Average Value
LOANS ORIGINATED 33 $92,674 276 $90,601 479 $93,686 113 $28,121 3 $63,500 59 $66,847 7 $69,783 APPLICATIONS APPROVED, NOT ACCEPTED 0 $0 32 $95,377 94 $100,010 7 $41,284 0 $0 2 $224,805 3 $35,013 APPLICATIONS DENIED 5 $140,632 79 $73,738 323 $95,258 80 $26,776 0 $0 15 $65,190 21 $51,170 APPLICATIONS WITHDRAWN 5 $98,104 25 $101,874 248 $92,330 14 $46,532 0 $0 14 $58,553 0 $0 FILES CLOSED FOR INCOMPLETENESS 2 $62,135 10 $179,451 39 $104,129 6 $35,697 0 $0 3 $85,133 2 $82,265
Aggregated Statistics For Year 2003(Based on 1 full and 6 partial tracts) A) FHA, FSA/RHS & VA B) Conventional C) Refinancings D) Home Improvement Loans E) Loans on Dwellings For 5+ Families F) Non-occupant Loans on Number Average Value Number Average Value Number Average Value Number Average Value Number Average Value Number Average Value
LOANS ORIGINATED 47 $87,379 238 $86,890 1,009 $81,725 69 $24,257 4 $69,270 59 $65,213 APPLICATIONS APPROVED, NOT ACCEPTED 1 $92,000 36 $80,711 122 $89,953 11 $16,187 0 $0 7 $64,336 APPLICATIONS DENIED 10 $75,434 67 $63,216 369 $89,378 35 $15,239 0 $0 14 $68,471 APPLICATIONS WITHDRAWN 4 $119,122 32 $74,772 203 $86,433 11 $40,655 1 $113,780 10 $54,073 FILES CLOSED FOR INCOMPLETENESS 0 $0 10 $67,981 49 $103,961 2 $37,955 0 $0 5 $92,930
Aggregated Statistics For Year 2002(Based on 1 full and 6 partial tracts) A) FHA, FSA/RHS & VA B) Conventional C) Refinancings D) Home Improvement Loans E) Loans on Dwellings For 5+ Families F) Non-occupant Loans on Number Average Value Number Average Value Number Average Value Number Average Value Number Average Value Number Average Value
LOANS ORIGINATED 40 $86,534 246 $84,793 676 $81,927 67 $20,871 1 $580,000 63 $61,906 APPLICATIONS APPROVED, NOT ACCEPTED 3 $61,830 22 $79,493 120 $86,245 30 $18,175 0 $0 5 $74,942 APPLICATIONS DENIED 0 $0 52 $68,238 397 $83,462 50 $12,340 0 $0 5 $37,364 APPLICATIONS WITHDRAWN 8 $108,104 27 $69,889 270 $86,293 15 $44,088 0 $0 6 $74,262 FILES CLOSED FOR INCOMPLETENESS 1 $123,000 5 $86,088 45 $85,717 4 $28,468 0 $0 1 $60,000
Aggregated Statistics For Year 2001(Based on 1 full and 6 partial tracts) A) FHA, FSA/RHS & VA B) Conventional C) Refinancings D) Home Improvement Loans E) Loans on Dwellings For 5+ Families F) Non-occupant Loans on Number Average Value Number Average Value Number Average Value Number Average Value Number Average Value Number Average Value
LOANS ORIGINATED 32 $78,439 204 $78,937 680 $80,060 75 $23,935 1 $56,000 56 $51,419 APPLICATIONS APPROVED, NOT ACCEPTED 3 $88,653 23 $73,804 125 $80,184 35 $14,465 0 $0 0 $0 APPLICATIONS DENIED 6 $72,652 73 $124,132 331 $73,741 72 $11,129 0 $0 9 $57,871 APPLICATIONS WITHDRAWN 4 $83,802 12 $79,169 236 $81,935 11 $27,861 0 $0 0 $0 FILES CLOSED FOR INCOMPLETENESS 2 $47,445 4 $81,200 34 $72,737 3 $28,943 0 $0 0 $0
Aggregated Statistics For Year 2000(Based on 1 full and 6 partial tracts) A) FHA, FSA/RHS & VA B) Conventional C) Refinancings D) Home Improvement Loans F) Non-occupant Loans on Number Average Value Number Average Value Number Average Value Number Average Value Number Average Value
LOANS ORIGINATED 54 $75,172 248 $75,709 305 $63,928 79 $14,676 34 $43,196 APPLICATIONS APPROVED, NOT ACCEPTED 4 $84,415 25 $67,062 83 $67,521 33 $11,828 1 $59,000 APPLICATIONS DENIED 7 $87,213 99 $61,982 246 $66,122 65 $12,042 8 $43,698 APPLICATIONS WITHDRAWN 3 $60,780 36 $59,988 137 $59,974 13 $35,308 5 $34,668 FILES CLOSED FOR INCOMPLETENESS 1 $111,000 11 $86,525 27 $75,751 1 $11,380 2 $31,315
Aggregated Statistics For Year 1999(Based on 1 full and 3 partial tracts) A) FHA, FSA/RHS & VA B) Conventional C) Refinancings D) Home Improvement Loans E) Loans on Dwellings For 5+ Families F) Non-occupant Loans on Number Average Value Number Average Value Number Average Value Number Average Value Number Average Value Number Average Value
LOANS ORIGINATED 32 $70,952 147 $91,897 323 $62,535 52 $19,327 2 $199,170 38 $46,986 APPLICATIONS APPROVED, NOT ACCEPTED 0 $0 16 $67,374 88 $66,592 18 $9,688 0 $0 2 $28,500 APPLICATIONS DENIED 6 $68,960 31 $64,751 156 $67,031 30 $17,894 0 $0 7 $79,107 APPLICATIONS WITHDRAWN 2 $62,240 24 $67,049 103 $61,889 8 $19,321 0 $0 3 $55,157 FILES CLOSED FOR INCOMPLETENESS 0 $0 1 $72,000 34 $47,037 0 $0 0 $0 13 $22,882
Detailed HMDA statistics for the following Tracts:
0025.00
,
0026.00 ,
0027.00 ,
0028.00
Private Mortgage Insurance Companies Aggregated Statistics For Year 2009(Based on 1 full and 6 partial tracts) A) Conventional B) Refinancings Number Average Value Number Average Value
LOANS ORIGINATED 10 $88,820 14 $126,393 APPLICATIONS APPROVED, NOT ACCEPTED 2 $167,570 5 $131,810 APPLICATIONS DENIED 6 $139,577 3 $152,843 APPLICATIONS WITHDRAWN 0 $0 1 $55,750 FILES CLOSED FOR INCOMPLETENESS 0 $0 0 $0
Aggregated Statistics For Year 2008(Based on 1 full and 6 partial tracts) A) Conventional B) Refinancings C) Non-occupant Loans on Number Average Value Number Average Value Number Average Value
LOANS ORIGINATED 37 $87,354 12 $93,861 2 $121,745 APPLICATIONS APPROVED, NOT ACCEPTED 16 $66,536 18 $140,987 2 $27,520 APPLICATIONS DENIED 1 $92,160 2 $63,575 1 $92,160 APPLICATIONS WITHDRAWN 5 $56,210 0 $0 2 $24,670 FILES CLOSED FOR INCOMPLETENESS 0 $0 5 $127,774 5 $127,774
Aggregated Statistics For Year 2007(Based on 1 full and 6 partial tracts) A) Conventional B) Refinancings C) Non-occupant Loans on D) Loans On Manufactured Number Average Value Number Average Value Number Average Value Number Average Value
LOANS ORIGINATED 88 $93,002 41 $120,355 6 $92,345 1 $54,330 APPLICATIONS APPROVED, NOT ACCEPTED 5 $72,874 13 $120,433 1 $74,580 0 $0 APPLICATIONS DENIED 3 $131,977 9 $115,946 1 $139,950 0 $0 APPLICATIONS WITHDRAWN 9 $106,728 2 $72,070 0 $0 0 $0 FILES CLOSED FOR INCOMPLETENESS 0 $0 0 $0 0 $0 0 $0
Aggregated Statistics For Year 2006(Based on 1 full and 6 partial tracts) A) Conventional B) Refinancings C) Non-occupant Loans on D) Loans On Manufactured Number Average Value Number Average Value Number Average Value Number Average Value
LOANS ORIGINATED 94 $93,388 22 $130,610 5 $120,606 2 $69,270 APPLICATIONS APPROVED, NOT ACCEPTED 10 $106,109 15 $104,556 5 $113,980 0 $0 APPLICATIONS DENIED 2 $127,040 1 $72,740 0 $0 0 $0 APPLICATIONS WITHDRAWN 3 $137,183 2 $150,015 1 $114,920 0 $0 FILES CLOSED FOR INCOMPLETENESS 2 $131,895 0 $0 0 $0 0 $0
Aggregated Statistics For Year 2005(Based on 1 full and 6 partial tracts) A) Conventional B) Refinancings C) Non-occupant Loans on Number Average Value Number Average Value Number Average Value
LOANS ORIGINATED 64 $89,633 34 $116,505 3 $42,297 APPLICATIONS APPROVED, NOT ACCEPTED 5 $110,910 12 $91,262 0 $0 APPLICATIONS DENIED 2 $130,845 1 $46,000 0 $0 APPLICATIONS WITHDRAWN 1 $73,660 3 $90,043 0 $0 FILES CLOSED FOR INCOMPLETENESS 0 $0 1 $153,600 0 $0
Aggregated Statistics For Year 2004(Based on 1 full and 6 partial tracts) A) Conventional B) Refinancings C) Non-occupant Loans on Number Average Value Number Average Value Number Average Value
LOANS ORIGINATED 79 $86,472 47 $98,140 1 $65,000 APPLICATIONS APPROVED, NOT ACCEPTED 12 $115,467 24 $117,621 2 $92,285 APPLICATIONS DENIED 0 $0 3 $76,370 1 $64,000 APPLICATIONS WITHDRAWN 4 $107,855 9 $101,874 0 $0 FILES CLOSED FOR INCOMPLETENESS 0 $0 1 $192,290 0 $0
Aggregated Statistics For Year 2003(Based on 1 full and 6 partial tracts) A) Conventional B) Refinancings C) Non-occupant Loans on Number Average Value Number Average Value Number Average Value
LOANS ORIGINATED 72 $88,997 102 $102,850 3 $46,490 APPLICATIONS APPROVED, NOT ACCEPTED 11 $51,460 44 $111,349 5 $50,600 APPLICATIONS DENIED 1 $111,000 6 $73,382 0 $0 APPLICATIONS WITHDRAWN 7 $72,014 12 $99,766 4 $56,250 FILES CLOSED FOR INCOMPLETENESS 3 $71,590 1 $126,300 0 $0
Aggregated Statistics For Year 2002(Based on 1 full and 6 partial tracts) A) Conventional B) Refinancings C) Non-occupant Loans on Number Average Value Number Average Value Number Average Value
LOANS ORIGINATED 81 $90,791 87 $100,889 4 $76,432 APPLICATIONS APPROVED, NOT ACCEPTED 15 $95,058 21 $98,367 1 $62,000 APPLICATIONS DENIED 1 $62,000 3 $77,963 0 $0 APPLICATIONS WITHDRAWN 6 $86,473 12 $95,127 2 $85,500 FILES CLOSED FOR INCOMPLETENESS 0 $0 0 $0 0 $0
Aggregated Statistics For Year 2001(Based on 1 full and 6 partial tracts) A) Conventional B) Refinancings C) Non-occupant Loans on Number Average Value Number Average Value Number Average Value
LOANS ORIGINATED 67 $90,547 79 $94,395 1 $112,640 APPLICATIONS APPROVED, NOT ACCEPTED 13 $104,922 29 $106,356 2 $51,240 APPLICATIONS DENIED 1 $53,000 4 $102,162 1 $55,000 APPLICATIONS WITHDRAWN 1 $40,000 0 $0 0 $0 FILES CLOSED FOR INCOMPLETENESS 0 $0 1 $55,000 0 $0
Aggregated Statistics For Year 2000(Based on 1 full and 6 partial tracts) A) Conventional B) Refinancings C) Non-occupant Loans on Number Average Value Number Average Value Number Average Value
LOANS ORIGINATED 90 $75,945 24 $85,107 0 $0 APPLICATIONS APPROVED, NOT ACCEPTED 14 $89,456 4 $87,548 1 $73,960 APPLICATIONS DENIED 3 $74,847 2 $70,220 0 $0 APPLICATIONS WITHDRAWN 0 $0 2 $66,000 0 $0 FILES CLOSED FOR INCOMPLETENESS 5 $83,790 0 $0 2 $47,445
Aggregated Statistics For Year 1999(Based on 1 full and 3 partial tracts) A) Conventional B) Refinancings C) Non-occupant Loans on Number Average Value Number Average Value Number Average Value
LOANS ORIGINATED 37 $73,025 23 $83,188 2 $59,760 APPLICATIONS APPROVED, NOT ACCEPTED 5 $72,196 5 $70,334 0 $0 APPLICATIONS DENIED 4 $86,078 2 $109,915 1 $63,000 APPLICATIONS WITHDRAWN 1 $55,000 0 $0 0 $0 FILES CLOSED FOR INCOMPLETENESS 1 $48,000 0 $0 0 $0
Detailed PMIC statistics for the following Tracts:
0025.00
,
0026.00 ,
0027.00 ,
0028.00
2002 - 2018 National Fire Incident Reporting System (NFIRS) incidents See full 2006 National Fire Incident Reporting System statistics for zip code 44875, Ohio
Most common first names in zip code 44875 among deceased individuals Name Count Lived (average)
Mary 136 81.1 years Robert 104 71.5 years William 103 73.5 years John 100 75.8 years Charles 81 75.0 years James 70 72.1 years George 63 73.7 years Helen 59 82.2 years Dorothy 55 79.1 years Ruth 55 78.0 years
Most common last names in zip code 44875 among deceased individuals Last name Count Lived (average)
Smith 50 76.9 years Miller 33 76.7 years Johnson 32 78.8 years Clark 30 80.9 years Brown 30 74.5 years Jones 27 75.7 years Lewis 26 74.3 years Metzger 26 79.6 years Dick 25 78.9 years Payne 22 76.6 years
Businesses in zip code 44875
Name Count Name Count
Advance Auto Parts 1 MasterBrand Cabinets 2 Burger King 1 McDonald's 1 Chevrolet 1 Rite Aid 1 Curves 1 Subway 1 FedEx 1 U-Haul 1 Ford 1 UPS 3 GNC 1 Wendy's 1 H&R Block 1 YMCA 1 KFC 1
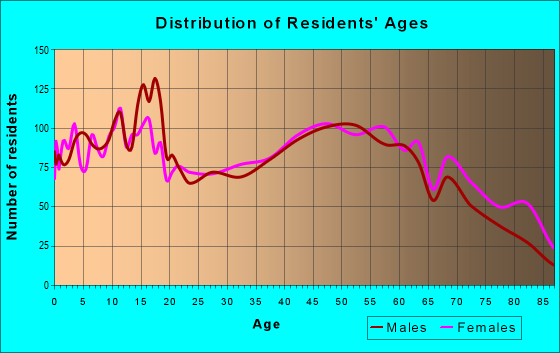
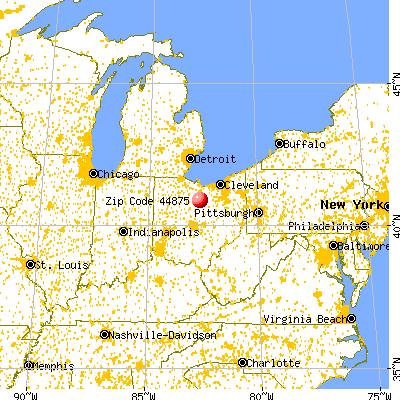


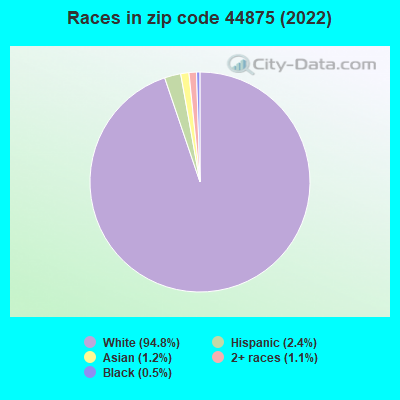


+$1,605
-$3,706
(% of AGI for various income ranges: -3.9% for AGIs below $10k, -0.4% for AGIs $10k-25k, 0.1% for AGIs $25k-50k, 0.1% for AGIs $50k-75k, 1.2% for AGIs $75k-100k)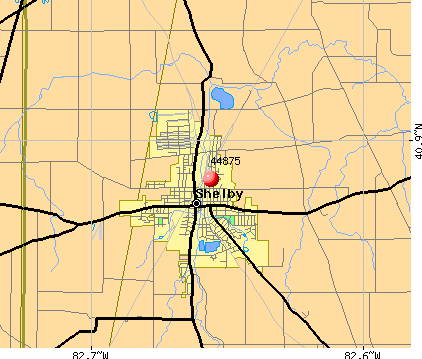 Nearest zip codes: 44865, 44827, 44878, 44887, 44906, 44850.
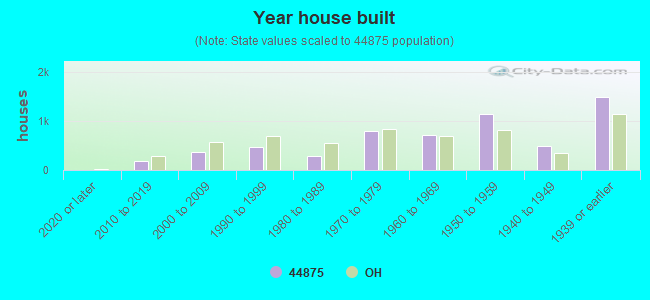
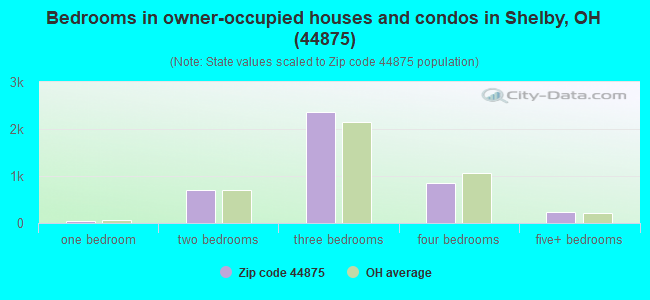
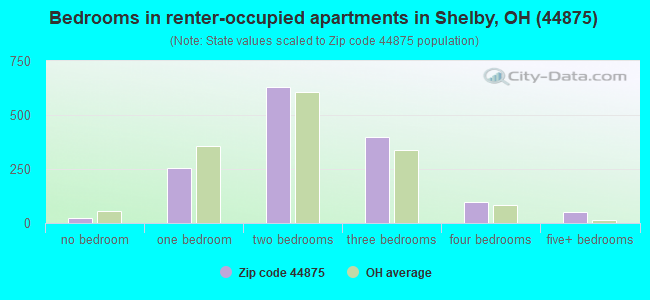
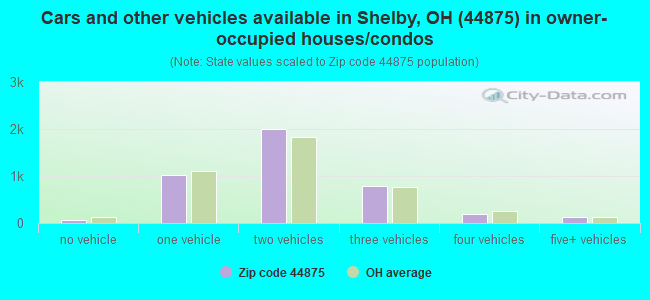
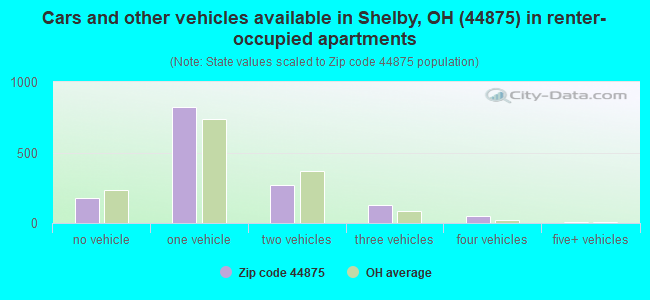


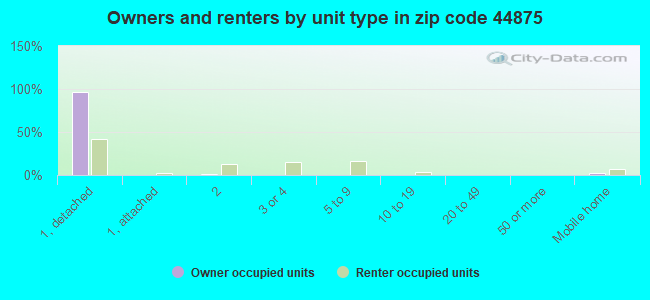
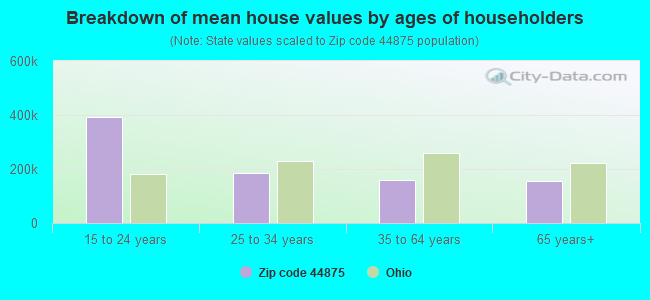


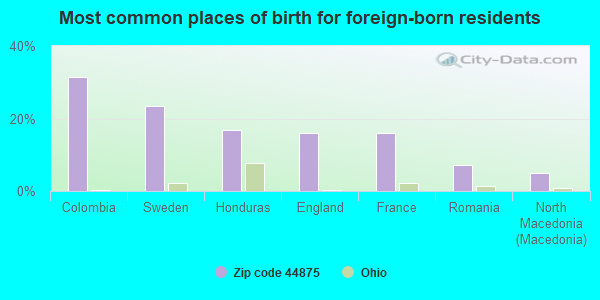
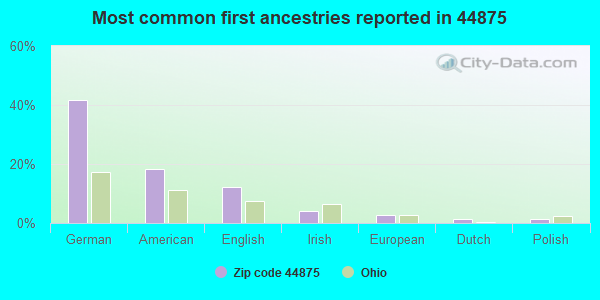
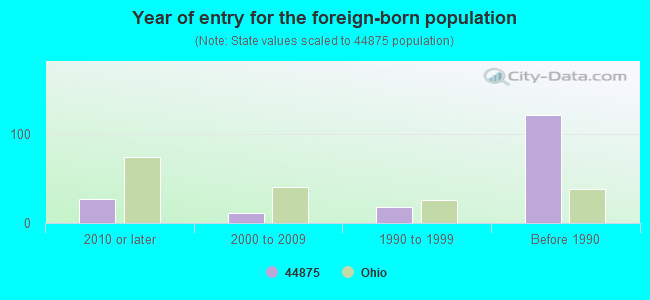
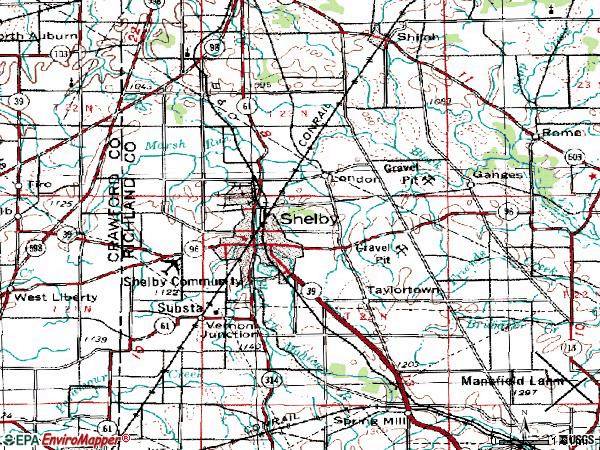

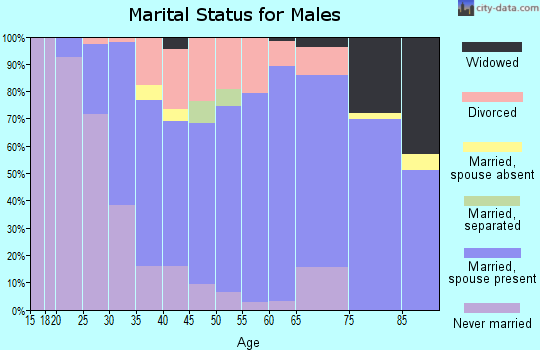
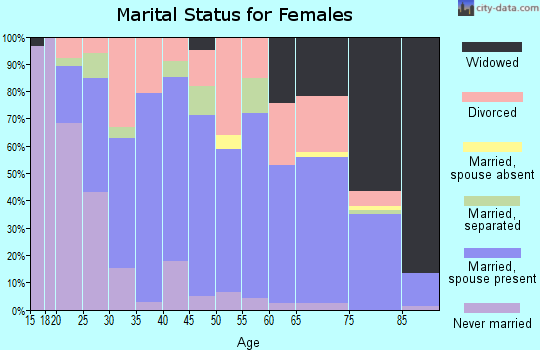
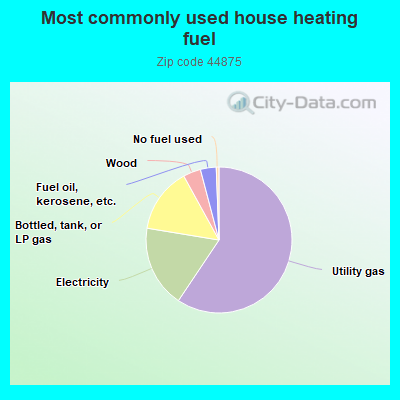
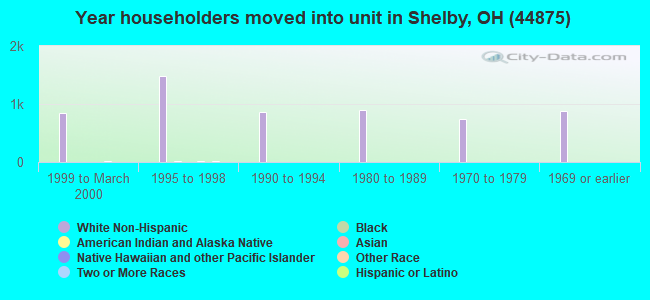
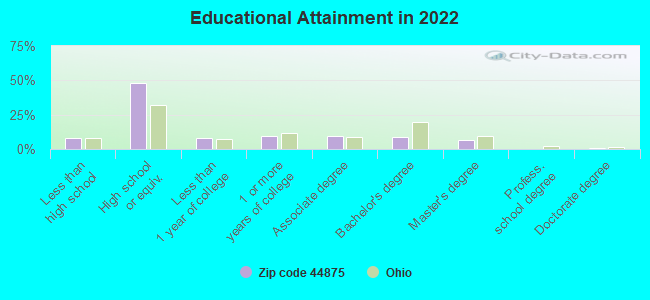
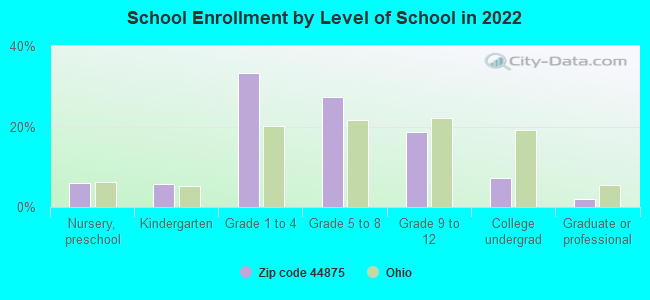
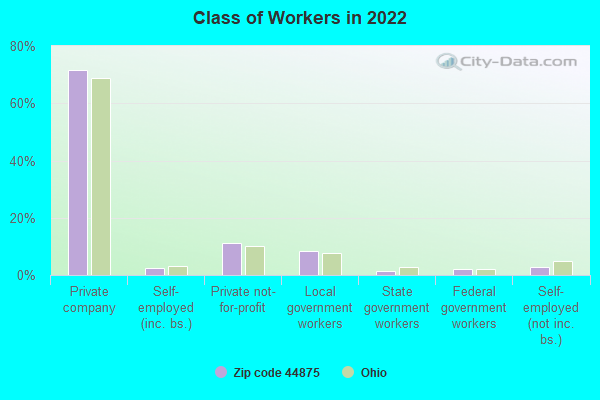
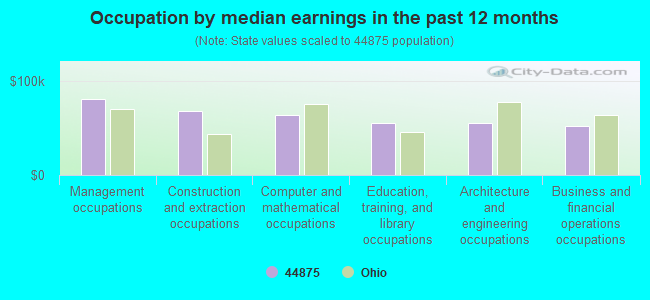
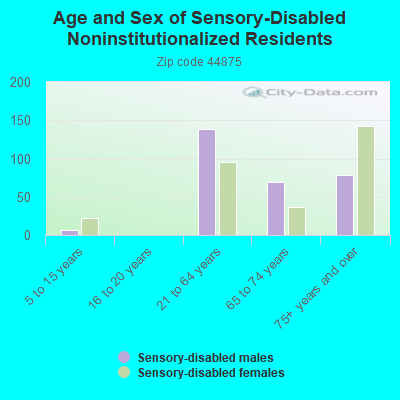

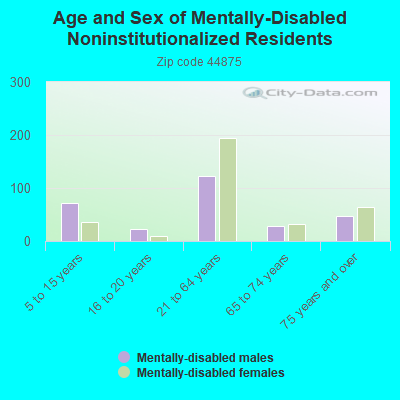
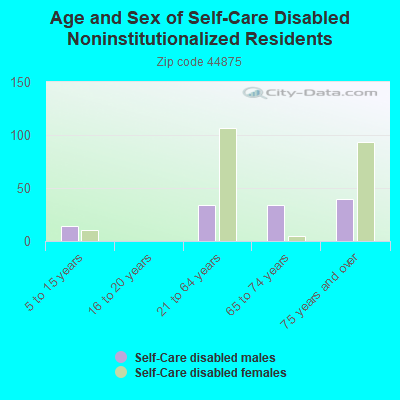
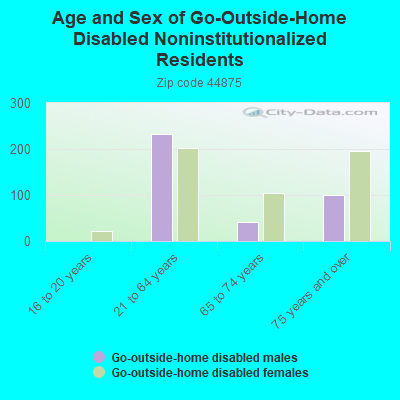
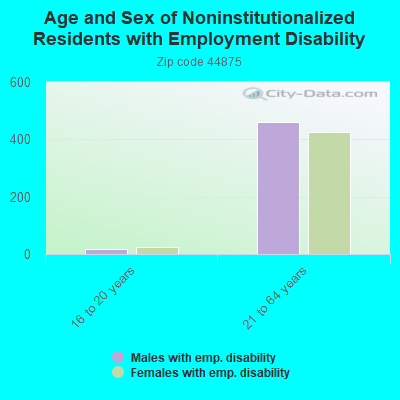
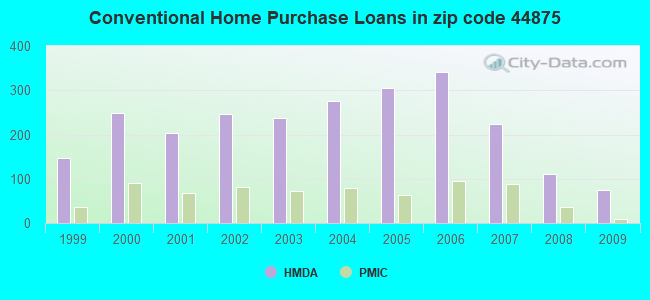
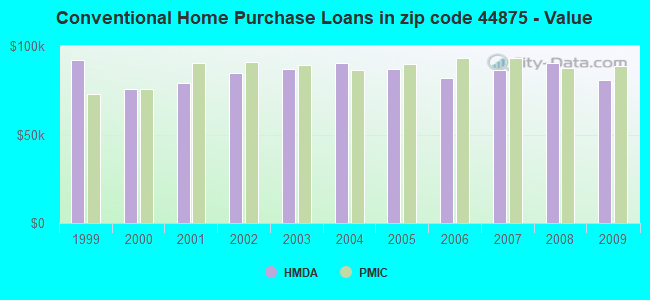
 Based on the data from the years 2002 - 2018 the average number of fires per year is 72. The highest number of fires - 97 took place in 2010, and the least - 53 in 2018. The data has a dropping trend.
 When looking into fire subcategories, the most reports belonged to: Outside Fires (45.8%), and Structure Fires (42.1%).