Shelby, Ohio Submit your own pictures of this city and show them to the world
OSM Map
General Map
Google Map
MSN Map
OSM Map
General Map
Google Map
MSN Map
OSM Map
General Map
Google Map
MSN Map
OSM Map
General Map
Google Map
MSN Map
Please wait while loading the map...
Population in 2022: 9,278 (99% urban, 1% rural). Population change since 2000: -5.5%Males: 4,177 Females: 5,101
March 2022 cost of living index in Shelby: 89.6 (less than average, U.S. average is 100) Percentage of residents living in poverty in 2022: 15.3%for White Non-Hispanic residents , 100.0% for Black residents , 10.8% for Hispanic or Latino residents )
Profiles of local businesses
Business Search - 14 Million verified businesses
Data:
Median household income ($)
Median household income (% change since 2000)
Household income diversity
Ratio of average income to average house value (%)
Ratio of average income to average rent
Median household income ($) - White
Median household income ($) - Black or African American
Median household income ($) - Asian
Median household income ($) - Hispanic or Latino
Median household income ($) - American Indian and Alaska Native
Median household income ($) - Multirace
Median household income ($) - Other Race
Median household income for houses/condos with a mortgage ($)
Median household income for apartments without a mortgage ($)
Races - White alone (%)
Races - White alone (% change since 2000)
Races - Black alone (%)
Races - Black alone (% change since 2000)
Races - American Indian alone (%)
Races - American Indian alone (% change since 2000)
Races - Asian alone (%)
Races - Asian alone (% change since 2000)
Races - Hispanic (%)
Races - Hispanic (% change since 2000)
Races - Native Hawaiian and Other Pacific Islander alone (%)
Races - Native Hawaiian and Other Pacific Islander alone (% change since 2000)
Races - Two or more races (%)
Races - Two or more races (% change since 2000)
Races - Other race alone (%)
Races - Other race alone (% change since 2000)
Racial diversity
Unemployment (%)
Unemployment (% change since 2000)
Unemployment (%) - White
Unemployment (%) - Black or African American
Unemployment (%) - Asian
Unemployment (%) - Hispanic or Latino
Unemployment (%) - American Indian and Alaska Native
Unemployment (%) - Multirace
Unemployment (%) - Other Race
Population density (people per square mile)
Population - Males (%)
Population - Females (%)
Population - Males (%) - White
Population - Males (%) - Black or African American
Population - Males (%) - Asian
Population - Males (%) - Hispanic or Latino
Population - Males (%) - American Indian and Alaska Native
Population - Males (%) - Multirace
Population - Males (%) - Other Race
Population - Females (%) - White
Population - Females (%) - Black or African American
Population - Females (%) - Asian
Population - Females (%) - Hispanic or Latino
Population - Females (%) - American Indian and Alaska Native
Population - Females (%) - Multirace
Population - Females (%) - Other Race
Coronavirus confirmed cases (Apr 27, 2024)
Deaths caused by coronavirus (Apr 27, 2024)
Coronavirus confirmed cases (per 100k population) (Apr 27, 2024)
Deaths caused by coronavirus (per 100k population) (Apr 27, 2024)
Daily increase in number of cases (Apr 27, 2024)
Weekly increase in number of cases (Apr 27, 2024)
Cases doubled (in days) (Apr 27, 2024)
Hospitalized patients (Apr 18, 2022)
Negative test results (Apr 18, 2022)
Total test results (Apr 18, 2022)
COVID Vaccine doses distributed (per 100k population) (Sep 19, 2023)
COVID Vaccine doses administered (per 100k population) (Sep 19, 2023)
COVID Vaccine doses distributed (Sep 19, 2023)
COVID Vaccine doses administered (Sep 19, 2023)
Likely homosexual households (%)
Likely homosexual households (% change since 2000)
Likely homosexual households - Lesbian couples (%)
Likely homosexual households - Lesbian couples (% change since 2000)
Likely homosexual households - Gay men (%)
Likely homosexual households - Gay men (% change since 2000)
Cost of living index
Median gross rent ($)
Median contract rent ($)
Median monthly housing costs ($)
Median house or condo value ($)
Median house or condo value ($ change since 2000)
Mean house or condo value by units in structure - 1, detached ($)
Mean house or condo value by units in structure - 1, attached ($)
Mean house or condo value by units in structure - 2 ($)
Mean house or condo value by units in structure by units in structure - 3 or 4 ($)
Mean house or condo value by units in structure - 5 or more ($)
Mean house or condo value by units in structure - Boat, RV, van, etc. ($)
Mean house or condo value by units in structure - Mobile home ($)
Median house or condo value ($) - White
Median house or condo value ($) - Black or African American
Median house or condo value ($) - Asian
Median house or condo value ($) - Hispanic or Latino
Median house or condo value ($) - American Indian and Alaska Native
Median house or condo value ($) - Multirace
Median house or condo value ($) - Other Race
Median resident age
Resident age diversity
Median resident age - Males
Median resident age - Females
Median resident age - White
Median resident age - Black or African American
Median resident age - Asian
Median resident age - Hispanic or Latino
Median resident age - American Indian and Alaska Native
Median resident age - Multirace
Median resident age - Other Race
Median resident age - Males - White
Median resident age - Males - Black or African American
Median resident age - Males - Asian
Median resident age - Males - Hispanic or Latino
Median resident age - Males - American Indian and Alaska Native
Median resident age - Males - Multirace
Median resident age - Males - Other Race
Median resident age - Females - White
Median resident age - Females - Black or African American
Median resident age - Females - Asian
Median resident age - Females - Hispanic or Latino
Median resident age - Females - American Indian and Alaska Native
Median resident age - Females - Multirace
Median resident age - Females - Other Race
Commute - mean travel time to work (minutes)
Travel time to work - Less than 5 minutes (%)
Travel time to work - Less than 5 minutes (% change since 2000)
Travel time to work - 5 to 9 minutes (%)
Travel time to work - 5 to 9 minutes (% change since 2000)
Travel time to work - 10 to 19 minutes (%)
Travel time to work - 10 to 19 minutes (% change since 2000)
Travel time to work - 20 to 29 minutes (%)
Travel time to work - 20 to 29 minutes (% change since 2000)
Travel time to work - 30 to 39 minutes (%)
Travel time to work - 30 to 39 minutes (% change since 2000)
Travel time to work - 40 to 59 minutes (%)
Travel time to work - 40 to 59 minutes (% change since 2000)
Travel time to work - 60 to 89 minutes (%)
Travel time to work - 60 to 89 minutes (% change since 2000)
Travel time to work - 90 or more minutes (%)
Travel time to work - 90 or more minutes (% change since 2000)
Marital status - Never married (%)
Marital status - Now married (%)
Marital status - Separated (%)
Marital status - Widowed (%)
Marital status - Divorced (%)
Median family income ($)
Median family income (% change since 2000)
Median non-family income ($)
Median non-family income (% change since 2000)
Median per capita income ($)
Median per capita income (% change since 2000)
Median family income ($) - White
Median family income ($) - Black or African American
Median family income ($) - Asian
Median family income ($) - Hispanic or Latino
Median family income ($) - American Indian and Alaska Native
Median family income ($) - Multirace
Median family income ($) - Other Race
Median year house/condo built
Median year apartment built
Year house built - Built 2005 or later (%)
Year house built - Built 2000 to 2004 (%)
Year house built - Built 1990 to 1999 (%)
Year house built - Built 1980 to 1989 (%)
Year house built - Built 1970 to 1979 (%)
Year house built - Built 1960 to 1969 (%)
Year house built - Built 1950 to 1959 (%)
Year house built - Built 1940 to 1949 (%)
Year house built - Built 1939 or earlier (%)
Average household size
Household density (households per square mile)
Average household size - White
Average household size - Black or African American
Average household size - Asian
Average household size - Hispanic or Latino
Average household size - American Indian and Alaska Native
Average household size - Multirace
Average household size - Other Race
Occupied housing units (%)
Vacant housing units (%)
Owner occupied housing units (%)
Renter occupied housing units (%)
Vacancy status - For rent (%)
Vacancy status - For sale only (%)
Vacancy status - Rented or sold, not occupied (%)
Vacancy status - For seasonal, recreational, or occasional use (%)
Vacancy status - For migrant workers (%)
Vacancy status - Other vacant (%)
Residents with income below the poverty level (%)
Residents with income below 50% of the poverty level (%)
Children below poverty level (%)
Poor families by family type - Married-couple family (%)
Poor families by family type - Male, no wife present (%)
Poor families by family type - Female, no husband present (%)
Poverty status for native-born residents (%)
Poverty status for foreign-born residents (%)
Poverty among high school graduates not in families (%)
Poverty among people who did not graduate high school not in families (%)
Residents with income below the poverty level (%) - White
Residents with income below the poverty level (%) - Black or African American
Residents with income below the poverty level (%) - Asian
Residents with income below the poverty level (%) - Hispanic or Latino
Residents with income below the poverty level (%) - American Indian and Alaska Native
Residents with income below the poverty level (%) - Multirace
Residents with income below the poverty level (%) - Other Race
Air pollution - Air Quality Index (AQI)
Air pollution - CO
Air pollution - NO2
Air pollution - SO2
Air pollution - Ozone
Air pollution - PM10
Air pollution - PM25
Air pollution - Pb
Crime - Murders per 100,000 population
Crime - Rapes per 100,000 population
Crime - Robberies per 100,000 population
Crime - Assaults per 100,000 population
Crime - Burglaries per 100,000 population
Crime - Thefts per 100,000 population
Crime - Auto thefts per 100,000 population
Crime - Arson per 100,000 population
Crime - City-data.com crime index
Crime - Violent crime index
Crime - Property crime index
Crime - Murders per 100,000 population (5 year average)
Crime - Rapes per 100,000 population (5 year average)
Crime - Robberies per 100,000 population (5 year average)
Crime - Assaults per 100,000 population (5 year average)
Crime - Burglaries per 100,000 population (5 year average)
Crime - Thefts per 100,000 population (5 year average)
Crime - Auto thefts per 100,000 population (5 year average)
Crime - Arson per 100,000 population (5 year average)
Crime - City-data.com crime index (5 year average)
Crime - Violent crime index (5 year average)
Crime - Property crime index (5 year average)
1996 Presidential Elections Results (%) - Democratic Party (Clinton)
1996 Presidential Elections Results (%) - Republican Party (Dole)
1996 Presidential Elections Results (%) - Other
2000 Presidential Elections Results (%) - Democratic Party (Gore)
2000 Presidential Elections Results (%) - Republican Party (Bush)
2000 Presidential Elections Results (%) - Other
2004 Presidential Elections Results (%) - Democratic Party (Kerry)
2004 Presidential Elections Results (%) - Republican Party (Bush)
2004 Presidential Elections Results (%) - Other
2008 Presidential Elections Results (%) - Democratic Party (Obama)
2008 Presidential Elections Results (%) - Republican Party (McCain)
2008 Presidential Elections Results (%) - Other
2012 Presidential Elections Results (%) - Democratic Party (Obama)
2012 Presidential Elections Results (%) - Republican Party (Romney)
2012 Presidential Elections Results (%) - Other
2016 Presidential Elections Results (%) - Democratic Party (Clinton)
2016 Presidential Elections Results (%) - Republican Party (Trump)
2016 Presidential Elections Results (%) - Other
2020 Presidential Elections Results (%) - Democratic Party (Biden)
2020 Presidential Elections Results (%) - Republican Party (Trump)
2020 Presidential Elections Results (%) - Other
Ancestries Reported - Arab (%)
Ancestries Reported - Czech (%)
Ancestries Reported - Danish (%)
Ancestries Reported - Dutch (%)
Ancestries Reported - English (%)
Ancestries Reported - French (%)
Ancestries Reported - French Canadian (%)
Ancestries Reported - German (%)
Ancestries Reported - Greek (%)
Ancestries Reported - Hungarian (%)
Ancestries Reported - Irish (%)
Ancestries Reported - Italian (%)
Ancestries Reported - Lithuanian (%)
Ancestries Reported - Norwegian (%)
Ancestries Reported - Polish (%)
Ancestries Reported - Portuguese (%)
Ancestries Reported - Russian (%)
Ancestries Reported - Scotch-Irish (%)
Ancestries Reported - Scottish (%)
Ancestries Reported - Slovak (%)
Ancestries Reported - Subsaharan African (%)
Ancestries Reported - Swedish (%)
Ancestries Reported - Swiss (%)
Ancestries Reported - Ukrainian (%)
Ancestries Reported - United States (%)
Ancestries Reported - Welsh (%)
Ancestries Reported - West Indian (%)
Ancestries Reported - Other (%)
Educational Attainment - No schooling completed (%)
Educational Attainment - Less than high school (%)
Educational Attainment - High school or equivalent (%)
Educational Attainment - Less than 1 year of college (%)
Educational Attainment - 1 or more years of college (%)
Educational Attainment - Associate degree (%)
Educational Attainment - Bachelor's degree (%)
Educational Attainment - Master's degree (%)
Educational Attainment - Professional school degree (%)
Educational Attainment - Doctorate degree (%)
School Enrollment - Nursery, preschool (%)
School Enrollment - Kindergarten (%)
School Enrollment - Grade 1 to 4 (%)
School Enrollment - Grade 5 to 8 (%)
School Enrollment - Grade 9 to 12 (%)
School Enrollment - College undergrad (%)
School Enrollment - Graduate or professional (%)
School Enrollment - Not enrolled in school (%)
School enrollment - Public schools (%)
School enrollment - Private schools (%)
School enrollment - Not enrolled (%)
Median number of rooms in houses and condos
Median number of rooms in apartments
Housing units lacking complete plumbing facilities (%)
Housing units lacking complete kitchen facilities (%)
Density of houses
Urban houses (%)
Rural houses (%)
Households with people 60 years and over (%)
Households with people 65 years and over (%)
Households with people 75 years and over (%)
Households with one or more nonrelatives (%)
Households with no nonrelatives (%)
Population in households (%)
Family households (%)
Nonfamily households (%)
Population in families (%)
Family households with own children (%)
Median number of bedrooms in owner occupied houses
Mean number of bedrooms in owner occupied houses
Median number of bedrooms in renter occupied houses
Mean number of bedrooms in renter occupied houses
Median number of vehichles in owner occupied houses
Mean number of vehichles in owner occupied houses
Median number of vehichles in renter occupied houses
Mean number of vehichles in renter occupied houses
Mortgage status - with mortgage (%)
Mortgage status - with second mortgage (%)
Mortgage status - with home equity loan (%)
Mortgage status - with both second mortgage and home equity loan (%)
Mortgage status - without a mortgage (%)
Average family size
Average family size - White
Average family size - Black or African American
Average family size - Asian
Average family size - Hispanic or Latino
Average family size - American Indian and Alaska Native
Average family size - Multirace
Average family size - Other Race
Geographical mobility - Same house 1 year ago (%)
Geographical mobility - Moved within same county (%)
Geographical mobility - Moved from different county within same state (%)
Geographical mobility - Moved from different state (%)
Geographical mobility - Moved from abroad (%)
Place of birth - Born in state of residence (%)
Place of birth - Born in other state (%)
Place of birth - Native, outside of US (%)
Place of birth - Foreign born (%)
Housing units in structures - 1, detached (%)
Housing units in structures - 1, attached (%)
Housing units in structures - 2 (%)
Housing units in structures - 3 or 4 (%)
Housing units in structures - 5 to 9 (%)
Housing units in structures - 10 to 19 (%)
Housing units in structures - 20 to 49 (%)
Housing units in structures - 50 or more (%)
Housing units in structures - Mobile home (%)
Housing units in structures - Boat, RV, van, etc. (%)
House/condo owner moved in on average (years ago)
Renter moved in on average (years ago)
Year householder moved into unit - Moved in 1999 to March 2000 (%)
Year householder moved into unit - Moved in 1995 to 1998 (%)
Year householder moved into unit - Moved in 1990 to 1994 (%)
Year householder moved into unit - Moved in 1980 to 1989 (%)
Year householder moved into unit - Moved in 1970 to 1979 (%)
Year householder moved into unit - Moved in 1969 or earlier (%)
Means of transportation to work - Drove car alone (%)
Means of transportation to work - Carpooled (%)
Means of transportation to work - Public transportation (%)
Means of transportation to work - Bus or trolley bus (%)
Means of transportation to work - Streetcar or trolley car (%)
Means of transportation to work - Subway or elevated (%)
Means of transportation to work - Railroad (%)
Means of transportation to work - Ferryboat (%)
Means of transportation to work - Taxicab (%)
Means of transportation to work - Motorcycle (%)
Means of transportation to work - Bicycle (%)
Means of transportation to work - Walked (%)
Means of transportation to work - Other means (%)
Working at home (%)
Industry diversity
Most Common Industries - Agriculture, forestry, fishing and hunting, and mining (%)
Most Common Industries - Agriculture, forestry, fishing and hunting (%)
Most Common Industries - Mining, quarrying, and oil and gas extraction (%)
Most Common Industries - Construction (%)
Most Common Industries - Manufacturing (%)
Most Common Industries - Wholesale trade (%)
Most Common Industries - Retail trade (%)
Most Common Industries - Transportation and warehousing, and utilities (%)
Most Common Industries - Transportation and warehousing (%)
Most Common Industries - Utilities (%)
Most Common Industries - Information (%)
Most Common Industries - Finance and insurance, and real estate and rental and leasing (%)
Most Common Industries - Finance and insurance (%)
Most Common Industries - Real estate and rental and leasing (%)
Most Common Industries - Professional, scientific, and management, and administrative and waste management services (%)
Most Common Industries - Professional, scientific, and technical services (%)
Most Common Industries - Management of companies and enterprises (%)
Most Common Industries - Administrative and support and waste management services (%)
Most Common Industries - Educational services, and health care and social assistance (%)
Most Common Industries - Educational services (%)
Most Common Industries - Health care and social assistance (%)
Most Common Industries - Arts, entertainment, and recreation, and accommodation and food services (%)
Most Common Industries - Arts, entertainment, and recreation (%)
Most Common Industries - Accommodation and food services (%)
Most Common Industries - Other services, except public administration (%)
Most Common Industries - Public administration (%)
Occupation diversity
Most Common Occupations - Management, business, science, and arts occupations (%)
Most Common Occupations - Management, business, and financial occupations (%)
Most Common Occupations - Management occupations (%)
Most Common Occupations - Business and financial operations occupations (%)
Most Common Occupations - Computer, engineering, and science occupations (%)
Most Common Occupations - Computer and mathematical occupations (%)
Most Common Occupations - Architecture and engineering occupations (%)
Most Common Occupations - Life, physical, and social science occupations (%)
Most Common Occupations - Education, legal, community service, arts, and media occupations (%)
Most Common Occupations - Community and social service occupations (%)
Most Common Occupations - Legal occupations (%)
Most Common Occupations - Education, training, and library occupations (%)
Most Common Occupations - Arts, design, entertainment, sports, and media occupations (%)
Most Common Occupations - Healthcare practitioners and technical occupations (%)
Most Common Occupations - Health diagnosing and treating practitioners and other technical occupations (%)
Most Common Occupations - Health technologists and technicians (%)
Most Common Occupations - Service occupations (%)
Most Common Occupations - Healthcare support occupations (%)
Most Common Occupations - Protective service occupations (%)
Most Common Occupations - Fire fighting and prevention, and other protective service workers including supervisors (%)
Most Common Occupations - Law enforcement workers including supervisors (%)
Most Common Occupations - Food preparation and serving related occupations (%)
Most Common Occupations - Building and grounds cleaning and maintenance occupations (%)
Most Common Occupations - Personal care and service occupations (%)
Most Common Occupations - Sales and office occupations (%)
Most Common Occupations - Sales and related occupations (%)
Most Common Occupations - Office and administrative support occupations (%)
Most Common Occupations - Natural resources, construction, and maintenance occupations (%)
Most Common Occupations - Farming, fishing, and forestry occupations (%)
Most Common Occupations - Construction and extraction occupations (%)
Most Common Occupations - Installation, maintenance, and repair occupations (%)
Most Common Occupations - Production, transportation, and material moving occupations (%)
Most Common Occupations - Production occupations (%)
Most Common Occupations - Transportation occupations (%)
Most Common Occupations - Material moving occupations (%)
People in Group quarters - Institutionalized population (%)
People in Group quarters - Correctional institutions (%)
People in Group quarters - Federal prisons and detention centers (%)
People in Group quarters - Halfway houses (%)
People in Group quarters - Local jails and other confinement facilities (including police lockups) (%)
People in Group quarters - Military disciplinary barracks (%)
People in Group quarters - State prisons (%)
People in Group quarters - Other types of correctional institutions (%)
People in Group quarters - Nursing homes (%)
People in Group quarters - Hospitals/wards, hospices, and schools for the handicapped (%)
People in Group quarters - Hospitals/wards and hospices for chronically ill (%)
People in Group quarters - Hospices or homes for chronically ill (%)
People in Group quarters - Military hospitals or wards for chronically ill (%)
People in Group quarters - Other hospitals or wards for chronically ill (%)
People in Group quarters - Hospitals or wards for drug/alcohol abuse (%)
People in Group quarters - Mental (Psychiatric) hospitals or wards (%)
People in Group quarters - Schools, hospitals, or wards for the mentally retarded (%)
People in Group quarters - Schools, hospitals, or wards for the physically handicapped (%)
People in Group quarters - Institutions for the deaf (%)
People in Group quarters - Institutions for the blind (%)
People in Group quarters - Orthopedic wards and institutions for the physically handicapped (%)
People in Group quarters - Wards in general hospitals for patients who have no usual home elsewhere (%)
People in Group quarters - Wards in military hospitals for patients who have no usual home elsewhere (%)
People in Group quarters - Juvenile institutions (%)
People in Group quarters - Long-term care (%)
People in Group quarters - Homes for abused, dependent, and neglected children (%)
People in Group quarters - Residential treatment centers for emotionally disturbed children (%)
People in Group quarters - Training schools for juvenile delinquents (%)
People in Group quarters - Short-term care, detention or diagnostic centers for delinquent children (%)
People in Group quarters - Type of juvenile institution unknown (%)
People in Group quarters - Noninstitutionalized population (%)
People in Group quarters - College dormitories (includes college quarters off campus) (%)
People in Group quarters - Military quarters (%)
People in Group quarters - On base (%)
People in Group quarters - Barracks, unaccompanied personnel housing (UPH), (Enlisted/Officer), ;and similar group living quarters for military personnel (%)
People in Group quarters - Transient quarters for temporary residents (%)
People in Group quarters - Military ships (%)
People in Group quarters - Group homes (%)
People in Group quarters - Homes or halfway houses for drug/alcohol abuse (%)
People in Group quarters - Homes for the mentally ill (%)
People in Group quarters - Homes for the mentally retarded (%)
People in Group quarters - Homes for the physically handicapped (%)
People in Group quarters - Other group homes (%)
People in Group quarters - Religious group quarters (%)
People in Group quarters - Dormitories (%)
People in Group quarters - Agriculture workers' dormitories on farms (%)
People in Group quarters - Job Corps and vocational training facilities (%)
People in Group quarters - Other workers' dormitories (%)
People in Group quarters - Crews of maritime vessels (%)
People in Group quarters - Other nonhousehold living situations (%)
People in Group quarters - Other noninstitutional group quarters (%)
Residents speaking English at home (%)
Residents speaking English at home - Born in the United States (%)
Residents speaking English at home - Native, born elsewhere (%)
Residents speaking English at home - Foreign born (%)
Residents speaking Spanish at home (%)
Residents speaking Spanish at home - Born in the United States (%)
Residents speaking Spanish at home - Native, born elsewhere (%)
Residents speaking Spanish at home - Foreign born (%)
Residents speaking other language at home (%)
Residents speaking other language at home - Born in the United States (%)
Residents speaking other language at home - Native, born elsewhere (%)
Residents speaking other language at home - Foreign born (%)
Class of Workers - Employee of private company (%)
Class of Workers - Self-employed in own incorporated business (%)
Class of Workers - Private not-for-profit wage and salary workers (%)
Class of Workers - Local government workers (%)
Class of Workers - State government workers (%)
Class of Workers - Federal government workers (%)
Class of Workers - Self-employed workers in own not incorporated business and Unpaid family workers (%)
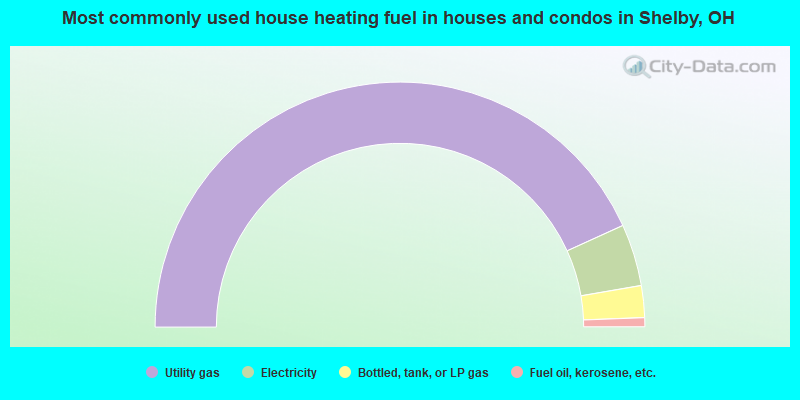
House heating fuel used in houses and condos - Utility gas (%)
House heating fuel used in houses and condos - Bottled, tank, or LP gas (%)
House heating fuel used in houses and condos - Electricity (%)
House heating fuel used in houses and condos - Fuel oil, kerosene, etc. (%)
House heating fuel used in houses and condos - Coal or coke (%)
House heating fuel used in houses and condos - Wood (%)
House heating fuel used in houses and condos - Solar energy (%)
House heating fuel used in houses and condos - Other fuel (%)
House heating fuel used in houses and condos - No fuel used (%)
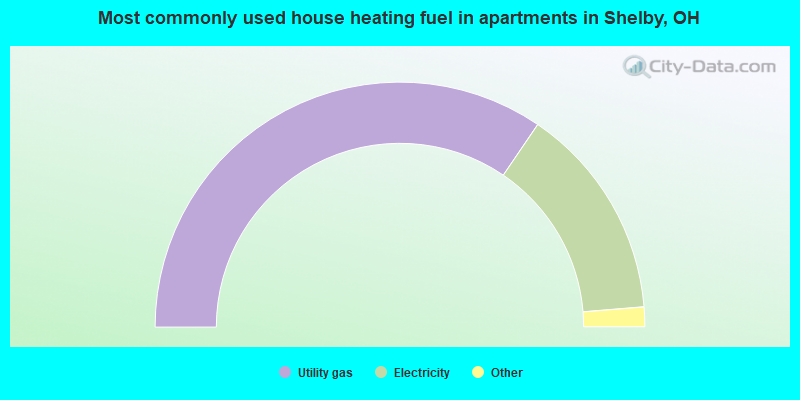
House heating fuel used in apartments - Utility gas (%)
House heating fuel used in apartments - Bottled, tank, or LP gas (%)
House heating fuel used in apartments - Electricity (%)
House heating fuel used in apartments - Fuel oil, kerosene, etc. (%)
House heating fuel used in apartments - Coal or coke (%)
House heating fuel used in apartments - Wood (%)
House heating fuel used in apartments - Solar energy (%)
House heating fuel used in apartments - Other fuel (%)
House heating fuel used in apartments - No fuel used (%)
Armed forces status - In Armed Forces (%)
Armed forces status - Civilian (%)
Armed forces status - Civilian - Veteran (%)
Armed forces status - Civilian - Nonveteran (%)
Fatal accidents locations in years 2005-2021
Fatal accidents locations in 2005
Fatal accidents locations in 2006
Fatal accidents locations in 2007
Fatal accidents locations in 2008
Fatal accidents locations in 2009
Fatal accidents locations in 2010
Fatal accidents locations in 2011
Fatal accidents locations in 2012
Fatal accidents locations in 2013
Fatal accidents locations in 2014
Fatal accidents locations in 2015
Fatal accidents locations in 2016
Fatal accidents locations in 2017
Fatal accidents locations in 2018
Fatal accidents locations in 2019
Fatal accidents locations in 2020
Fatal accidents locations in 2021
Alcohol use - People drinking some alcohol every month (%)
Alcohol use - People not drinking at all (%)
Alcohol use - Average days/month drinking alcohol
Alcohol use - Average drinks/week
Alcohol use - Average days/year people drink much
Audiometry - Average condition of hearing (%)
Audiometry - People that can hear a whisper from across a quiet room (%)
Audiometry - People that can hear normal voice from across a quiet room (%)
Audiometry - Ears ringing, roaring, buzzing (%)
Audiometry - Had a job exposure to loud noise (%)
Audiometry - Had off-work exposure to loud noise (%)
Blood Pressure & Cholesterol - Has high blood pressure (%)
Blood Pressure & Cholesterol - Checking blood pressure at home (%)
Blood Pressure & Cholesterol - Frequently checking blood cholesterol (%)
Blood Pressure & Cholesterol - Has high cholesterol level (%)
Consumer Behavior - Money monthly spent on food at supermarket/grocery store
Consumer Behavior - Money monthly spent on food at other stores
Consumer Behavior - Money monthly spent on eating out
Consumer Behavior - Money monthly spent on carryout/delivered foods
Consumer Behavior - Income spent on food at supermarket/grocery store (%)
Consumer Behavior - Income spent on food at other stores (%)
Consumer Behavior - Income spent on eating out (%)
Consumer Behavior - Income spent on carryout/delivered foods (%)
Current Health Status - General health condition (%)
Current Health Status - Blood donors (%)
Current Health Status - Has blood ever tested for HIV virus (%)
Current Health Status - Left-handed people (%)
Dermatology - People using sunscreen (%)
Diabetes - Diabetics (%)
Diabetes - Had a blood test for high blood sugar (%)
Diabetes - People taking insulin (%)
Diet Behavior & Nutrition - Diet health (%)
Diet Behavior & Nutrition - Milk product consumption (# of products/month)
Diet Behavior & Nutrition - Meals not home prepared (#/week)
Diet Behavior & Nutrition - Meals from fast food or pizza place (#/week)
Diet Behavior & Nutrition - Ready-to-eat foods (#/month)
Diet Behavior & Nutrition - Frozen meals/pizza (#/month)
Drug Use - People that ever used marijuana or hashish (%)
Drug Use - Ever used hard drugs (%)
Drug Use - Ever used any form of cocaine (%)
Drug Use - Ever used heroin (%)
Drug Use - Ever used methamphetamine (%)
Health Insurance - People covered by health insurance (%)
Kidney Conditions-Urology - Avg. # of times urinating at night
Medical Conditions - People with asthma (%)
Medical Conditions - People with anemia (%)
Medical Conditions - People with psoriasis (%)
Medical Conditions - People with overweight (%)
Medical Conditions - Elderly people having difficulties in thinking or remembering (%)
Medical Conditions - People who ever received blood transfusion (%)
Medical Conditions - People having trouble seeing even with glass/contacts (%)
Medical Conditions - People with arthritis (%)
Medical Conditions - People with gout (%)
Medical Conditions - People with congestive heart failure (%)
Medical Conditions - People with coronary heart disease (%)
Medical Conditions - People with angina pectoris (%)
Medical Conditions - People who ever had heart attack (%)
Medical Conditions - People who ever had stroke (%)
Medical Conditions - People with emphysema (%)
Medical Conditions - People with thyroid problem (%)
Medical Conditions - People with chronic bronchitis (%)
Medical Conditions - People with any liver condition (%)
Medical Conditions - People who ever had cancer or malignancy (%)
Mental Health - People who have little interest in doing things (%)
Mental Health - People feeling down, depressed, or hopeless (%)
Mental Health - People who have trouble sleeping or sleeping too much (%)
Mental Health - People feeling tired or having little energy (%)
Mental Health - People with poor appetite or overeating (%)
Mental Health - People feeling bad about themself (%)
Mental Health - People who have trouble concentrating on things (%)
Mental Health - People moving or speaking slowly or too fast (%)
Mental Health - People having thoughts they would be better off dead (%)
Oral Health - Average years since last visit a dentist
Oral Health - People embarrassed because of mouth (%)
Oral Health - People with gum disease (%)
Oral Health - General health of teeth and gums (%)
Oral Health - Average days a week using dental floss/device
Oral Health - Average days a week using mouthwash for dental problem
Oral Health - Average number of teeth
Pesticide Use - Households using pesticides to control insects (%)
Pesticide Use - Households using pesticides to kill weeds (%)
Physical Activity - People doing vigorous-intensity work activities (%)
Physical Activity - People doing moderate-intensity work activities (%)
Physical Activity - People walking or bicycling (%)
Physical Activity - People doing vigorous-intensity recreational activities (%)
Physical Activity - People doing moderate-intensity recreational activities (%)
Physical Activity - Average hours a day doing sedentary activities
Physical Activity - Average hours a day watching TV or videos
Physical Activity - Average hours a day using computer
Physical Functioning - People having limitations keeping them from working (%)
Physical Functioning - People limited in amount of work they can do (%)
Physical Functioning - People that need special equipment to walk (%)
Physical Functioning - People experiencing confusion/memory problems (%)
Physical Functioning - People requiring special healthcare equipment (%)
Prescription Medications - Average number of prescription medicines taking
Preventive Aspirin Use - Adults 40+ taking low-dose aspirin (%)
Reproductive Health - Vaginal deliveries (%)
Reproductive Health - Cesarean deliveries (%)
Reproductive Health - Deliveries resulted in a live birth (%)
Reproductive Health - Pregnancies resulted in a delivery (%)
Reproductive Health - Women breastfeeding newborns (%)
Reproductive Health - Women that had a hysterectomy (%)
Reproductive Health - Women that had both ovaries removed (%)
Reproductive Health - Women that have ever taken birth control pills (%)
Reproductive Health - Women taking birth control pills (%)
Reproductive Health - Women that have ever used Depo-Provera or injectables (%)
Reproductive Health - Women that have ever used female hormones (%)
Sexual Behavior - People 18+ that ever had sex (vaginal, anal, or oral) (%)
Sexual Behavior - Males 18+ that ever had vaginal sex with a woman (%)
Sexual Behavior - Males 18+ that ever performed oral sex on a woman (%)
Sexual Behavior - Males 18+ that ever had anal sex with a woman (%)
Sexual Behavior - Males 18+ that ever had any sex with a man (%)
Sexual Behavior - Females 18+ that ever had vaginal sex with a man (%)
Sexual Behavior - Females 18+ that ever performed oral sex on a man (%)
Sexual Behavior - Females 18+ that ever had anal sex with a man (%)
Sexual Behavior - Females 18+ that ever had any kind of sex with a woman (%)
Sexual Behavior - Average age people first had sex
Sexual Behavior - Average number of female sex partners in lifetime (males 18+)
Sexual Behavior - Average number of female vaginal sex partners in lifetime (males 18+)
Sexual Behavior - Average age people first performed oral sex on a woman (18+)
Sexual Behavior - Average number of woman performed oral sex on in lifetime (18+)
Sexual Behavior - Average number of male sex partners in lifetime (males 18+)
Sexual Behavior - Average number of male anal sex partners in lifetime (males 18+)
Sexual Behavior - Average age people first performed oral sex on a man (18+)
Sexual Behavior - Average number of male oral sex partners in lifetime (18+)
Sexual Behavior - People using protection when performing oral sex (%)
Sexual Behavior - Average number of times people have vaginal or anal sex a year
Sexual Behavior - People having sex without condom (%)
Sexual Behavior - Average number of male sex partners in lifetime (females 18+)
Sexual Behavior - Average number of male vaginal sex partners in lifetime (females 18+)
Sexual Behavior - Average number of female sex partners in lifetime (females 18+)
Sexual Behavior - Circumcised males 18+ (%)
Sleep Disorders - Average hours sleeping at night
Sleep Disorders - People that has trouble sleeping (%)
Smoking-Cigarette Use - People smoking cigarettes (%)
Taste & Smell - People 40+ having problems with smell (%)
Taste & Smell - People 40+ having problems with taste (%)
Taste & Smell - People 40+ that ever had wisdom teeth removed (%)
Taste & Smell - People 40+ that ever had tonsils teeth removed (%)
Taste & Smell - People 40+ that ever had a loss of consciousness because of a head injury (%)
Taste & Smell - People 40+ that ever had a broken nose or other serious injury to face or skull (%)
Taste & Smell - People 40+ that ever had two or more sinus infections (%)
Weight - Average height (inches)
Weight - Average weight (pounds)
Weight - Average BMI
Weight - People that are obese (%)
Weight - People that ever were obese (%)
Weight - People trying to lose weight (%)
Officers per 1,000 residents here:
1.41Ohio average:
1.99
Latest news from Shelby, OH collected exclusively by city-data.com from local newspapers, TV, and radio stations
Ancestries: German (36.9%), American (23.3%), English (11.1%), Irish (4.5%), British (2.6%), Polish (2.5%).
Current Local Time:
Land area: 5.04 square miles.
Population density: 1,842 people per square mile (low).
104 residents are foreign born
Median real estate property taxes paid for housing units with mortgages in 2022: $1,567 (1.1%)Median real estate property taxes paid for housing units with no mortgage in 2022: $1,011 (1.0%)
Nearest city with pop. 50,000+: Elyria, OH
Nearest city with pop. 200,000+: Akron, OH
Nearest city with pop. 1,000,000+: Chicago, IL
Nearest cities:
Latitude: 40.88 N, Longitude: 82.66 W
Daytime population change due to commuting: +700 (+8.4%)Workers who live and work in this city: 1,218 (34.4%)
Single-family new house construction building permits:
2012: 1 building , cost: $150,0002011: 3 buildings , average cost: $118,7002010: 1 building , cost: $157,0002009: 1 building , cost: $350,0002008: 3 buildings , average cost: $220,0002007: 4 buildings , average cost: $203,1002006: 5 buildings , average cost: $133,5002005: 8 buildings , average cost: $196,0002004: 8 buildings , average cost: $174,2002003: 14 buildings , average cost: $130,0002002: 10 buildings , average cost: $122,5002001: 8 buildings , average cost: $105,2002000: 10 buildings , average cost: $116,0001999: 7 buildings , average cost: $146,5001998: 17 buildings , average cost: $146,7001997: 21 buildings , average cost: $125,300Unemployment in December 2023:
Population change in the 1990s: +70 (+0.7%).
Most common occupations in Shelby, OH (%)
Both Males Females
Other production occupations, including supervisors (8.7%)
Metal workers and plastic workers (6.4%)
Material recording, scheduling, dispatching, and distributing workers (4.8%)
Other office and administrative support workers, including supervisors (4.1%)
Assemblers and fabricators (3.7%)
Driver/sales workers and truck drivers (3.6%)
Laborers and material movers, hand (3.4%)
Other production occupations, including supervisors (10.4%)
Metal workers and plastic workers (10.3%)
Driver/sales workers and truck drivers (6.2%)
Material recording, scheduling, dispatching, and distributing workers (5.4%)
Laborers and material movers, hand (4.3%)
Assemblers and fabricators (4.1%)
Other material moving workers, except laborers (4.1%)
Other production occupations, including supervisors (6.8%)
Other office and administrative support workers, including supervisors (6.8%)
Secretaries and administrative assistants (4.9%)
Material recording, scheduling, dispatching, and distributing workers (4.1%)
Registered nurses (3.8%)
Financial clerks, except bookkeeping, accounting and auditing clerks (3.4%)
Building and grounds cleaning and maintenance occupations (3.4%)
Tornado activity:
Shelby-area historical tornado activity is near Ohio state average. It is 28% greater than the overall U.S. average.
On 4/11/1965, a category F4 (max. wind speeds 207-260 mph) tornado 32.0 miles away from the Shelby city center killed 18 people and injured 200 people and caused between $5,000,000 and $50,000,000 in damages.
On 5/10/1973, a category F3 (max. wind speeds 158-206 mph) tornado 13.1 miles away from the city center killed 6 people and injured 100 people and caused between $500,000 and $5,000,000 in damages.
Earthquake activity:
Shelby-area historical earthquake activity is significantly above Ohio state average. It is 34% smaller than the overall U.S. average. On 9/25/1998 at 19:52:52, a magnitude 5.2 (4.8 MB, 4.3 MS, 5.2 LG, 4.5 MW, Depth: 3.1 mi, Class: Moderate, Intensity: VI - VII) earthquake occurred 125.1 miles away from the city center On 1/31/1986 at 16:46:43, a magnitude 5.0 (5.0 MB) earthquake occurred 92.4 miles away from the city center On 7/27/1980 at 18:52:21, a magnitude 5.2 (5.1 MB, 4.7 MS, 5.0 UK, 5.2 UK) earthquake occurred 197.6 miles away from the city center On 8/23/2011 at 17:51:04, a magnitude 5.8 (5.8 MW, Depth: 3.7 mi) earthquake occurred 325.6 miles away from the city center On 7/12/1986 at 08:19:37, a magnitude 4.5 (4.5 MB, Class: Light, Intensity: IV - V) earthquake occurred 92.9 miles away from the city center On 4/18/2008 at 09:36:59, a magnitude 5.4 (5.1 MB, 4.8 MS, 5.4 MW, 5.2 MW) earthquake occurred 325.1 miles away from the city center Magnitude types: regional Lg-wave magnitude (LG), body-wave magnitude (MB), surface-wave magnitude (MS), moment magnitude (MW) Natural disasters: The number of natural disasters in Richland County (14) is near the US average (15).Major Disasters (Presidential) Declared: 8Emergencies Declared: 5Floods: 8, Storms: 7, Tornadoes: 5, Snows: 2, Snowstorms: 2, Blizzard: 1, Hurricane: 1, Mudslide: 1, Wind: 1, Winter Storm: 1, Other: 1 (Note: some incidents may be assigned to more than one category). Hospitals and medical centers in Shelby: MEDCENTRAL HEALTH SYSTEM SHELBY HOSPITAL (Voluntary non-profit - Private, provides emergency services, 199 WEST MAIN STREET) SHELBY HOME AND PUBLIC HEALTH, INC (142 NORTH GAMBLE STREET, SUITE B)
CRESTWOOD CARE CENTER (225 W MAIN STREET)
SHELBY POINTE, INC (100 ROGERS LANE)
Airports located in Shelby:
College/University in Shelby: Pioneer Career and Technology Center Full-time enrollment: 40; Location: 27 Ryan Rd; Public; Website: www.go2pioneer.com)
Colleges/universities with over 2000 students nearest to Shelby:
Ashland University (about 18 miles; Ashland, OH ; Full-time enrollment: 5,151)
Tiffin University (about 32 miles; Tiffin, OH ; FT enrollment: 4,927)
Oberlin College (about 37 miles; Oberlin, OH ; FT enrollment: 2,795)
The College of Wooster (about 39 miles; Wooster, OH ; FT enrollment: 2,112)
Terra State Community College (about 42 miles; Fremont, OH ; FT enrollment: 2,119)
Lorain County Community College (about 48 miles; Elyria, OH ; FT enrollment: 7,690)
The University of Findlay (about 54 miles; Findlay, OH ; FT enrollment: 3,649)
Public high schools in Shelby: SHELBY HIGH SCHOOL Students: 727, Location: 1 WHIPPET WAY, Grades: 9-12)PIONEER CAREER & TECHNOLOGY Location: 27 RYAN RD, Grades: PK-12)
Public elementary/middle schools in Shelby:
Private elementary/middle schools in Shelby: ST MARY'S SCHOOL Students: 111, Location: 26 WEST ST, Grades: PK-6)
SACRED HEART SCHOOL Students: 92, Location: 5754 STATE ROUTE 61 S, Grades: PK-8)
See full list of schools located in Shelby Library in Shelby: MARVIN MEMORIAL LIBRARY Operating income: $595,520; Location: 29 W. WHITNEY; 64,274 books ; 2,385 audio materials ; 3,043 video materials ; 2 local licensed databases ; 266 state licensed databases ; 130 print serial subscriptions )
User-submitted facts and corrections:
WYXZ (98.7 FM; CRESTLINE, OH; Owner: ELYRIA-LORAIN BROADCASTING COMPANY) is no longer in existance added by Bobbi
Notable locations in Shelby: (A) , Shelby Junction (B) , Medic Response Ambulance Service (C) , Shelby Fire Department (D) . Display/hide their locations on the map
Churches in Shelby include: (A) , First Lutheran Church (B) , First United Church of Christ (C) , First United Presbyterian Church (D) , Most Pure Heart of Mary Catholic Church (E) , Saint Marks Episcopal Church (F) . Display/hide their locations on the map
Cemetery: (1) . Display/hide its location on the map
Reservoirs: (A) , Shelby Upground Reservoir Number Two (B) . Display/hide their locations on the map
Parks in Shelby include: (1) , Seltzer Park (2) , McBride Park (3) . Display/hide their locations on the map
Birthplace of: Larry Siegfried - Basketball player, Roger Brucker - Leading cave explorer and author of books about caves, Augustus N. Summers - Ohio Jurist, Larry Baker - Football player.
Richland County has a predicted average indoor radon screening level greater than 4 pCi/L (pico curies per liter) - Highest Potential Drinking water stations with addresses in Shelby and their reported violations in the past:
CORNELL ABRAXAS OHIO (Population served: 130, Groundwater):
Past monitoring violations:
Monitoring, Source Water (GWR) - In JAN-01-2010, Contaminant: E. COLI. Follow-up actions: St Public Notif requested (FEB-12-2010), St Violation/Reminder Notice (FEB-12-2010), St Compliance achieved (APR-01-2010)
Population served: 127, Groundwater):
Past monitoring violations:
One routine major monitoring violation
Population served: 70, Groundwater):
Past health violations:
MCL, Monthly (TCR) - Between JUL-2013 and SEP-2013, Contaminant: Coliform. Follow-up actions: St Public Notif requested (OCT-11-2013), St Violation/Reminder Notice (OCT-11-2013), St Compliance achieved (OCT-15-2013)
Past monitoring violations:
Monitoring, Source Water (GWR) - In SEP-05-2013, Contaminant: E. COLI. Follow-up actions: St Compliance achieved (SEP-16-2013), St Public Notif requested (SEP-20-2013), St Violation/Reminder Notice (SEP-20-2013), St Public Notif received (OCT-30-2013)
Monitoring, Repeat Major (TCR) - Between JUL-2013 and SEP-2013, Contaminant: Coliform (TCR). Follow-up actions: St Compliance achieved (SEP-16-2013), St Public Notif requested (SEP-20-2013), St Violation/Reminder Notice (SEP-20-2013), St Public Notif received (OCT-30-2013)
3 routine major monitoring violations
Drinking water stations with addresses in Shelby that have no violations reported:
TAYLORTOWN COMMUNITY CHURCH (Population served: 80, Primary Water Source Type: Groundwater)
Average household size: This city:
2.3 peopleOhio:
2.4 people
Percentage of family households: This city:
64.2%Whole state:
65.0%
Percentage of households with unmarried partners: This city:
6.5%Whole state:
6.8%
Likely homosexual households (counted as self-reported same-sex unmarried-partner households)
Lesbian couples: 0.3% of all households Gay men: 0.2% of all households
163 people in nursing facilities/skilled-nursing facilities in 2010people in nursing homes in 2000people in local jails and other confinement facilities (including police lockups) in 2000
Banks with branches in Shelby (2011 data):
The Citizens Banking Company: North Gamble Street Branch, Mansfield Avenue Branch, Shelby Main Branch. Info updated 2008/01/02: Bank assets: $1,108.0 mil, Deposits: $909.0 mil, headquarters in Sandusky, OH, positive income , Commercial Lending Specialization, 28 total offices , Holding Company: First Citizens Banc Corp
U.S. Bank National Association: Shelby Branch at 85 West Main Street, branch established on 1982/05/14. Info updated 2012/01/30: Bank assets: $330,470.8 mil, Deposits: $236,091.5 mil, headquarters in Cincinnati, OH, positive income , 3121 total offices , Holding Company: U.S. Bancorp
First Federal Bank of Ohio: Shelby Branch at 200 Mansfield Avenue, branch established on 1891/01/01. Info updated 2011/07/21: Bank assets: $255.5 mil, Deposits: $196.7 mil, headquarters in Galion, OH, negative income in the last year , 9 total offices
The Park National Bank: 0817 Shelby Mansfield Ave Branch at 155 Mansfield Avenue, branch established on 1895/01/01. Info updated 2008/09/29: Bank assets: $6,281.7 mil, Deposits: $4,611.6 mil, headquarters in Newark, OH, positive income , Commercial Lending Specialization, 123 total offices , Holding Company: Park National Corporation
PNC Bank, National Association: Shelby Branch at 29 West Main Street, branch established on 1893/01/01. Info updated 2012/03/20: Bank assets: $263,309.6 mil, Deposits: $197,343.0 mil, headquarters in Wilmington, DE, positive income , Commercial Lending Specialization, 3085 total offices , Holding Company: Pnc Financial Services Group, Inc., The
For population 15 years and over in Shelby:
Never married: 22.8%Now married: 51.0%Separated: 0.5%Widowed: 9.4%Divorced: 16.3% For population 25 years and over in Shelby:
High school or higher: 90.8%Bachelor's degree or higher: 16.5%Graduate or professional degree: 7.1%Unemployed: 4.0%Mean travel time to work (commute): 18.1 minutes
Education Gini index (Inequality in education) Here:
9.1Ohio average:
11.0
Religion statistics for Shelby, OH (based on Richland County data)
Religion Adherents Congregations Evangelical Protestant 27,833 120 Mainline Protestant 12,355 53 Catholic 9,658 5 Black Protestant 1,663 7 Other 1,072 12 Orthodox 100 1 None 71,794 -
Source: Clifford Grammich, Kirk Hadaway, Richard Houseal, Dale E.Jones, Alexei Krindatch, Richie Stanley and Richard H.Taylor. 2012. 2010 U.S.Religion Census: Religious Congregations & Membership Study. Association of Statisticians of American Religious Bodies. Jones, Dale E., et al. 2002. Congregations and Membership in the United States 2000. Nashville, TN: Glenmary Research Center. Graphs represent county-level data
Food Environment Statistics: Number of grocery stores : 23Richland County :
1.83 / 10,000 pop.Ohio :
1.89 / 10,000 pop.
Number of supercenters and club stores : 2Richland County :
0.16 / 10,000 pop.Ohio :
0.13 / 10,000 pop.
Number of convenience stores (no gas) : 13Richland County :
1.03 / 10,000 pop.Ohio :
1.25 / 10,000 pop.
Number of convenience stores (with gas) : 36Richland County :
2.86 / 10,000 pop.Ohio :
2.93 / 10,000 pop.
Number of full-service restaurants : 92This county :
7.31 / 10,000 pop.Ohio :
6.25 / 10,000 pop.
Adult diabetes rate : Richland County :
10.8%Ohio :
10.3%
Adult obesity rate : Richland County :
29.3%Ohio :
29.1%
Low-income preschool obesity rate : Richland County :
10.5%Ohio :
11.9%
Health and Nutrition:
Average overall health of teeth and gums : This city:
47.5%Ohio:
47.8%
People feeling badly about themselves : People not drinking alcohol at all : Average hours sleeping at night : Overweight people : This city:
31.7%Ohio:
34.3%
General health condition : Average condition of hearing : More about Health and Nutrition of Shelby, OH Residents
Local government employment and payroll (March 2022)
Function
Full-time employees
Monthly full-time payroll
Average yearly full-time wage
Part-time employees
Monthly part-time payroll
Firefighters
14 $71,329 $61,139 10 $1,034 Police Protection - Officers
14 $84,741 $72,635 0 $0 Electric Power
9 $48,940 $65,253 0 $0 Sewerage
8 $39,516 $59,274 0 $0 Financial Administration
7 $30,059 $51,530 0 $0 Other Government Administration
6 $30,077 $60,154 5 $1,523 Judicial and Legal
6 $20,985 $41,970 2 $5,496 Streets and Highways
6 $28,190 $56,380 0 $0 Water Supply
5 $31,492 $75,581 0 $0 Other and Unallocable
4 $20,690 $62,070 0 $0 Health
3 $16,012 $64,048 1 $853 Police - Other
3 $27,121 $108,484 0 $0 Parks and Recreation
0 $0 1 $2,143
Totals for Government
85 $449,150 $63,409 19 $11,049
Shelby government finances - Expenditure in 2021 (per resident):
Assistance and Subsidies - Public Welfare, Federal Categorical Assistance Programs: $417,000 ($44.95)
Construction - Sewerage: $1,019,000 ($109.83)
Electric Utilities: $650,000 ($70.06)Water Utilities: $611,000 ($65.85)Police Protection: $336,000 ($36.21)Parks and Recreation: $110,000 ($11.86)Judicial and Legal Services: $13,000 ($1.40)Current Operations - Electric Utilities: $10,604,000 ($1142.92)
General - Other: $2,599,000 ($280.13)Police Protection: $1,793,000 ($193.25)Water Utilities: $1,734,000 ($186.89)Sewerage: $1,325,000 ($142.81)Regular Highways: $1,187,000 ($127.94)Local Fire Protection: $1,095,000 ($118.02)Judicial and Legal Services: $495,000 ($53.35)Financial Administration: $489,000 ($52.71)Health - Other: $400,000 ($43.11)Central Staff Services: $321,000 ($34.60)Parks and Recreation: $184,000 ($19.83)Transit Utilities: $25,000 ($2.69)Public Welfare - Other: $25,000 ($2.69)Corrections - Other: $19,000 ($2.05)General Public Buildings: $17,000 ($1.83)General - Interest on Debt: $238,000 ($25.65)
Other Capital Outlay - Police Protection: $172,000 ($18.54)
Local Fire Protection: $161,000 ($17.35)Electric Utilities: $67,000 ($7.22)Sewerage: $45,000 ($4.85)Regular Highways: $37,000 ($3.99)Parks and Recreation: $32,000 ($3.45)Water Utilities: $24,000 ($2.59)Judicial and Legal Services: $8,000 ($0.86)Total Salaries and Wages: $5,282,000 ($569.30)
Water Utilities - Interest on Debt: $10,000 ($1.08)
Shelby government finances - Revenue in 2021 (per resident):
Charges - Sewerage: $1,833,000 ($197.56)
Other: $998,000 ($107.57)Parks and Recreation: $46,000 ($4.96)Solid Waste Management: $44,000 ($4.74)Local Intergovernmental - Other: $815,000 ($87.84)
Health and Hospitals: $220,000 ($23.71)General Local Government Support: $62,000 ($6.68)Transit Utilities: $14,000 ($1.51)Miscellaneous - General Revenue - Other: $2,855,000 ($307.72)
Fines and Forfeits: $198,000 ($21.34)Interest Earnings: $109,000 ($11.75)Donations From Private Sources: $37,000 ($3.99)Rents: $28,000 ($3.02)Revenue - Electric Utilities: $10,079,000 ($1086.33)
Water Utilities: $2,325,000 ($250.59)Transit Utilities: $1,000 ($0.11)State Intergovernmental - Housing and Community Development: $408,000 ($43.97)
Sewerage: $304,000 ($32.77)Other: $145,000 ($15.63)Health and Hospitals: $78,000 ($8.41)Highways: $75,000 ($8.08)Tax - Individual Income: $3,502,000 ($377.45)
Property: $751,000 ($80.94)Public Utilities Sales: $390,000 ($42.03)Corporation Net Income: $343,000 ($36.97)Motor Vehicle License: $136,000 ($14.66)General Sales and Gross Receipts: $80,000 ($8.62)Occupation and Business License - Other: $32,000 ($3.45)Other License: $22,000 ($2.37)Alcoholic Beverage License: $9,000 ($0.97)Other Selective Sales: $3,000 ($0.32)Tobacco Products Sales: $2,000 ($0.22)
Shelby government finances - Debt in 2021 (per resident):
Long Term Debt - Outstanding Unspecified Public Purpose: $14,620,000 ($1575.77)
Issue, Unspecified Public Purpose: $9,505,000 ($1024.47)Beginning Outstanding - Unspecified Public Purpose: $6,107,000 ($658.22)Retired Unspecified Public Purpose: $991,000 ($106.81)
Shelby government finances - Cash and Securities in 2021 (per resident):
Bond Funds - Cash and Securities: $5,227,000 ($563.38)
Other Funds - Cash and Securities: $14,792,000 ($1594.31)
Businesses in Shelby, OH
Name Count Name Count
Advance Auto Parts 1 KFC 1 Burger King 1 MasterBrand Cabinets 2 Chevrolet 1 McDonald's 1 Curves 1 Rite Aid 1 Domino's Pizza 1 Subway 1 FedEx 1 U-Haul 1 Ford 1 UPS 3 GNC 1 Wendy's 1 H&R Block 1 YMCA 1
Strongest AM radio stations in Shelby:
WKNR (850 AM; 50 kW; CLEVELAND, OH; Owner: CARON BROADCASTING, INC.)
WTAM (1100 AM; 50 kW; CLEVELAND, OH; Owner: JACOR BROADCASTING CORPORATION)
WHK (1220 AM; 50 kW; CLEVELAND, OH; Owner: CARON BROADCASTING, INC.)
WRGM (1440 AM; 1 kW; ONTARIO, OH; Owner: GSM MEDIA CORPORATION)
WTVN (610 AM; 50 kW; COLUMBUS, OH; Owner: CITICASTERS LICENSES, L.P.)
WJR (760 AM; 50 kW; DETROIT, MI; Owner: ABC, INC.)
WMAN (1400 AM; 1 kW; MANSFIELD, OH; Owner: CAPSTAR TX LIMITED PARTNERSHIP)
WFDF (910 AM; 50 kW; FLINT, MI; Owner: ABC, INC.)
WDFN (1130 AM; 50 kW; DETROIT, MI; Owner: AMFM RADIO LICENSES, L.L.C.)
WRFD (880 AM; daytime; 23 kW; COLUMBUS-WORTHINGTON, OH; Owner: SALEM MEDIA OF OHIO, INC.)
WCHB (1200 AM; 50 kW; TAYLOR, MI; Owner: RADIO ONE OF DETROIT, LLC)
WWJ (950 AM; 50 kW; DETROIT, MI; Owner: INFINITY BROADCASTING OPERATIONS, INC.)
WWVA (1170 AM; 53 kW; WHEELING, WV; Owner: CAPSTAR TX LIMITED PARTNERSHIP)
Strongest FM radio stations in Shelby:
WAUI (88.3 FM; SHELBY, OH; Owner: AMERICAN FAMILY ASSOCIATION)
WSWR (100.1 FM; SHELBY, OH; Owner: CAPSTAR TX LIMITED PARTNERSHIP)
WLRD (96.9 FM; WILLARD, OH; Owner: CHRISTIAN FAITH BROADCAST, INC.)
WVNO-FM (106.1 FM; MANSFIELD, OH; Owner: JOHNNY APPLESEED BROADCASTING CO.)
WYXZ (98.7 FM; CRESTLINE, OH; Owner: ELYRIA-LORAIN BROADCASTING COMPANY)
WFXN-FM (102.3 FM; GALION, OH; Owner: CAPSTAR TX LIMITED PARTNERSHIP)
WYHT (105.3 FM; MANSFIELD, OH; Owner: CAPSTAR TX LIMITED PARTNERSHIP)
WNCO-FM (101.3 FM; ASHLAND, OH; Owner: CAPSTAR TX LIMITED PARTNERSHIP)
WOSV (91.7 FM; MANSFIELD, OH; Owner: THE OHIO STATE UNIVERSITY)
WVMC-FM (90.7 FM; MANSFIELD, OH; Owner: MANSFIELD CHRISTIAN SCHOOL)
WQEL (92.7 FM; BUCYRUS, OH; Owner: ANCHOR BROADCASTING COMPANY)
WWBK (98.3 FM; FREDERICKTOWN, OH; Owner: CAPSTAR TX LIMITED PARTNERSHIP)
WGGN (97.7 FM; CASTALIA, OH; Owner: CHRISTIAN FAITH BROADCAST, INC.)
WVXG (95.1 FM; MOUNT GILEAD, OH; Owner: XAVIER UNIVERSITY)
WRDL (88.9 FM; ASHLAND, OH; Owner: ASHLAND UNIVERSITY)
TV broadcast stations around Shelby:
WMFD-TV (Channel 68; MANSFIELD, OH; Owner: MID-STATE TELEVISION,INC.)
WOHZ-LP (Channel 57; MANSFIELD, OH; Owner: MID-STATE TELEVISION, INC.)
W54AF (Channel 54; BUCYRUS, OH; Owner: CRAWFORD BROADCASTING. COMPANY, INC.)
W33BW (Channel 33; ASHLAND, OH; Owner: CHRISTIAN FAITH BROADCAST, INC.)
W32AR (Channel 32; LEXINGTON, OH; Owner: TRINITY BROADCASTING NETWORK)
WGGN-TV (Channel 52; SANDUSKY, OH; Owner: CHRISTIAN FAITH BROADCAST, INC.)
WBKA-LP (Channel 22; BUCYRUS, OH; Owner: CRAWFORD BROADCASTING CO., INC.)
National Bridge Inventory (NBI) Statistics 36 Number of bridges285ft / 87.1m Total length $344,846,000 Total costs112,510 Total average daily traffic11,822 Total average daily truck traffic157,968 Total future (year 2010) average daily traffic
New bridges - historical statistics
1 1900-1909 3 1940-1949 2 1950-1959 3 1960-1969 2 1970-1979 7 1980-1989 8 1990-1999 6 2000-2009 2 2010-2019 2 2020-2022
See full National Bridge Inventory statistics for Shelby, OH
Home Mortgage Disclosure Act Aggregated Statistics For Year 2009(Based on 1 partial tract) A) FHA, FSA/RHS & VA B) Conventional C) Refinancings D) Home Improvement Loans F) Non-occupant Loans on G) Loans On Manufactured Number Average Value Number Average Value Number Average Value Number Average Value Number Average Value Number Average Value
LOANS ORIGINATED 12 $66,778 4 $56,575 46 $89,451 5 $14,862 5 $37,830 1 $58,260 APPLICATIONS APPROVED, NOT ACCEPTED 0 $0 2 $53,620 6 $105,972 1 $7,600 0 $0 0 $0 APPLICATIONS DENIED 3 $59,953 3 $31,523 23 $83,779 3 $22,800 2 $43,485 0 $0 APPLICATIONS WITHDRAWN 2 $57,420 0 $0 5 $104,536 1 $85,280 0 $0 0 $0 FILES CLOSED FOR INCOMPLETENESS 1 $16,040 0 $0 3 $68,677 0 $0 0 $0 0 $0
Aggregated Statistics For Year 2008(Based on 1 partial tract) A) FHA, FSA/RHS & VA B) Conventional C) Refinancings D) Home Improvement Loans F) Non-occupant Loans on G) Loans On Manufactured Number Average Value Number Average Value Number Average Value Number Average Value Number Average Value Number Average Value
LOANS ORIGINATED 14 $75,514 17 $58,711 24 $83,560 15 $17,901 8 $47,709 1 $12,670 APPLICATIONS APPROVED, NOT ACCEPTED 2 $72,620 4 $62,485 3 $118,780 1 $61,640 2 $110,615 0 $0 APPLICATIONS DENIED 2 $50,665 3 $43,627 30 $97,134 7 $38,119 4 $75,785 1 $30,400 APPLICATIONS WITHDRAWN 1 $57,420 2 $48,130 8 $88,768 1 $5,910 1 $54,890 0 $0 FILES CLOSED FOR INCOMPLETENESS 0 $0 1 $84,440 3 $77,123 1 $52,350 0 $0 0 $0
Aggregated Statistics For Year 2007(Based on 1 partial tract) A) FHA, FSA/RHS & VA B) Conventional C) Refinancings D) Home Improvement Loans E) Loans on Dwellings For 5+ Families F) Non-occupant Loans on G) Loans On Manufactured Number Average Value Number Average Value Number Average Value Number Average Value Number Average Value Number Average Value Number Average Value
LOANS ORIGINATED 6 $92,462 42 $77,062 48 $75,363 12 $40,038 0 $0 16 $56,891 2 $22,375 APPLICATIONS APPROVED, NOT ACCEPTED 1 $55,730 5 $99,302 12 $92,743 2 $14,775 0 $0 4 $126,660 0 $0 APPLICATIONS DENIED 2 $89,505 23 $71,627 71 $81,479 22 $37,345 1 $211,100 9 $113,056 3 $42,220 APPLICATIONS WITHDRAWN 0 $0 2 $78,950 19 $88,573 3 $30,960 0 $0 2 $90,775 0 $0 FILES CLOSED FOR INCOMPLETENESS 1 $74,310 3 $60,233 6 $86,552 1 $8,440 0 $0 1 $76,000 0 $0
Aggregated Statistics For Year 2006(Based on 1 partial tract) A) FHA, FSA/RHS & VA B) Conventional C) Refinancings D) Home Improvement Loans F) Non-occupant Loans on G) Loans On Manufactured Number Average Value Number Average Value Number Average Value Number Average Value Number Average Value Number Average Value
LOANS ORIGINATED 7 $107,600 64 $72,579 49 $77,426 15 $35,296 22 $74,154 2 $117,795 APPLICATIONS APPROVED, NOT ACCEPTED 0 $0 7 $50,906 13 $67,812 3 $30,960 2 $32,930 1 $17,730 APPLICATIONS DENIED 1 $36,310 18 $75,949 60 $75,630 17 $41,475 6 $47,568 1 $38,000 APPLICATIONS WITHDRAWN 0 $0 7 $92,160 29 $82,984 4 $79,162 3 $74,590 0 $0 FILES CLOSED FOR INCOMPLETENESS 0 $0 3 $106,113 6 $69,945 1 $24,490 0 $0 0 $0
Aggregated Statistics For Year 2005(Based on 1 partial tract) A) FHA, FSA/RHS & VA B) Conventional C) Refinancings D) Home Improvement Loans E) Loans on Dwellings For 5+ Families F) Non-occupant Loans on G) Loans On Manufactured Number Average Value Number Average Value Number Average Value Number Average Value Number Average Value Number Average Value Number Average Value
LOANS ORIGINATED 8 $83,279 62 $85,298 79 $93,835 23 $27,131 0 $0 26 $119,028 0 $0 APPLICATIONS APPROVED, NOT ACCEPTED 3 $92,320 6 $97,107 15 $70,085 4 $25,755 0 $0 1 $49,820 0 $0 APPLICATIONS DENIED 1 $73,460 11 $70,392 65 $82,582 14 $30,881 0 $0 6 $79,655 3 $32,650 APPLICATIONS WITHDRAWN 1 $32,930 6 $92,743 34 $93,008 6 $109,068 1 $50,660 3 $79,373 0 $0 FILES CLOSED FOR INCOMPLETENESS 0 $0 3 $115,963 14 $100,966 0 $0 0 $0 0 $0 0 $0
Aggregated Statistics For Year 2004(Based on 1 partial tract) A) FHA, FSA/RHS & VA B) Conventional C) Refinancings D) Home Improvement Loans F) Non-occupant Loans on G) Loans On Manufactured Number Average Value Number Average Value Number Average Value Number Average Value Number Average Value Number Average Value
LOANS ORIGINATED 4 $95,840 61 $82,779 75 $79,734 14 $42,280 21 $52,956 1 $110,620 APPLICATIONS APPROVED, NOT ACCEPTED 0 $0 8 $75,785 19 $77,507 2 $51,510 1 $33,780 1 $25,330 APPLICATIONS DENIED 0 $0 17 $55,234 65 $82,959 14 $37,395 5 $61,304 7 $31,484 APPLICATIONS WITHDRAWN 2 $70,930 4 $49,398 42 $84,098 3 $83,597 3 $49,820 0 $0 FILES CLOSED FOR INCOMPLETENESS 1 $38,840 3 $42,783 6 $80,077 1 $55,730 2 $50,665 1 $55,730
Aggregated Statistics For Year 2003(Based on 1 partial tract) A) FHA, FSA/RHS & VA B) Conventional C) Refinancings D) Home Improvement Loans F) Non-occupant Loans on Number Average Value Number Average Value Number Average Value Number Average Value Number Average Value
LOANS ORIGINATED 11 $78,145 52 $74,340 203 $72,872 8 $16,571 20 $52,015 APPLICATIONS APPROVED, NOT ACCEPTED 1 $77,680 9 $77,497 22 $79,374 3 $11,540 3 $61,077 APPLICATIONS DENIED 1 $86,130 17 $61,244 80 $75,036 5 $11,484 5 $73,126 APPLICATIONS WITHDRAWN 1 $66,710 5 $60,460 41 $78,117 0 $0 3 $47,850 FILES CLOSED FOR INCOMPLETENESS 0 $0 3 $69,240 8 $101,011 0 $0 1 $169,720
Aggregated Statistics For Year 2002(Based on 1 partial tract) A) FHA, FSA/RHS & VA B) Conventional C) Refinancings D) Home Improvement Loans E) Loans on Dwellings For 5+ Families F) Non-occupant Loans on Number Average Value Number Average Value Number Average Value Number Average Value Number Average Value Number Average Value
LOANS ORIGINATED 11 $81,216 52 $69,939 116 $74,868 9 $18,671 1 $489,750 19 $83,951 APPLICATIONS APPROVED, NOT ACCEPTED 2 $56,155 4 $45,598 24 $84,510 3 $29,273 0 $0 3 $68,960 APPLICATIONS DENIED 0 $0 5 $68,058 88 $77,416 10 $8,697 0 $0 2 $34,620 APPLICATIONS WITHDRAWN 2 $76,840 6 $66,285 38 $82,462 0 $0 0 $0 2 $46,865 FILES CLOSED FOR INCOMPLETENESS 1 $103,860 2 $33,775 15 $96,487 0 $0 0 $0 1 $50,660
Aggregated Statistics For Year 2001(Based on 1 partial tract) A) FHA, FSA/RHS & VA B) Conventional C) Refinancings D) Home Improvement Loans E) Loans on Dwellings For 5+ Families F) Non-occupant Loans on Number Average Value Number Average Value Number Average Value Number Average Value Number Average Value Number Average Value
LOANS ORIGINATED 9 $73,369 42 $61,722 128 $68,337 14 $17,611 1 $47,290 19 $58,086 APPLICATIONS APPROVED, NOT ACCEPTED 0 $0 7 $51,387 18 $66,426 6 $15,903 0 $0 0 $0 APPLICATIONS DENIED 3 $58,827 18 $46,067 69 $66,744 14 $9,107 0 $0 2 $45,175 APPLICATIONS WITHDRAWN 1 $62,490 3 $63,610 46 $69,792 3 $35,747 0 $0 0 $0 FILES CLOSED FOR INCOMPLETENESS 0 $0 2 $65,020 8 $59,319 1 $42,220 0 $0 0 $0
Aggregated Statistics For Year 2000(Based on 1 partial tract) A) FHA, FSA/RHS & VA B) Conventional C) Refinancings D) Home Improvement Loans F) Non-occupant Loans on Number Average Value Number Average Value Number Average Value Number Average Value Number Average Value
LOANS ORIGINATED 8 $78,212 62 $71,760 69 $57,346 10 $13,342 11 $45,828 APPLICATIONS APPROVED, NOT ACCEPTED 0 $0 5 $64,006 17 $60,052 6 $6,897 1 $49,820 APPLICATIONS DENIED 0 $0 24 $57,384 66 $61,334 17 $17,385 5 $42,052 APPLICATIONS WITHDRAWN 0 $0 10 $43,909 30 $56,744 3 $25,050 3 $37,153 FILES CLOSED FOR INCOMPLETENESS 1 $93,730 3 $100,203 7 $53,317 0 $0 0 $0
Aggregated Statistics For Year 1999(Based on 1 partial tract) A) FHA, FSA/RHS & VA B) Conventional C) Refinancings D) Home Improvement Loans E) Loans on Dwellings For 5+ Families F) Non-occupant Loans on Number Average Value Number Average Value Number Average Value Number Average Value Number Average Value Number Average Value
LOANS ORIGINATED 9 $65,201 66 $80,274 101 $59,098 24 $19,973 1 $104,940 13 $42,492 APPLICATIONS APPROVED, NOT ACCEPTED 0 $0 6 $63,242 31 $62,069 3 $6,997 0 $0 2 $23,925 APPLICATIONS DENIED 3 $70,797 10 $62,963 50 $61,250 11 $15,035 0 $0 3 $45,333 APPLICATIONS WITHDRAWN 1 $65,480 8 $68,314 30 $53,112 5 $19,476 0 $0 1 $80,590 FILES CLOSED FOR INCOMPLETENESS 0 $0 1 $60,440 20 $37,274 0 $0 0 $0 10 $22,583
Detailed HMDA statistics for the following Tracts:
0026.00
Private Mortgage Insurance Companies Aggregated Statistics For Year 2009(Based on 1 partial tract) A) Conventional B) Refinancings Number Average Value Number Average Value
LOANS ORIGINATED 1 $65,860 3 $135,667 APPLICATIONS APPROVED, NOT ACCEPTED 1 $68,400 1 $81,060 APPLICATIONS DENIED 0 $0 0 $0 APPLICATIONS WITHDRAWN 0 $0 0 $0 FILES CLOSED FOR INCOMPLETENESS 0 $0 0 $0
Aggregated Statistics For Year 2008(Based on 1 partial tract) A) Conventional B) Refinancings Number Average Value Number Average Value
LOANS ORIGINATED 3 $43,347 3 $95,980 APPLICATIONS APPROVED, NOT ACCEPTED 1 $22,800 2 $63,750 APPLICATIONS DENIED 0 $0 0 $0 APPLICATIONS WITHDRAWN 0 $0 0 $0 FILES CLOSED FOR INCOMPLETENESS 0 $0 0 $0
Aggregated Statistics For Year 2007(Based on 1 partial tract) A) Conventional B) Refinancings Number Average Value Number Average Value
LOANS ORIGINATED 9 $74,494 6 $113,290 APPLICATIONS APPROVED, NOT ACCEPTED 3 $74,307 3 $91,757 APPLICATIONS DENIED 0 $0 1 $53,200 APPLICATIONS WITHDRAWN 2 $30,400 1 $64,170 FILES CLOSED FOR INCOMPLETENESS 0 $0 0 $0
Aggregated Statistics For Year 2006(Based on 1 partial tract) A) Conventional B) Refinancings C) Non-occupant Loans on Number Average Value Number Average Value Number Average Value
LOANS ORIGINATED 20 $80,134 4 $101,750 0 $0 APPLICATIONS APPROVED, NOT ACCEPTED 3 $51,790 3 $72,620 1 $73,460 APPLICATIONS DENIED 1 $67,550 0 $0 0 $0 APPLICATIONS WITHDRAWN 1 $99,640 0 $0 0 $0 FILES CLOSED FOR INCOMPLETENESS 0 $0 0 $0 0 $0
Aggregated Statistics For Year 2005(Based on 1 partial tract) A) Conventional B) Refinancings C) Non-occupant Loans on Number Average Value Number Average Value Number Average Value
LOANS ORIGINATED 12 $108,505 6 $93,165 1 $27,020 APPLICATIONS APPROVED, NOT ACCEPTED 1 $190,830 2 $118,215 0 $0 APPLICATIONS DENIED 0 $0 1 $38,840 0 $0 APPLICATIONS WITHDRAWN 0 $0 0 $0 0 $0 FILES CLOSED FOR INCOMPLETENESS 0 $0 0 $0 0 $0
Aggregated Statistics For Year 2004(Based on 1 partial tract) A) Conventional B) Refinancings C) Non-occupant Loans on Number Average Value Number Average Value Number Average Value
LOANS ORIGINATED 16 $83,912 14 $80,158 1 $54,890 APPLICATIONS APPROVED, NOT ACCEPTED 6 $108,505 3 $78,530 1 $47,290 APPLICATIONS DENIED 0 $0 1 $54,040 1 $54,040 APPLICATIONS WITHDRAWN 0 $0 1 $69,240 0 $0 FILES CLOSED FOR INCOMPLETENESS 0 $0 0 $0 0 $0
Aggregated Statistics For Year 2003(Based on 1 partial tract) A) Conventional B) Refinancings C) Non-occupant Loans on Number Average Value Number Average Value Number Average Value
LOANS ORIGINATED 15 $82,132 16 $95,522 2 $46,440 APPLICATIONS APPROVED, NOT ACCEPTED 3 $59,670 11 $98,488 1 $32,930 APPLICATIONS DENIED 1 $93,730 0 $0 0 $0 APPLICATIONS WITHDRAWN 1 $32,930 0 $0 1 $32,930 FILES CLOSED FOR INCOMPLETENESS 0 $0 0 $0 0 $0
Aggregated Statistics For Year 2002(Based on 1 partial tract) A) Conventional B) Refinancings C) Non-occupant Loans on Number Average Value Number Average Value Number Average Value
LOANS ORIGINATED 19 $75,152 16 $97,317 1 $58,260 APPLICATIONS APPROVED, NOT ACCEPTED 2 $60,795 3 $63,330 1 $52,350 APPLICATIONS DENIED 1 $52,350 0 $0 0 $0 APPLICATIONS WITHDRAWN 0 $0 5 $80,386 2 $72,195 FILES CLOSED FOR INCOMPLETENESS 0 $0 0 $0 0 $0
Aggregated Statistics For Year 2001(Based on 1 partial tract) A) Conventional B) Refinancings C) Non-occupant Loans on Number Average Value Number Average Value Number Average Value
LOANS ORIGINATED 13 $74,177 14 $82,691 0 $0 APPLICATIONS APPROVED, NOT ACCEPTED 2 $56,575 3 $92,883 0 $0 APPLICATIONS DENIED 1 $44,750 1 $46,440 1 $46,440 APPLICATIONS WITHDRAWN 1 $33,780 0 $0 0 $0 FILES CLOSED FOR INCOMPLETENESS 0 $0 1 $46,440 0 $0
Aggregated Statistics For Year 2000(Based on 1 partial tract) A) Conventional B) Refinancings Number Average Value Number Average Value
LOANS ORIGINATED 24 $71,176 8 $80,008 APPLICATIONS APPROVED, NOT ACCEPTED 3 $94,573 0 $0 APPLICATIONS DENIED 1 $72,620 0 $0 APPLICATIONS WITHDRAWN 0 $0 2 $55,730 FILES CLOSED FOR INCOMPLETENESS 0 $0 0 $0
Aggregated Statistics For Year 1999(Based on 1 partial tract) A) Conventional B) Refinancings C) Non-occupant Loans on Number Average Value Number Average Value Number Average Value
LOANS ORIGINATED 14 $67,100 9 $75,928 0 $0 APPLICATIONS APPROVED, NOT ACCEPTED 3 $59,603 1 $42,810 0 $0 APPLICATIONS DENIED 2 $78,075 1 $57,930 1 $52,890 APPLICATIONS WITHDRAWN 1 $46,170 0 $0 0 $0 FILES CLOSED FOR INCOMPLETENESS 1 $40,300 0 $0 0 $0
Detailed PMIC statistics for the following Tracts:
0026.00
Most common first names in Shelby, OH among deceased individuals Name Count Lived (average)
Mary 136 81.1 years Robert 104 71.5 years William 103 73.5 years John 100 75.8 years Charles 81 75.0 years James 70 72.1 years George 63 73.7 years Helen 59 82.2 years Dorothy 55 79.1 years Ruth 55 78.0 years
Most common last names in Shelby, OH among deceased individuals Last name Count Lived (average)
Smith 50 76.9 years Miller 33 76.7 years Johnson 32 78.8 years Clark 30 80.9 years Brown 30 74.5 years Jones 27 75.7 years Lewis 26 74.3 years Metzger 26 79.6 years Dick 25 78.9 years Payne 22 76.6 years
Shelby compared to Ohio state average:
Median house value below state average. Unemployed percentage significantly below state average. Black race population percentage significantly below state average. Hispanic race population percentage below state average. Foreign-born population percentage significantly below state average. Length of stay since moving in significantly above state average. Number of college students significantly below state average.
#21 on the list of "Top 101 cities with largest percentage of males in industries: broadcasting, internet publishing, and telecommunications services (population 5,000+)"
#21 on the list of "Top 101 cities with largest percentage of females in industries: broadcasting, internet publishing, and telecommunications services (population 5,000+)"
#21 on the list of "Top 101 cities with largest percentage of males in industries: wholesale electronic markets and agents and brokers (population 5,000+)"
#21 on the list of "Top 101 cities with largest percentage of females in industries: wholesale electronic markets and agents and brokers (population 5,000+)"
#25 on the list of "Top 101 cities with largest percentage of females in occupations: material moving occupations (population 5,000+)"
#96 on the list of "Top 101 cities with largest percentage of females in occupations: installation, maintenance, and repair occupations (population 5,000+)"
#98 on the list of "Top 100 least racially diverse cities (pop. 5,000+)"
#31 on the list of "Top 101 counties with the lowest percentage of residents relocating from foreign countries between 2010 and 2011"
#62 on the list of "Top 101 counties with the largest increase in the number of deaths per 1000 residents 2000-2006 to 2007-2013 (pop. 50,000+)"
#79 on the list of "Top 101 counties with the lowest percentage of residents relocating from other counties between 2010 and 2011 (pop. 50,000+)"
#81 on the list of "Top 101 counties with the lowest percentage of residents relocating to foreign countries in 2011"
#97 on the list of "Top 101 counties with the largest number of people moving out compared to moving in (pop. 50,000+)"
Top Patent Applicants
Brian White (7)
Richard B. Young (2)
Katherine Hinrichs (1)
Lynn Fetzer-Westmeister (1)
David Higgins (1)
Warren Turner (1)
Reid Lederer (1)
Paul D. Ricciardi (1)
David P. Wallace, Ii (1)
Scott Garverick (1)
Total of 15 patent applications in 2008-2024.

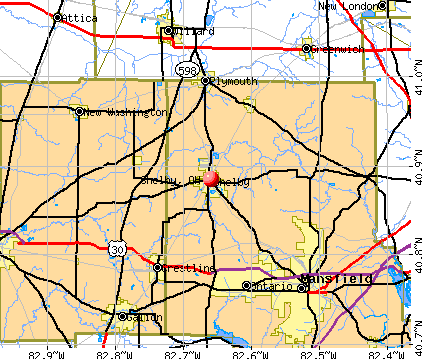


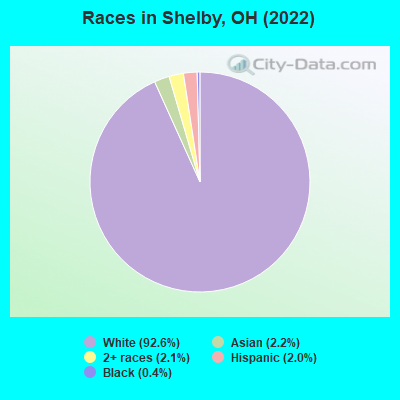
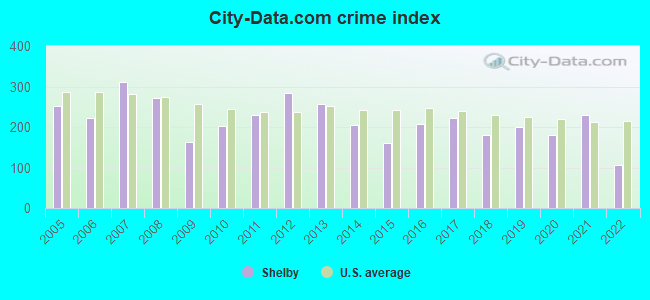
 Recent articles from our blog. Our writers, many of them Ph.D. graduates or candidates, create easy-to-read articles on a wide variety of topics.

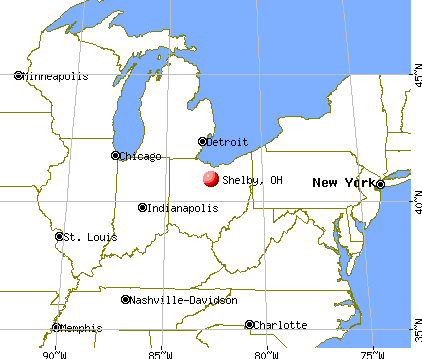
 (44.6 miles
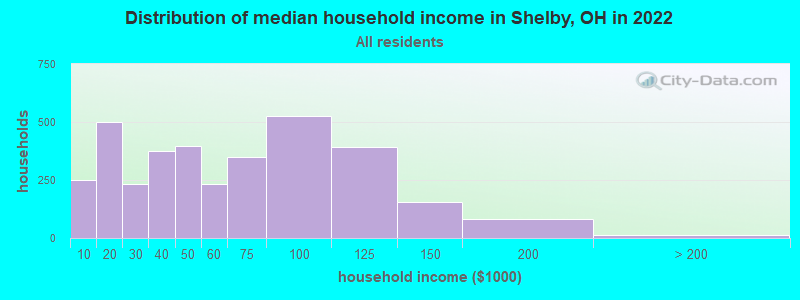
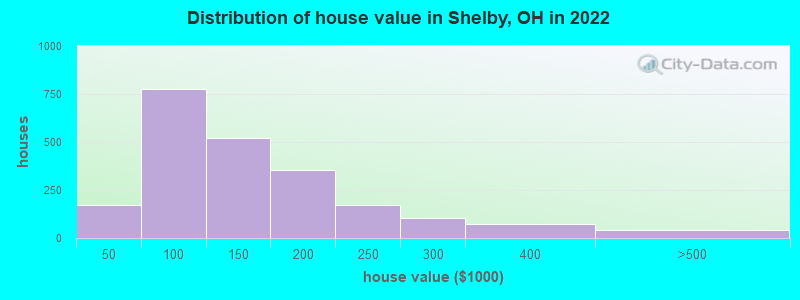
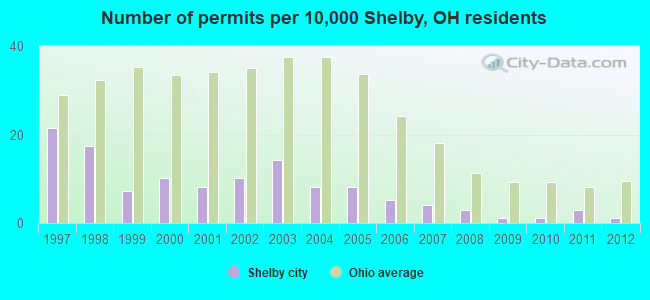
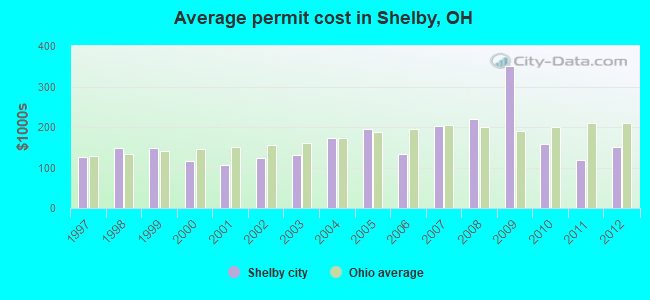
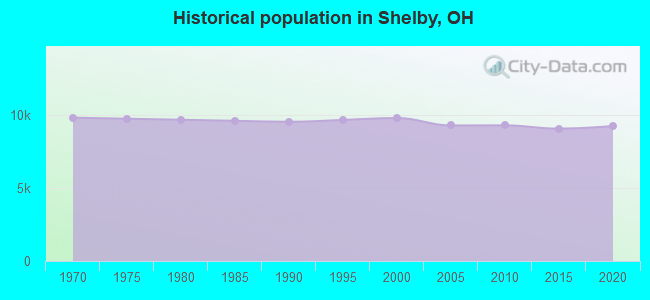
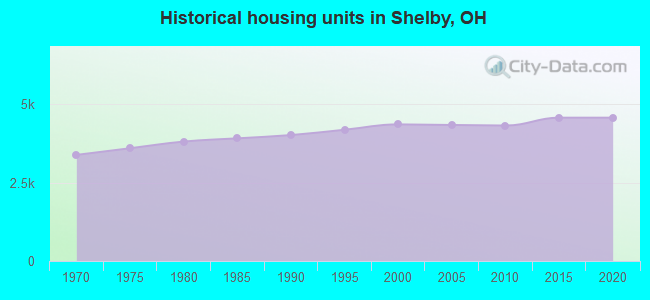
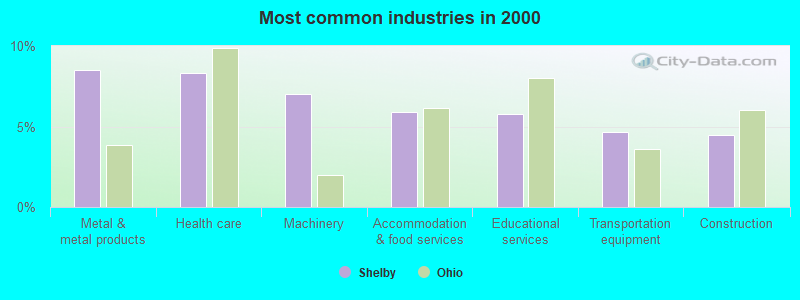
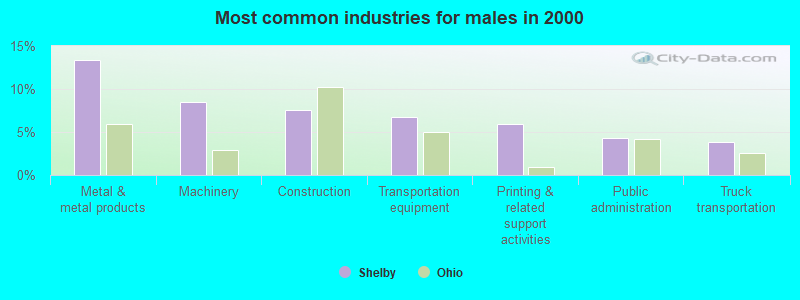
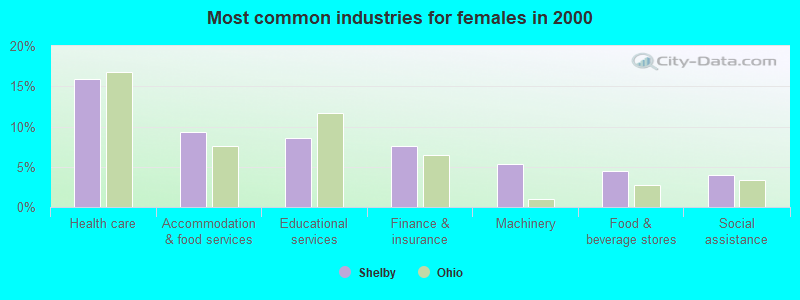
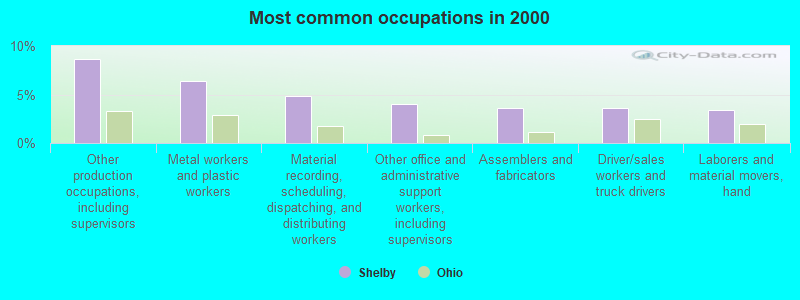
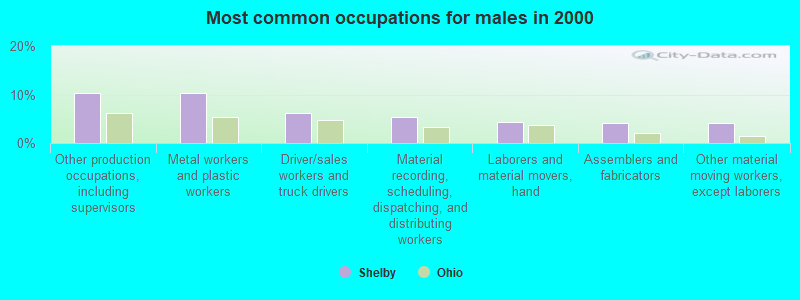
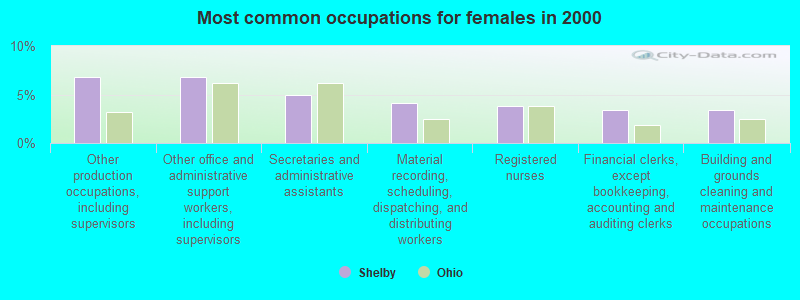


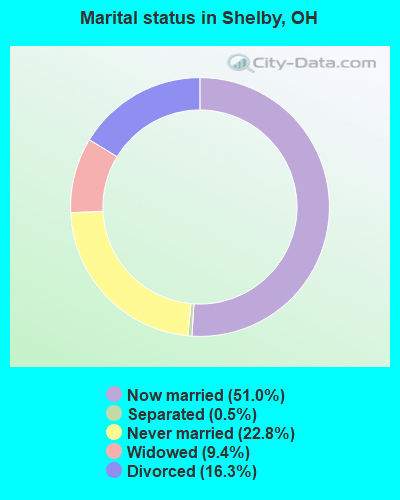
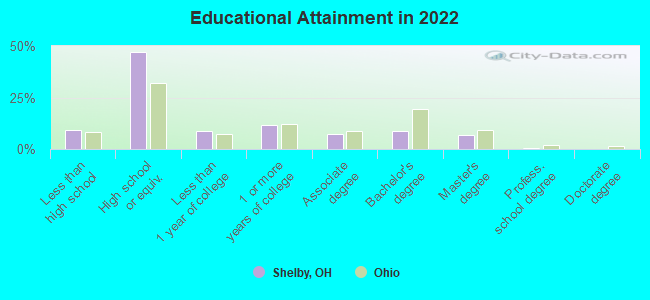
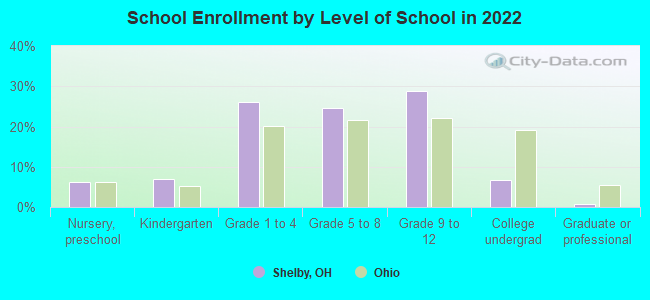
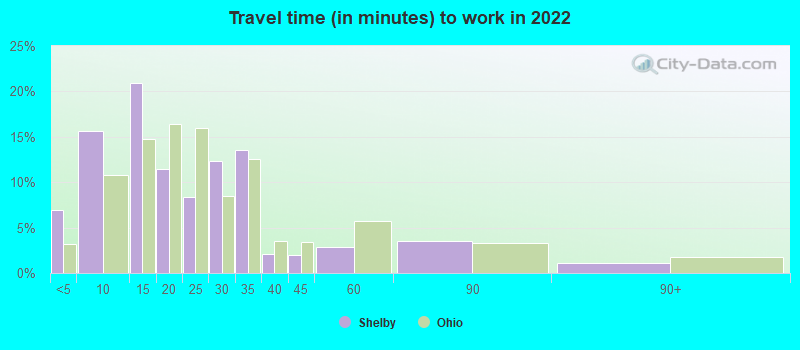
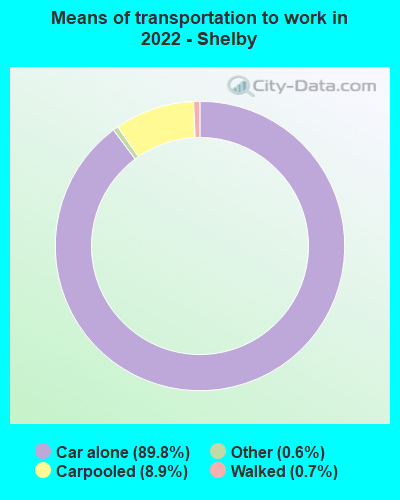
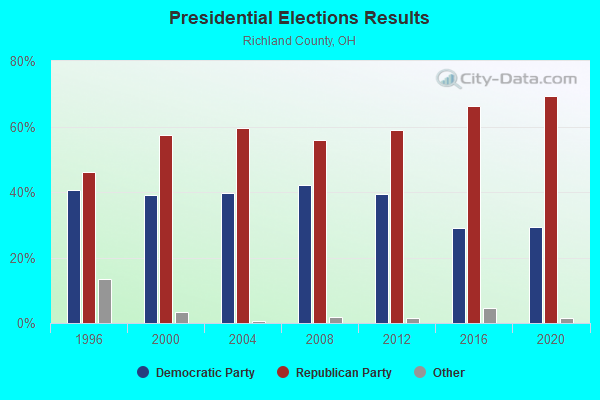
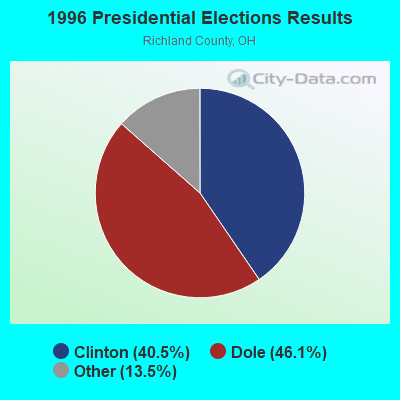
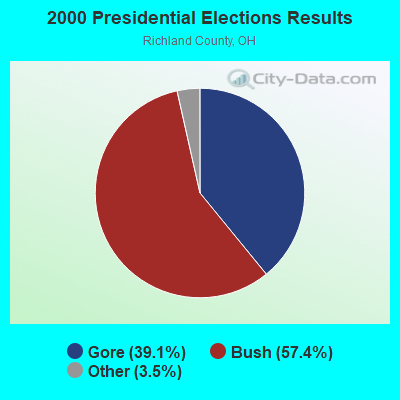
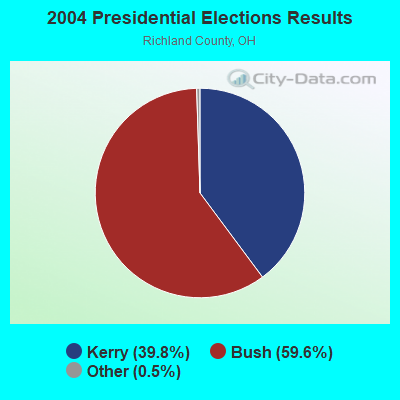
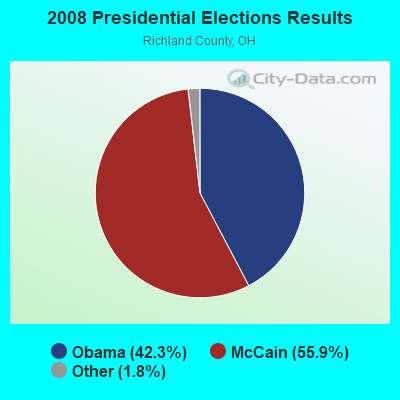
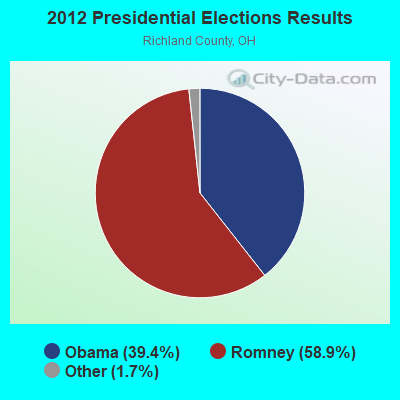
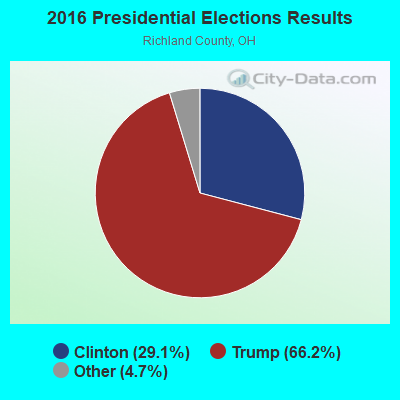
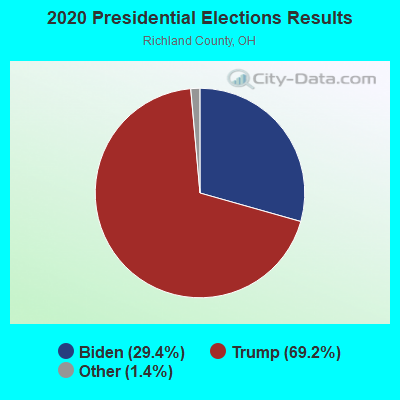
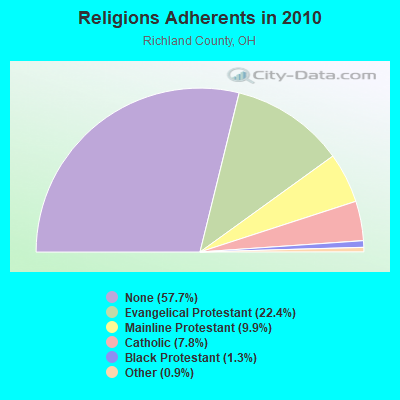
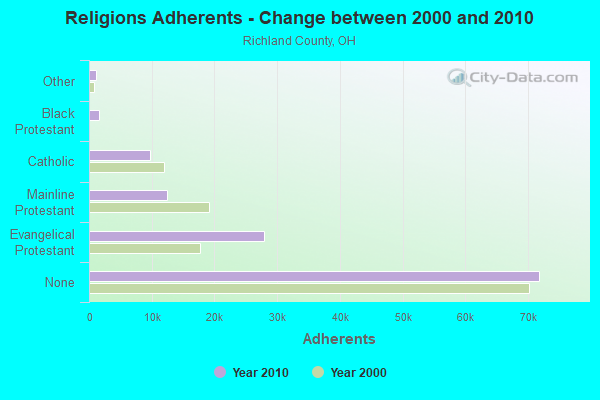
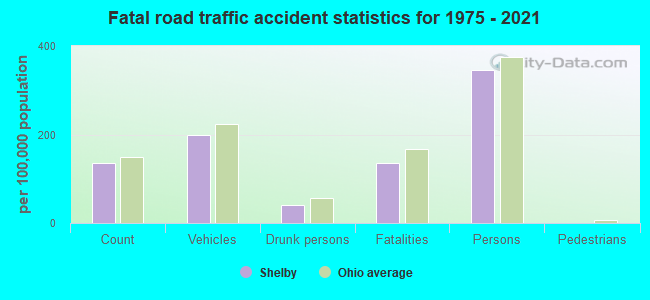
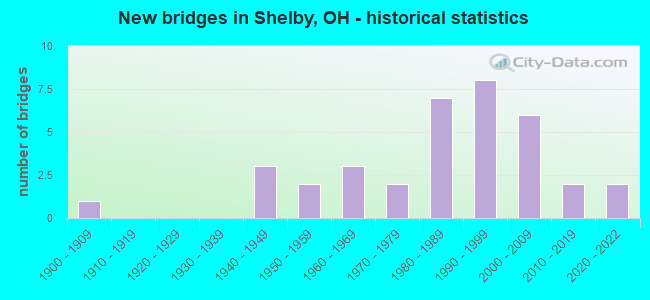
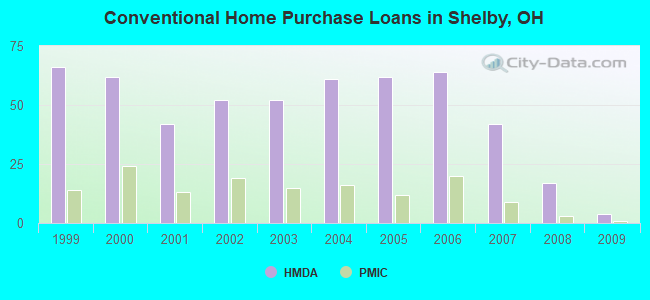
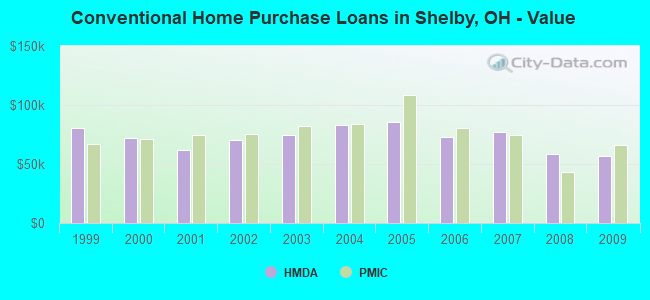
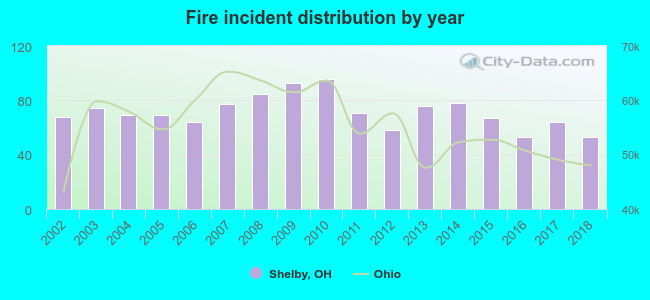 According to the data from the years 2002 - 2018 the average number of fires per year is 71. The highest number of fire incidents - 96 took place in 2010, and the least - 53 in 2016. The data has a decreasing trend.
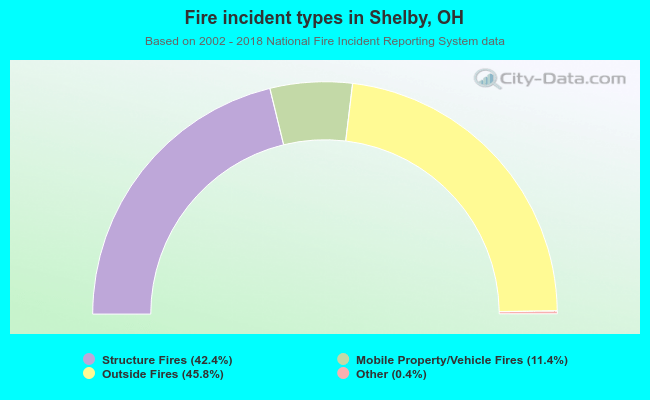 When looking into fire subcategories, the most reports belonged to: Outside Fires (45.8%), and Structure Fires (42.4%).