Estimated zip code population in 2022: 53,823 Zip code population in 2010: 52,822 Zip code population in 2000: 44,895
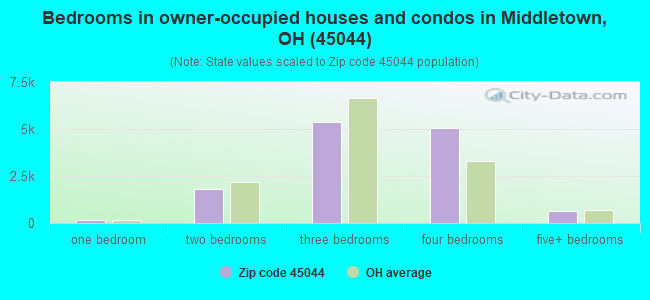
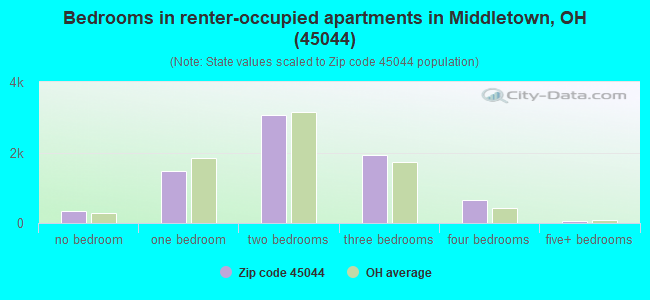
Houses and condos: 22,046 Renter-occupied apartments: 7,514
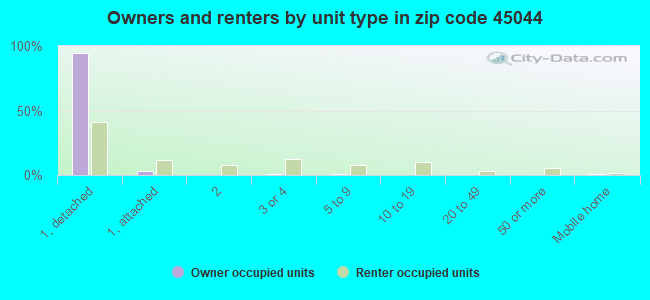
% of renters here:
37%
State:
33%
March 2022 cost of living index in zip code 45044: 88.4 (less than average, U.S. average is 100)
Land area: 38.1 sq. mi. Water area: 0.4 sq. mi.
Population density: 1,412 people per square mile
(low).
OSM Map
General Map
Google Map
MSN Map
OSM Map
General Map
Google Map
MSN Map
OSM Map
General Map
Google Map
MSN Map
OSM Map
General Map
Google Map
MSN Map
Please wait while loading the map...
Real estate property taxes paid for housing units in 2022:
This zip code:
1.3% ($3,061)
Ohio:
1.3% ($2,639)
Median real estate property taxes paid for housing units with mortgages in 2022: $3,406 (1.3%) Median real estate property taxes paid for housing units with no mortgage in 2022: $2,261 (1.5%)
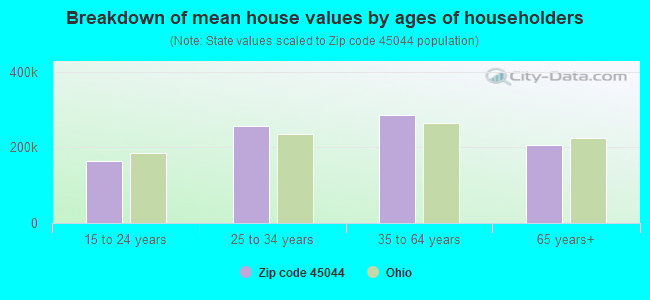
Estimated median house/condo value in 2022: $234,943
45044:
$234,943
Ohio:
$204,100
According to our research of Ohio and other state lists, there were 116 registered sex offenders living in 45044 zip code as of April 27, 2024. The ratio of all residents to sex offenders in zip code 45044 is 464 to 1. The ratio of registered sex offenders to all residents in this zip code is near the state average.
Median resident age:
This zip code:
38.1 years
Ohio median age:
39.9 years
Average household size:
This zip code:
2.6 people
Ohio:
2.4 people
Averages for the 2020 tax year for zip code 45044, filed in 2021:
Average Adjusted Gross Income (AGI) in 2020: $64,728 (Individual Income Tax Returns)
Here:
$64,728
State:
$67,288
Salary/wage: $58,209 (reported on 85.9% of returns)
Here:
$58,209
State:
$55,628
(% of AGI for various income ranges: 1100.7% for AGIs below $25k, 3514.9% for AGIs $25k-50k, 6569.3% for AGIs $50k-75k, 9652.8% for AGIs $75k-100k, 18448.8% for AGIs $100k-200k, 72550.9% for AGIs over 200k)
Taxable interest for individuals: $1,032 (reported on 19.7% of returns)
This zip code:
$1,032
Ohio:
$1,518
(% of AGI for various income ranges: 5.4% for AGIs below $25k, 7.8% for AGIs $25k-50k, 17.9% for AGIs $50k-75k, 45.1% for AGIs $75k-100k, 62.6% for AGIs $100k-200k, 444.1% for AGIs over 200k)
Ordinary dividends: $5,475 (reported on 15.9% of returns)
Here:
$5,475
State:
$7,167
(% of AGI for various income ranges: 10.9% for AGIs below $25k, 21.0% for AGIs $25k-50k, 44.8% for AGIs $50k-75k, 136.4% for AGIs $75k-100k, 263.1% for AGIs $100k-200k, 2593.3% for AGIs over 200k)
Net capital gain/loss in AGI: +$12,604 (reported on 13.2% of returns)
Here:
+$12,604
State:
+$18,919
(% of AGI for various income ranges: 9.5% for AGIs below $25k, 13.7% for AGIs $25k-50k, 63.5% for AGIs $50k-75k, 115.5% for AGIs $75k-100k, 402.2% for AGIs $100k-200k, 6490.7% for AGIs over 200k)
Profit/loss from business: +$12,892 (reported on 13.0% of returns)
Here:
+$12,892
State:
+$13,744
(% of AGI for various income ranges: 101.4% for AGIs below $25k, 115.8% for AGIs $25k-50k, 180.7% for AGIs $50k-75k, 281.5% for AGIs $75k-100k, 529.2% for AGIs $100k-200k, 2222.0% for AGIs over 200k)
Taxable individual retirement arrangement distribution: $21,398 (reported on 6.5% of returns)
45044:
$21,398
Ohio:
$18,876
(% of AGI for various income ranges: 32.6% for AGIs below $25k, 61.8% for AGIs $25k-50k, 142.3% for AGIs $50k-75k, 332.8% for AGIs $75k-100k, 580.3% for AGIs $100k-200k, 2081.5% for AGIs over 200k)
Self-employed (Keogh) retirement plans: $24,022 (reported on 0.4% of returns)
45044:
$24,022
Ohio:
$24,898
(% of AGI for various income ranges: 25.1% for AGIs $100k-200k, 356.5% for AGIs over 200k)
Total itemized deductions: $30,859 (reported on 5.4% of returns)
Here:
$30,859
State:
$33,869
(% of AGI for various income ranges: 18.2% for AGIs below $25k, 40.9% for AGIs $25k-50k, 150.7% for AGIs $50k-75k, 283.8% for AGIs $75k-100k, 754.7% for AGIs $100k-200k, 3397.6% for AGIs over 200k)
Charity contributions: $11,745 (reported on 4.3% of returns)
Here:
$11,745
State:
$14,577
(% of AGI for various income ranges: 1.0% for AGIs below $25k, 6.3% for AGIs $25k-50k, 25.0% for AGIs $50k-75k, 46.9% for AGIs $75k-100k, 225.3% for AGIs $100k-200k, 1421.1% for AGIs over 200k)
Taxes paid: $7,951 (reported on 5.4% of returns)
45044:
$7,951
State:
$7,681
(% of AGI for various income ranges: 1.9% for AGIs below $25k, 7.1% for AGIs $25k-50k, 34.1% for AGIs $50k-75k, 79.9% for AGIs $75k-100k, 224.6% for AGIs $100k-200k, 827.2% for AGIs over 200k)
Earned income credit: $2,559 (reported on 19.4% of returns)
Here:
$2,559
State:
$2,304
(% of AGI for various income ranges: 120.1% for AGIs below $25k, 77.2% for AGIs $25k-50k, 1.4% for AGIs $50k-75k)
Percentage of individuals using paid preparers for their 2020 taxes: 94.7%
Here:
95%
State:
94%
(% for various income ranges: 93.9% for AGIs below $25k, 95.0% for AGIs $25k-50k, 95.9% for AGIs $50k-75k, 95.5% for AGIs $75k-100k, 94.5% for AGIs $100k-200k, 95.9% for AGIs over 200k)
Averages for the 2012 tax year for zip code 45044, filed in 2013:
Average Adjusted Gross Income (AGI) in 2012: $51,838 (Individual Income Tax Returns)
Here:
$51,838
State:
$54,926
Salary/wage: $47,023 (reported on 87.1% of returns)
Here:
$47,023
State:
$45,869
(% of AGI for various income ranges: 76.9% for AGIs below $25k, 79.8% for AGIs $25k-50k, 80.1% for AGIs $50k-75k, 83.3% for AGIs $75k-100k, 84.8% for AGIs $100k-200k, 67.2% for AGIs over 200k)
Taxable interest for individuals: $769 (reported on 23.5% of returns)
This zip code:
$769
Ohio:
$1,297
(% of AGI for various income ranges: 0.4% for AGIs below $25k, 0.4% for AGIs $25k-50k, 0.4% for AGIs $50k-75k, 0.3% for AGIs $75k-100k, 0.3% for AGIs $100k-200k, 0.3% for AGIs over 200k)
Ordinary dividends: $3,269 (reported on 16.2% of returns)
Here:
$3,269
State:
$5,821
(% of AGI for various income ranges: 0.7% for AGIs below $25k, 0.7% for AGIs $25k-50k, 0.7% for AGIs $50k-75k, 0.7% for AGIs $75k-100k, 0.9% for AGIs $100k-200k, 2.1% for AGIs over 200k)
Net capital gain/loss in AGI: +$8,251 (reported on 11.2% of returns)
Here:
+$8,251
State:
+$11,232
(% of AGI for various income ranges: 0.2% for AGIs $25k-50k, 0.2% for AGIs $50k-75k, 0.6% for AGIs $75k-100k, 0.8% for AGIs $100k-200k, 7.5% for AGIs over 200k)
Profit/loss from business: +$12,732 (reported on 12.3% of returns)
Here:
+$12,732
State:
+$12,773
(% of AGI for various income ranges: 8.2% for AGIs below $25k, 2.1% for AGIs $25k-50k, 2.7% for AGIs $50k-75k, 2.0% for AGIs $75k-100k, 2.5% for AGIs $100k-200k, 2.9% for AGIs over 200k)
Taxable individual retirement arrangement distribution: $14,374 (reported on 7.1% of returns)
45044:
$14,374
Ohio:
$14,511
(% of AGI for various income ranges: 1.6% for AGIs below $25k, 1.9% for AGIs $25k-50k, 2.1% for AGIs $50k-75k, 2.3% for AGIs $75k-100k, 2.2% for AGIs $100k-200k, 1.6% for AGIs over 200k)
Self-employment retirement plans: $14,567 (reported on 0.3% of returns)
45044:
$14,567
Ohio:
$20,257
(% of AGI for various income ranges: 0.2% for AGIs $75k-100k, 0.2% for AGIs over 200k)
Total itemized deductions: $20,688 (19% of AGI, reported on 29.9% of returns)
Here:
$20,688
State:
$21,278
Here:
18.8% of AGI
State:
18.8% of AGI
(% of AGI for various income ranges: 4.2% for AGIs below $25k, 7.5% for AGIs $25k-50k, 11.4% for AGIs $50k-75k, 14.4% for AGIs $75k-100k, 15.9% for AGIs $100k-200k, 12.9% for AGIs over 200k)
Charity contributions: $3,480 (reported on 23.4% of returns)
Here:
$3,480
State:
$3,943
(% of AGI for various income ranges: 0.3% for AGIs below $25k, 0.8% for AGIs $25k-50k, 1.3% for AGIs $50k-75k, 1.9% for AGIs $75k-100k, 2.2% for AGIs $100k-200k, 2.0% for AGIs over 200k)
Taxes paid: $8,607 (reported on 29.8% of returns)
45044:
$8,607
State:
$9,568
(% of AGI for various income ranges: 1.0% for AGIs below $25k, 2.1% for AGIs $25k-50k, 4.0% for AGIs $50k-75k, 5.6% for AGIs $75k-100k, 7.1% for AGIs $100k-200k, 6.7% for AGIs over 200k)
Earned income credit: $2,456 (reported on 22.7% of returns)
Here:
$2,456
State:
$2,285
(% of AGI for various income ranges: 9.0% for AGIs below $25k, 1.1% for AGIs $25k-50k)
Percentage of individuals using paid preparers for their 2012 taxes: 49.2%
Here:
49%
State:
51%
(% for various income ranges: 44.5% for AGIs below $25k, 54.1% for AGIs $25k-50k, 56.4% for AGIs $50k-75k, 49.5% for AGIs $75k-100k, 44.9% for AGIs $100k-200k, 67.2% for AGIs over 200k)
Averages for the 2004 tax year for zip code 45044, filed in 2005:
Average Adjusted Gross Income (AGI) in 2004: $43,223 (Individual Income Tax Returns)
Here:
$43,223
State:
$44,480
Salary/wage: $39,758 (reported on 89.6% of returns)
Here:
$39,758
State:
$39,198
(% of AGI for various income ranges: 115.2% for AGIs below $10k, 79.5% for AGIs $10k-25k, 84.2% for AGIs $25k-50k, 87.0% for AGIs $50k-75k, 88.1% for AGIs $75k-100k, 74.4% for AGIs over 100k)
Taxable interest for individuals: $961 (reported on 33.1% of returns)
This zip code:
$961
Ohio:
$1,532
(% of AGI for various income ranges: 2.3% for AGIs below $10k, 1.2% for AGIs $10k-25k, 0.7% for AGIs $25k-50k, 0.6% for AGIs $50k-75k, 0.6% for AGIs $75k-100k, 0.7% for AGIs over 100k)
Taxable dividends: $2,008 (reported on 18.0% of returns)
Here:
$2,008
State:
$3,496
(% of AGI for various income ranges: 2.1% for AGIs below $10k, 0.6% for AGIs $10k-25k, 0.5% for AGIs $25k-50k, 0.6% for AGIs $50k-75k, 0.7% for AGIs $75k-100k, 1.3% for AGIs over 100k)
Net capital gain/loss: +$8,274 (reported on 13.6% of returns)
Here:
+$8,274
State:
+$8,582
(% of AGI for various income ranges: -0.7% for AGIs below $10k, 0.3% for AGIs $10k-25k, 0.3% for AGIs $25k-50k, 0.5% for AGIs $50k-75k, 0.7% for AGIs $75k-100k, 7.5% for AGIs over 100k)
Profit/loss from business: +$9,454 (reported on 10.7% of returns)
Here:
+$9,454
State:
+$10,813
(% of AGI for various income ranges: 0.7% for AGIs below $10k, 3.5% for AGIs $10k-25k, 1.8% for AGIs $25k-50k, 1.9% for AGIs $50k-75k, 2.4% for AGIs $75k-100k, 2.7% for AGIs over 100k)
IRA payment deduction: $2,782 (reported on 1.4% of returns)
45044:
$2,782
Ohio:
$2,794
(% of AGI for various income ranges: 0.1% for AGIs $10k-25k, 0.1% for AGIs $25k-50k, 0.1% for AGIs $50k-75k, 0.1% for AGIs $75k-100k, 0.1% for AGIs over 100k)
Self-employed pension: $12,300 (reported on 0.4% of returns)
Here:
$12,300
Ohio:
$13,981
(% of AGI for various income ranges: 0.0% for AGIs $50k-75k, 0.1% for AGIs $75k-100k, 0.2% for AGIs over 100k)
Total itemized deductions: $17,154 (21% of AGI, reported on 35.6% of returns)
Here:
$17,154
State:
$17,503
Here:
21.2% of AGI
State:
20.8% of AGI
(% of AGI for various income ranges: 7.9% for AGIs below $10k, 5.8% for AGIs $10k-25k, 11.0% for AGIs $25k-50k, 15.6% for AGIs $50k-75k, 18.2% for AGIs $75k-100k, 16.2% for AGIs over 100k)
Charity contributions deductions: $2,913 (3% of AGI, reported on 29.0% of returns)
Here:
$2,913
State:
$3,087
Here:
3.4% of AGI
State:
3.4% of AGI
(% of AGI for various income ranges: 0.3% for AGIs below $10k, 0.6% for AGIs $10k-25k, 1.1% for AGIs $25k-50k, 1.8% for AGIs $50k-75k, 2.3% for AGIs $75k-100k, 3.0% for AGIs over 100k)
Total tax: $6,211 (reported on 73.9% of returns)
45044:
$6,211
State:
$6,781
(% of AGI for various income ranges: 2.1% for AGIs below $10k, 3.9% for AGIs $10k-25k, 7.1% for AGIs $25k-50k, 9.0% for AGIs $50k-75k, 10.0% for AGIs $75k-100k, 17.0% for AGIs over 100k)
Earned income credit: $1,767 (reported on 17.5% of returns)
Here:
$1,767
State:
$1,696
Percentage of individuals using paid preparers for their 2004 taxes: 59.2%
Here:
59%
State:
55%
(% for various income ranges: 50.2% for AGIs below $10k, 64.8% for AGIs $10k-25k, 64.5% for AGIs $25k-50k, 60.5% for AGIs $50k-75k, 51.5% for AGIs $75k-100k, 53.5% for AGIs over 100k)
Likely homosexual households (counted as self-reported same-sex unmarried-partner households)
Lesbian couples: 0.2% of all households
Gay men: 0.0% of all households
Household received Food Stamps/SNAP in the past 12 months: 3,165 Household did not receive Food Stamps/SNAP in the past 12 months: 17,439
Women who had a birth in the past 12 months: 677 (317 now married, 353 unmarried) Women who did not have a birth in the past 12 months: 11,386 (5,617 now married, 5,764 unmarried)
Housing units in zip code 45044 with a mortgage: 8,854 (658 second mortgage, 29 home equity loan, 595 both second mortgage and home equity loan) Houses without a mortgage: 312
Median monthly owner costs for units with a mortgage: $1,511 Median monthly owner costs for units without a mortgage: $542
Residents with income below the poverty level in 2022:
This zip code:
14.0%
Whole state:
13.4%
Residents with income below 50% of the poverty level in 2022:
This zip code:
6.1%
Whole state:
7.0%
Median number of rooms in houses and condos:
Here:
7.1
State:
6.7
Median number of rooms in apartments:
Here:
4.6
State:
4.4
Notable locations in this zip code not listed on our city pages
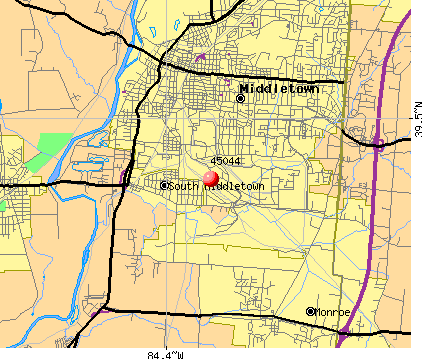
Notable locations in zip code 45044: Amanda Station (A), Green Crest Golf Course (B), Four Bridges Country Club (C), Barnitz Stadium (D), Middletown Wastewater Treatment Plant (E), Pleasant Hill Golf Course (F), Forest Hills Country Club (G), Eaton Medical Transportation Station 4 (H), Middletown Public Library (I), Middletown Division of Fire Station 3 Headquarters (J), Monroe Fire Department Station 2 Headquarters (K), Liberty Township Fire Department Station 2 (L), Middletown Division of Fire Station 5 (M). Display/hide their locations on the map
Shopping Centers: Kitty Hawk Plaza Shopping Center (1), Eastgate Plaza Shopping Center (2), Middletown Shopping Center (3). Display/hide their locations on the map
Churches in zip code 45044 include: Bethlehem Temple Apostolic Church (A), Church of Christ (B), First Christian Church (C), First Church of Christ Scientist (D), Messiah Lutheran Church (E), United Baptist Church (F), Bethany United Methodist Church (G), Blue Ball Presbyterian Church (H), Calvary Baptist Church (I). Display/hide their locations on the map
Streams, rivers, and creeks: Millers Creek (A), Elk Creek (B), Coldwater Creek (C), Dicks Creek (D), Gregory Creek (E), Clarks Run (F), Ausbergers Creek (G), Shaker Creek (H). Display/hide their locations on the map
Parks in zip code 45044 include: South Main Street Historic District (1), Whitney Park (2), Barnitz Park (3), Jacot Park (4), Bicentennial Commons (5), Crawford Park (6), Damon Park (7), Dudley Woods Metropark (8), Excello Locks Metropark (9). Display/hide their locations on the map
8,152 married couples with children.
3,727 single-parent households (843 men, 2,884 women).
92.5% of residents of 45044 zip code speak English at home.
4.1% of residents speak Spanish at home (40% very well, 28% well, 26% not well, 5% not at all).
1.1% of residents speak other Indo-European language at home (80% very well, 14% well, 3% not well, 3% not at all).
1.1% of residents speak Asian or Pacific Island language at home (68% very well, 25% well, 7% not well).
0.9% of residents speak other language at home (39% very well, 18% well, 10% not well, 33% not at all).
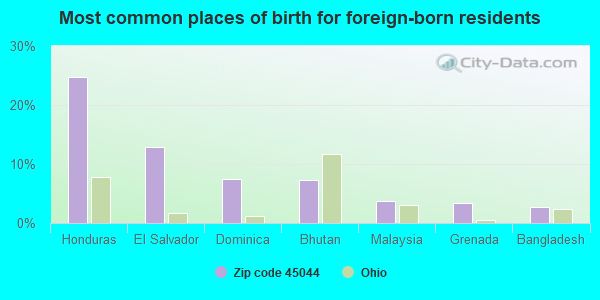
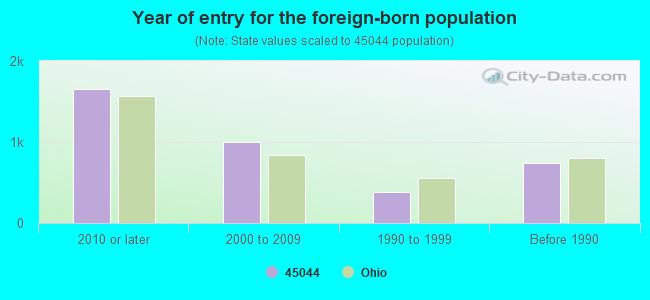
Foreign born population: 2,761 (5.1%) (48.4% of them are naturalized citizens)
Facilities with environmental interests located in this zip code:
ARMREL BYRNES CO (222 OXFORD STATE ROAD in MIDDLETOWN, OH)
AIR MINOR (AIRS/AFS) (Integrated Compliance Information System) - ICIS-05-2001-0284, FORMAL ENFORCEMENT ACTION STATE MASTER (Ohio general info) - AIR MAJOR, EPCRA Business SIC classification: ASPHALT PAVING MIXTURES AND BLOCKS; CONCRETE PRODUCTS, EXCEPT BLOCK AND BRICK Alternative names: ARMEL CONSTRUCTION CO
AMANDA ELEMENTARY SCHOOL (1215 OXFORD STATE ROAD in MIDDLETOWN, OH)
(Geographic Names Information System) (National Center for Education Statistics) - STATE ID-000547 STATE MASTER (Ohio general info) - AIR MAJOR Organizations: MIDDLETOWN CITY SD (SCHOOL DISTRICT)
AIR PRODUCTS AND CHEMICALS INC (2500 YANKEE ROAD in MIDDLETOWN, OH)
AIR MINOR (AIRS/AFS) STATE MASTER (Ohio general info) - RCRA-OHD041598673, HAZARDOUS WASTE PROGRAM, AIR MAJOR, EPCRA, TRIS-45042RPRDC2500Y, TRI REPORTER Small Quantity Generators, between 100 kg and 1000 kg of hazardous waste/month (Resource Conservation and Recovery Act (tracking hazardous waste)) - notification TRI REPORTER (Tracking of toxic chemicals releasing facilities) Business SIC classification: INDUSTRIAL GASES Alternative names: AIR PRODS. & CHEMICALS INC. MIDDLETOWN OH FACILITY, AIR PRODUCTS MIDDLETOWN OH
BARRETT ASPHALT PLT NO 161 (1515 14TH AVENUE in MIDDLETOWN, OH)
AIR MINOR (AIRS/AFS) STATE MASTER (Ohio general info) - AIR MAJOR, EPCRA Business SIC classification: ASPHALT PAVING MIXTURES AND BLOCKS Organizations: BARRETT PAVING MATERIALS INC (CONTACT/OWNER)
Alternative names: BARRETT PAVING MATERIALS INC, TRIASCO CORPORATION
AL S BIG MUFFLER SHOP (1811 CENTRAL AVE in MIDDLETOWN, OH)
STATE MASTER (Ohio general info) - RCRA-OHR000019075, HAZARDOUS WASTE PROGRAM Small Quantity Generators, between 100 kg and 1000 kg of hazardous waste/month (Resource Conservation and Recovery Act (tracking hazardous waste)) - notification Organizations: NICK WILSON (CONTACT/OWNER)
Alternative names: AL'S BIG MUFFLER SHOP
AMERICANA AMUSEMENT PARK * (5757 HAMILTON-MIDDLETOWN RD in MIDDLETOWN, OH)
COMPLIANCE ACTIVITY (Tracking inspections of insecticide, fungicide, and rodenticide, and toxic substances) STATE MASTER (Ohio general info) - SDWIS-0938112, DRINKING WATER PROGRAM Organizations: AMERICANNA AMUSEMENT PARK (CONTACT/OWNER)
Alternative names: AMERICAN AMUSEMENT PARK, AMERICANA AMUSEMENT PK
AUTO ANTHONY (2405 S MAIN ST in MIDDLETOWN, OH)
STATE MASTER (Ohio general info) - RCRA-OHD987025426, HAZARDOUS WASTE PROGRAM Small Quantity Generators, between 100 kg and 1000 kg of hazardous waste/month (Resource Conservation and Recovery Act (tracking hazardous waste)) - notification Organizations: PUGH ANTHONY (CONTACT/OWNER)
BP OIL CO (3500 ROOSEVELT AVE in MIDDLETOWN, OH)
STATE MASTER (Ohio general info) - RCRA-OHD987014685, HAZARDOUS WASTE PROGRAM, AIR MAJOR, -09-5541-659-7, EPCRA Conditionally Exempt Small Quantity Generators, less than 100 kg/month of hazardous waste (Resource Conservation and Recovery Act (tracking hazardous waste)) - notification Organizations: BP OIL COMPANY (CONTACT/OWNER)
CENTRAL ACADEMY NONGRADED ELE (1516 1ST AVE in MIDDLETOWN, OH)
(National Center for Education Statistics) - STATE ID-005405 Organizations: MIDDLETOWN CITY SD (SCHOOL DISTRICT)
BAKER CONCRETE CONSTRUCTION (2601 S VERITY PKWY in MIDDLETOWN, OH)
Small Quantity Generators, between 100 kg and 1000 kg of hazardous waste/month (Resource Conservation and Recovery Act (tracking hazardous waste)) - notification Organizations: ARMCO INC PROPERTY (CONTACT/OWNER)
, BAKER CONCRETE CONST INC (CONTACT/OWNER)
AMERICANA AMUSEMENT PK (5745 MIDDLETOWN - HAMILTON RD in MIDDLETOWN, OH)
COMPLIANCE ACTIVITY (Tracking inspections of insecticide, fungicide, and rodenticide, and toxic substances)
Housing units lacking complete plumbing facilities: 1.3% Housing units lacking complete kitchen facilities: 2.4%
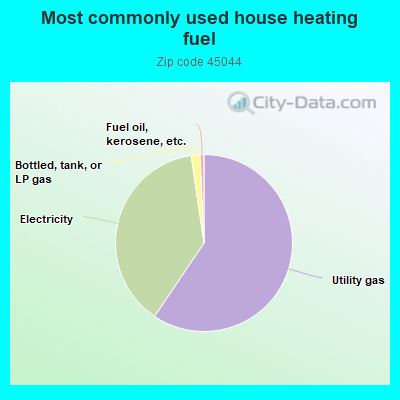
58.9%Utility gas
37.9%Electricity
1.6%Bottled, tank, or LP gas
0.7%Fuel oil, kerosene, etc.
Population in 1990: 38,868. Population change in the 1990s: +6,027 (+15.5%).
Place of birth for U.S.-born residents:
This state: 38,955
Northeast: 2,097
Midwest: 2,653
South: 4,997
West: 1,368
51% of the 45044 zip code residents lived in the same house 5 years ago. Out of people who lived in different houses, 63% lived in this county. Out of people who lived in different counties, 50% lived in Ohio.
90% of the 45044 zip code residents lived in the same house 1 year ago. Out of people who lived in different houses, 54% moved from this county. Out of people who lived in different houses, 36% moved from different county within same state. Out of people who lived in different houses, 7% moved from different state. Out of people who lived in different houses, 4% moved from abroad.
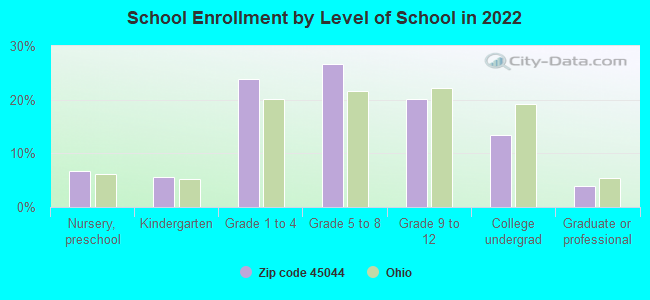
Private vs. public school enrollment:
Students in private schools in grades 1 to 8 (elementary and middle school): 1,049
Here:
15.5%
Ohio:
16.0%
Students in private schools in grades 9 to 12 (high school): 393
Here:
14.5%
Ohio:
13.1%
Students in private undergraduate colleges: 275
Here:
15.2%
Ohio:
22.3%
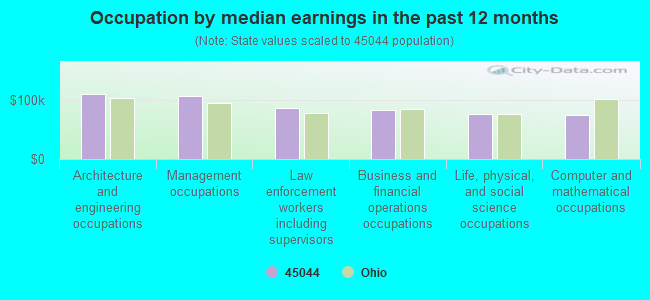
Occupation by median earnings in the past 12 months ($)
110,942Architecture and engineering occupations
106,481Management occupations
86,327Law enforcement workers including supervisors
82,944Business and financial operations occupations
76,438Life, physical, and social science occupations
74,817Computer and mathematical occupations
Companies with federal contracts located in this zip code (MIDDLETOWN, OH):
VALENTINE & COMPANY (3925 ROOSEVELT BLVD; small business) : $775,320 in 3 contractsfrom 2000 to 2005
$752,391 with Air Force for Structural Shapes, Nonferrous Base Metal. Signed on 2000-05-12. Completion date: 2001-01-01.
$11,641 with Air Force for Bars and Rods. Signed on 2003-12-29. Completion date: 2004-02-13.
$11,288 with Air Force for Plate, Sheet, Strip, and Foil; Nonferrous Base Metal. Signed on 2005-06-01. Completion date: 2005-06-29.
NU WAVES LTD (122 EDISON DR; small business) : $141,232 in 4 contractsfrom 2005 to 2006
$59,612 with Army for Miscellaneous Communication Equipment. Signed on 2006-03-17. Completion date: 2006-05-31.
$59,120 with Army for Communications Security Equipment and Components. Signed on 2005-08-11. Completion date: 2005-11-14.
$12,000 with Army for Miscellaneous Alarm, Signal and Security Detection Systems. Signed on 2005-09-20. Completion date: 2005-11-30.
$10,500 with Navy for Electronic Modules. Signed on 2005-12-07. Completion date: 2006-02-20.
MCGRAW/KOKOSING CONST. (4701 E. OXFORD ST. RD.)
$79,000 with Air Force for Maintenance, Repair and Rebuilding of Equipment -- Furnace, Steam Plant, and Drying Equipment; and Nuclear Reactors. Signed on 2000-08-03. Completion date: 2000-10-13.
G & W MACHINERY SALES, INC (4315 SALZMAN RD; small business)
$41,000 with Air Force for Cutting Tools for Machine Tools. Signed on 2006-02-09. Completion date: 2006-03-31.
BETTER CHOICE HEATING & AIR CO (6225 JESSICA CT; small business)
$2,899 with Army for Facilities Operations Support Services. Signed on 2002-12-04. Completion date: 2002-12-18.
Top industries in this zip code by the number of employees in 2005:
Health Care and Social Assistance: General Medical and Surgical Hospitals (over 1000 employees: 1 establishment)
2002 - 2018 National Fire Incident Reporting System (NFIRS) incidents
According to the data from the years 2002 - 2018 the average number of fires per year is 211. The highest number of reported fire incidents - 354 took place in 2007, and the least - 123 in 2013. The data has a decreasing trend.
When looking into fire subcategories, the most reports belonged to: Structure Fires (35.5%), and Outside Fires (32.5%).
Fire incident types reported to NFIRS in Zip Code 45044

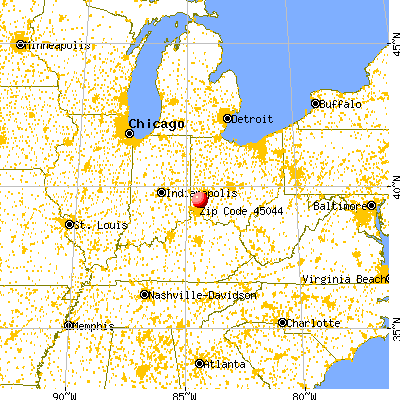


 Nearest zip codes: 45050, 45067, 45042, 45011, 45005, 45069.


 According to the data from the years 2002 - 2018 the average number of fires per year is 211. The highest number of reported fire incidents - 354 took place in 2007, and the least - 123 in 2013. The data has a decreasing trend.
 When looking into fire subcategories, the most reports belonged to: Structure Fires (35.5%), and Outside Fires (32.5%).