Estimated zip code population in 2022: 21,505 Zip code population in 2010: 21,447 Zip code population in 2000: 20,359
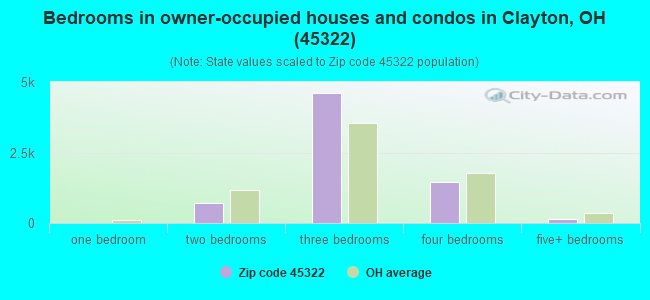
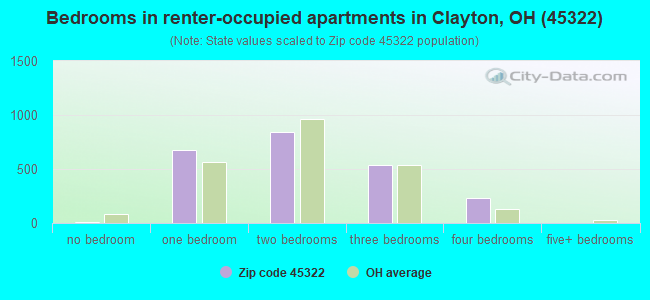
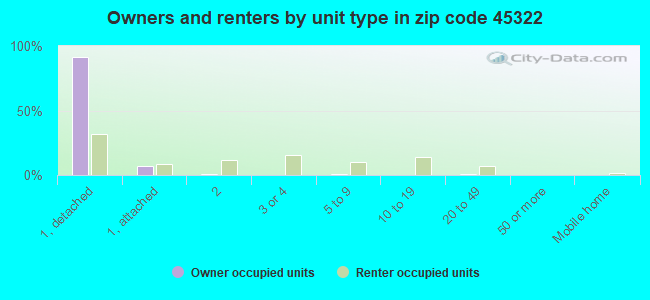
Houses and condos: 9,715 Renter-occupied apartments: 2,295
% of renters here:
25%
State:
33%
March 2022 cost of living index in zip code 45322: 94.3 (less than average, U.S. average is 100)
Land area: 19.9 sq. mi. Water area: 0.1 sq. mi.
Population density: 1,081 people per square mile
(low).
OSM Map
General Map
Google Map
MSN Map
OSM Map
General Map
Google Map
MSN Map
OSM Map
General Map
Google Map
MSN Map
OSM Map
General Map
Google Map
MSN Map
Please wait while loading the map...
Real estate property taxes paid for housing units in 2022:
This zip code:
1.8% ($3,234)
Ohio:
1.3% ($2,639)
Median real estate property taxes paid for housing units with mortgages in 2022: $3,250 (1.8%) Median real estate property taxes paid for housing units with no mortgage in 2022: $3,230 (1.9%)
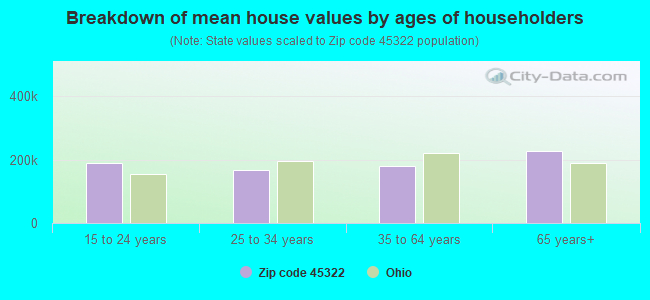
Estimated median house/condo value in 2022: $177,265
45322:
$177,265
Ohio:
$204,100
According to our research of Ohio and other state lists, there were 15 registered sex offenders living in 45322 zip code as of April 26, 2024. The ratio of all residents to sex offenders in zip code 45322 is 1,440 to 1. The ratio of registered sex offenders to all residents in this zip code is much lower than the state average.
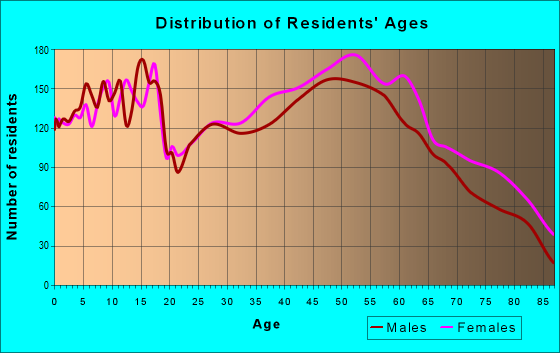
Median resident age:
This zip code:
42.8 years
Ohio median age:
39.9 years
Average household size:
This zip code:
2.3 people
Ohio:
2.4 people
Averages for the 2020 tax year for zip code 45322, filed in 2021:
Average Adjusted Gross Income (AGI) in 2020: $56,798 (Individual Income Tax Returns)
Here:
$56,798
State:
$67,288
Salary/wage: $51,131 (reported on 80.4% of returns)
Here:
$51,131
State:
$55,628
(% of AGI for various income ranges: 1103.8% for AGIs below $25k, 3621.6% for AGIs $25k-50k, 6311.0% for AGIs $50k-75k, 9376.2% for AGIs $75k-100k, 16448.6% for AGIs $100k-200k, 61198.0% for AGIs over 200k)
Taxable interest for individuals: $897 (reported on 32.3% of returns)
This zip code:
$897
Ohio:
$1,518
(% of AGI for various income ranges: 15.7% for AGIs below $25k, 18.9% for AGIs $25k-50k, 43.1% for AGIs $50k-75k, 52.8% for AGIs $75k-100k, 106.2% for AGIs $100k-200k, 840.0% for AGIs over 200k)
Ordinary dividends: $3,467 (reported on 14.8% of returns)
Here:
$3,467
State:
$7,167
(% of AGI for various income ranges: 22.7% for AGIs below $25k, 29.5% for AGIs $25k-50k, 62.2% for AGIs $50k-75k, 81.1% for AGIs $75k-100k, 225.1% for AGIs $100k-200k, 1910.0% for AGIs over 200k)
Net capital gain/loss in AGI: +$7,246 (reported on 12.4% of returns)
Here:
+$7,246
State:
+$18,919
(% of AGI for various income ranges: 10.2% for AGIs below $25k, 17.1% for AGIs $25k-50k, 50.2% for AGIs $50k-75k, 135.1% for AGIs $75k-100k, 422.9% for AGIs $100k-200k, 7510.0% for AGIs over 200k)
Profit/loss from business: +$9,197 (reported on 11.0% of returns)
Here:
+$9,197
State:
+$13,744
(% of AGI for various income ranges: 63.9% for AGIs below $25k, 85.9% for AGIs $25k-50k, 143.3% for AGIs $50k-75k, 154.9% for AGIs $75k-100k, 372.0% for AGIs $100k-200k, 2284.0% for AGIs over 200k)
Taxable individual retirement arrangement distribution: $13,793 (reported on 11.1% of returns)
45322:
$13,793
Ohio:
$18,876
(% of AGI for various income ranges: 89.1% for AGIs below $25k, 114.4% for AGIs $25k-50k, 218.3% for AGIs $50k-75k, 315.1% for AGIs $75k-100k, 562.1% for AGIs $100k-200k, 3110.0% for AGIs over 200k)
Total itemized deductions: $26,944 (reported on 4.5% of returns)
Here:
$26,944
State:
$33,869
(% of AGI for various income ranges: 37.5% for AGIs below $25k, 75.2% for AGIs $25k-50k, 127.9% for AGIs $50k-75k, 266.2% for AGIs $75k-100k, 616.4% for AGIs $100k-200k, 3020.0% for AGIs over 200k)
Charity contributions: $9,554 (reported on 3.5% of returns)
Here:
$9,554
State:
$14,577
(% of AGI for various income ranges: 13.3% for AGIs $25k-50k, 28.1% for AGIs $50k-75k, 75.6% for AGIs $75k-100k, 218.0% for AGIs $100k-200k, 1010.0% for AGIs over 200k)
Taxes paid: $6,724 (reported on 4.5% of returns)
45322:
$6,724
State:
$7,681
(% of AGI for various income ranges: 6.4% for AGIs below $25k, 13.0% for AGIs $25k-50k, 32.6% for AGIs $50k-75k, 80.2% for AGIs $75k-100k, 157.9% for AGIs $100k-200k, 704.0% for AGIs over 200k)
Earned income credit: $2,138 (reported on 11.8% of returns)
Here:
$2,138
State:
$2,304
(% of AGI for various income ranges: 69.1% for AGIs below $25k, 52.9% for AGIs $25k-50k, 1.2% for AGIs $50k-75k)
Percentage of individuals using paid preparers for their 2020 taxes: 93.8%
Here:
94%
State:
94%
(% for various income ranges: 92.4% for AGIs below $25k, 94.9% for AGIs $25k-50k, 94.1% for AGIs $50k-75k, 94.3% for AGIs $75k-100k, 94.4% for AGIs $100k-200k, 87.5% for AGIs over 200k)
Averages for the 2012 tax year for zip code 45322, filed in 2013:
Average Adjusted Gross Income (AGI) in 2012: $47,395 (Individual Income Tax Returns)
Here:
$47,395
State:
$54,926
Salary/wage: $42,727 (reported on 81.9% of returns)
Here:
$42,727
State:
$45,869
(% of AGI for various income ranges: 68.9% for AGIs below $25k, 74.6% for AGIs $25k-50k, 76.1% for AGIs $50k-75k, 79.3% for AGIs $75k-100k, 76.2% for AGIs $100k-200k, 46.5% for AGIs over 200k)
Taxable interest for individuals: $830 (reported on 34.8% of returns)
This zip code:
$830
Ohio:
$1,297
(% of AGI for various income ranges: 1.0% for AGIs below $25k, 0.6% for AGIs $25k-50k, 0.5% for AGIs $50k-75k, 0.5% for AGIs $75k-100k, 0.7% for AGIs $100k-200k, 0.6% for AGIs over 200k)
Ordinary dividends: $3,059 (reported on 17.1% of returns)
Here:
$3,059
State:
$5,821
(% of AGI for various income ranges: 1.4% for AGIs below $25k, 0.8% for AGIs $25k-50k, 1.1% for AGIs $50k-75k, 0.6% for AGIs $75k-100k, 1.4% for AGIs $100k-200k, 2.0% for AGIs over 200k)
Net capital gain/loss in AGI: +$3,434 (reported on 12.6% of returns)
Here:
+$3,434
State:
+$11,232
(% of AGI for various income ranges: 0.1% for AGIs $25k-50k, 0.5% for AGIs $50k-75k, 0.6% for AGIs $75k-100k, 1.0% for AGIs $100k-200k, 7.6% for AGIs over 200k)
Profit/loss from business: +$9,575 (reported on 11.5% of returns)
Here:
+$9,575
State:
+$12,773
(% of AGI for various income ranges: 4.8% for AGIs below $25k, 2.1% for AGIs $25k-50k, 1.4% for AGIs $50k-75k, 1.4% for AGIs $75k-100k, 2.5% for AGIs $100k-200k, 4.6% for AGIs over 200k)
Taxable individual retirement arrangement distribution: $10,197 (reported on 11.8% of returns)
45322:
$10,197
Ohio:
$14,511
(% of AGI for various income ranges: 4.3% for AGIs below $25k, 3.0% for AGIs $25k-50k, 2.1% for AGIs $50k-75k, 2.0% for AGIs $75k-100k, 3.1% for AGIs $100k-200k)
Self-employment retirement plans: $11,000 (reported on 0.3% of returns)
45322:
$11,000
Ohio:
$20,257
(% of AGI for various income ranges: 0.4% for AGIs $75k-100k)
Total itemized deductions: $16,511 (22% of AGI, reported on 35.1% of returns)
Here:
$16,511
State:
$21,278
Here:
21.6% of AGI
State:
18.8% of AGI
(% of AGI for various income ranges: 10.0% for AGIs below $25k, 10.6% for AGIs $25k-50k, 12.1% for AGIs $50k-75k, 13.2% for AGIs $75k-100k, 14.5% for AGIs $100k-200k, 10.7% for AGIs over 200k)
Charity contributions: $3,021 (reported on 26.4% of returns)
Here:
$3,021
State:
$3,943
(% of AGI for various income ranges: 0.8% for AGIs below $25k, 1.2% for AGIs $25k-50k, 1.6% for AGIs $50k-75k, 1.9% for AGIs $75k-100k, 2.2% for AGIs $100k-200k, 2.3% for AGIs over 200k)
Taxes paid: $6,922 (reported on 34.9% of returns)
45322:
$6,922
State:
$9,568
(% of AGI for various income ranges: 3.0% for AGIs below $25k, 3.6% for AGIs $25k-50k, 4.8% for AGIs $50k-75k, 5.7% for AGIs $75k-100k, 7.0% for AGIs $100k-200k, 6.2% for AGIs over 200k)
Earned income credit: $2,146 (reported on 14.4% of returns)
Here:
$2,146
State:
$2,285
(% of AGI for various income ranges: 4.7% for AGIs below $25k, 0.9% for AGIs $25k-50k)
Percentage of individuals using paid preparers for their 2012 taxes: 44.9%
Here:
45%
State:
51%
(% for various income ranges: 38.1% for AGIs below $25k, 48.6% for AGIs $25k-50k, 48.6% for AGIs $50k-75k, 48.6% for AGIs $75k-100k, 48.3% for AGIs $100k-200k, 66.7% for AGIs over 200k)
Averages for the 2004 tax year for zip code 45322, filed in 2005:
Average Adjusted Gross Income (AGI) in 2004: $42,025 (Individual Income Tax Returns)
Here:
$42,025
State:
$44,480
Salary/wage: $38,489 (reported on 86.4% of returns)
Here:
$38,489
State:
$39,198
(% of AGI for various income ranges: 103.5% for AGIs below $10k, 70.1% for AGIs $10k-25k, 78.2% for AGIs $25k-50k, 83.9% for AGIs $50k-75k, 85.9% for AGIs $75k-100k, 69.1% for AGIs over 100k)
Taxable interest for individuals: $1,313 (reported on 45.6% of returns)
This zip code:
$1,313
Ohio:
$1,532
(% of AGI for various income ranges: 3.8% for AGIs below $10k, 2.5% for AGIs $10k-25k, 1.5% for AGIs $25k-50k, 0.9% for AGIs $50k-75k, 0.8% for AGIs $75k-100k, 2.0% for AGIs over 100k)
Taxable dividends: $2,164 (reported on 23.2% of returns)
Here:
$2,164
State:
$3,496
(% of AGI for various income ranges: 3.8% for AGIs below $10k, 1.3% for AGIs $10k-25k, 0.9% for AGIs $25k-50k, 0.8% for AGIs $50k-75k, 0.8% for AGIs $75k-100k, 2.3% for AGIs over 100k)
Net capital gain/loss: +$4,177 (reported on 16.8% of returns)
Here:
+$4,177
State:
+$8,582
(% of AGI for various income ranges: -0.7% for AGIs below $10k, 0.4% for AGIs $10k-25k, 0.3% for AGIs $25k-50k, 0.5% for AGIs $50k-75k, 0.8% for AGIs $75k-100k, 6.9% for AGIs over 100k)
Profit/loss from business: +$8,756 (reported on 11.5% of returns)
Here:
+$8,756
State:
+$10,813
(% of AGI for various income ranges: 3.3% for AGIs below $10k, 3.5% for AGIs $10k-25k, 1.9% for AGIs $25k-50k, 1.8% for AGIs $50k-75k, 2.0% for AGIs $75k-100k, 3.7% for AGIs over 100k)
Profit/loss from farming: +$429 (reported on 0.2% of returns)
Here:
+$429
State:
-$3,706
IRA payment deduction: $2,886 (reported on 1.7% of returns)
45322:
$2,886
Ohio:
$2,794
(% of AGI for various income ranges: 0.2% for AGIs $10k-25k, 0.2% for AGIs $25k-50k, 0.1% for AGIs $50k-75k, 0.1% for AGIs $75k-100k, 0.1% for AGIs over 100k)
Self-employed pension: $10,167 (reported on 0.4% of returns)
Here:
$10,167
Ohio:
$13,981
(% of AGI for various income ranges: 0.1% for AGIs $10k-25k, 0.1% for AGIs $50k-75k, 0.4% for AGIs over 100k)
Total itemized deductions: $14,506 (23% of AGI, reported on 44.0% of returns)
Here:
$14,506
State:
$17,503
Here:
22.7% of AGI
State:
20.8% of AGI
(% of AGI for various income ranges: 12.7% for AGIs below $10k, 11.3% for AGIs $10k-25k, 13.8% for AGIs $25k-50k, 16.4% for AGIs $50k-75k, 17.1% for AGIs $75k-100k, 15.5% for AGIs over 100k)
Charity contributions deductions: $2,368 (4% of AGI, reported on 35.5% of returns)
Here:
$2,368
State:
$3,087
Here:
3.5% of AGI
State:
3.4% of AGI
(% of AGI for various income ranges: 0.7% for AGIs below $10k, 1.1% for AGIs $10k-25k, 1.5% for AGIs $25k-50k, 2.1% for AGIs $50k-75k, 2.3% for AGIs $75k-100k, 2.8% for AGIs over 100k)
Total tax: $4,928 (reported on 81.1% of returns)
45322:
$4,928
State:
$6,781
(% of AGI for various income ranges: 2.3% for AGIs below $10k, 4.3% for AGIs $10k-25k, 7.2% for AGIs $25k-50k, 8.9% for AGIs $50k-75k, 10.4% for AGIs $75k-100k, 15.6% for AGIs over 100k)
Earned income credit: $1,524 (reported on 9.4% of returns)
Here:
$1,524
State:
$1,696
Percentage of individuals using paid preparers for their 2004 taxes: 51.5%
Here:
51%
State:
55%
(% for various income ranges: 37.1% for AGIs below $10k, 53.9% for AGIs $10k-25k, 57.3% for AGIs $25k-50k, 54.0% for AGIs $50k-75k, 46.7% for AGIs $75k-100k, 53.9% for AGIs over 100k)
Household received Food Stamps/SNAP in the past 12 months: 644 Household did not receive Food Stamps/SNAP in the past 12 months: 8,614
Women who had a birth in the past 12 months: 288 (164 now married, 122 unmarried) Women who did not have a birth in the past 12 months: 3,831 (1,906 now married, 1,923 unmarried)
Housing units in zip code 45322 with a mortgage: 4,290 (296 second mortgage, 19 home equity loan, 219 both second mortgage and home equity loan) Houses without a mortgage: 149
Median monthly owner costs for units with a mortgage: $1,281 Median monthly owner costs for units without a mortgage: $568
Residents with income below the poverty level in 2022:
This zip code:
5.3%
Whole state:
13.4%
Residents with income below 50% of the poverty level in 2022:
This zip code:
2.4%
Whole state:
7.0%
Median number of rooms in houses and condos:
Here:
6.6
State:
6.7
Median number of rooms in apartments:
Here:
4.8
State:
4.4
Notable locations in this zip code not listed on our city pages
Notable locations in zip code 45322: Englewood Industrial Park (A), Dayton Meadowbrook Country Club (B), Englewood Fire Department Station 98 (C), Union Fire Department Station 81 (D), Englewood Fire Department Station 2 (E), Earl Heck Community Center (F). Display/hide their locations on the map
Shopping Centers: Englewood Plaza Shopping Center (1), Country Square Shopping Center (2), Golden Key Village Shopping Center (3), Northmont Plaza Shopping Center (4). Display/hide their locations on the map
Churches in zip code 45322 include: Concord Church (A), Grace Church (B), Garland Community Church (C), Highland Brethren in Christ Church (D), Englewood United Methodist Church (E). Display/hide their locations on the map
Cemeteries: Bethel Cemetery (1), Fairview Cemetery (2), Warner Cemetery (3), Highland Cemetery (4), Herr Cemetery (5), Minnich Cemetery (6), Concord Cemetery (7). Display/hide their locations on the map
Parks in zip code 45322 include: Government Park (1), Oberer Field (2), Englewood Hills South Park (3), Union Community Park (4). Display/hide their locations on the map
In group quarters: 70 (-1 institutionalized population)
Size of family households: 2,941 2-persons, 1,126 3-persons, 814 4-persons, 751 5-persons, 76 6-persons, 66 7-or-more-persons
Size of nonfamily households: 3,002 1-person, 437 2-persons, 50 3-persons
3,351 married couples with children.
1,203 single-parent households (115 men, 1,088 women).
97.9% of residents of 45322 zip code speak English at home.
0.9% of residents speak Spanish at home (54% very well, 46% well).
0.3% of residents speak other Indo-European language at home (98% very well, 2% not well).
0.3% of residents speak Asian or Pacific Island language at home (42% well, 58% not well).
0.7% of residents speak other language at home (66% very well, 34% well).
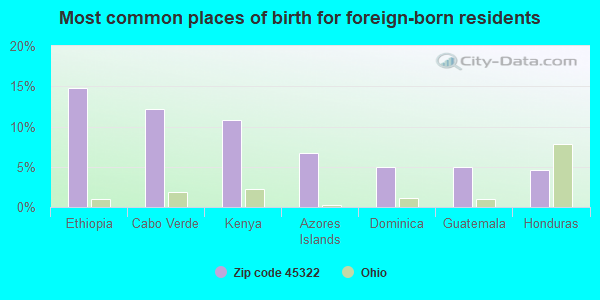
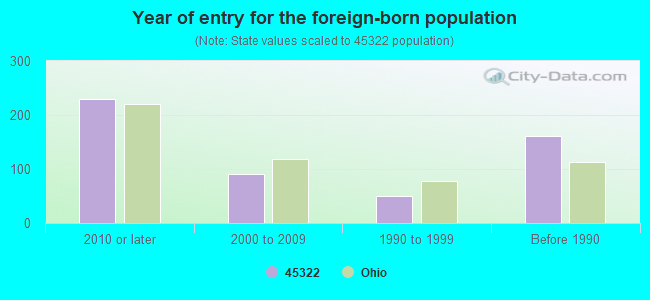
Foreign born population: 386 (1.8%) (54.4% of them are naturalized citizens)
This zip code:
1.8%
Whole state:
5.0%
15%Ethiopia
12%Cabo Verde
11%Kenya
7%Azores Islands
5%Dominica
5%Guatemala
5%Honduras
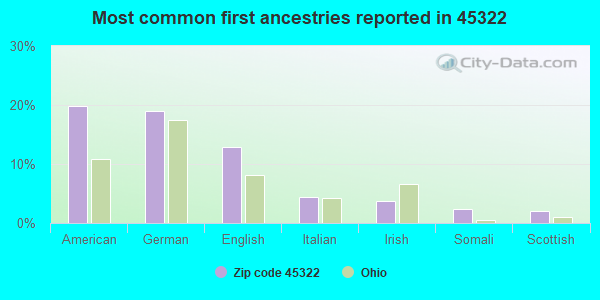
20%German
19%American
13%English
5%Irish
4%Italian
2%Scottish
2%Somali
Year of entry for the foreign-born population
2292010 or later
902000 to 2009
501990 to 1999
162Before 1990
Facilities with environmental interests located in this zip code:
BEECHMONT FORD BODY SHOP (1083 OHIO PIKE in UNION, OH)
STATE MASTER (Ohio general info) - AIR MAJOR, RCRA-OHR000008458, HAZARDOUS WASTE PROGRAM Small Quantity Generators, between 100 kg and 1000 kg of hazardous waste/month (Resource Conservation and Recovery Act (tracking hazardous waste)) - notification Organizations: JAMACHLO LIMITED - MARK WILLIAMS (CONTACT/OWNER)
, JAMACHLO LIMITED - MARK WILLIA (CONTACT/OWNER)
Alternative names: WILLIAMS AUTO BODY
BEAMS WOOD MOULDING INC (909 S MAIN ST in ENGLEWOOD, OH)
(Resource Conservation and Recovery Act (tracking hazardous waste)) Organizations: BEAM CHESTER A (CONTACT/OWNER)
BP OIL CO (104 N MAIN ST in UNION, OH)
(Resource Conservation and Recovery Act (tracking hazardous waste)) Organizations: BP OIL COMPANY (CONTACT/OWNER)
Housing units lacking complete plumbing facilities: 0.4% Housing units lacking complete kitchen facilities: 0.5%
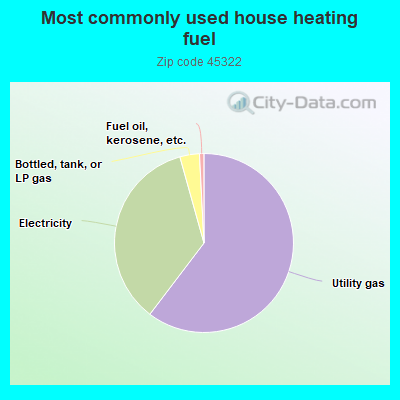
59.8%Utility gas
35.0%Electricity
3.5%Bottled, tank, or LP gas
0.8%Fuel oil, kerosene, etc.
Population in 1990: 20,297. Population change in the 1990s: +62 (+0.3%).
Place of birth for U.S.-born residents:
This state: 16,842
Northeast: 640
Midwest: 1,651
South: 1,453
West: 359
60% of the 45322 zip code residents lived in the same house 5 years ago. Out of people who lived in different houses, 73% lived in this county. Out of people who lived in different counties, 50% lived in Ohio.
90% of the 45322 zip code residents lived in the same house 1 year ago. Out of people who lived in different houses, 71% moved from this county. Out of people who lived in different houses, 10% moved from different county within same state. Out of people who lived in different houses, 15% moved from different state. Out of people who lived in different houses, 1% moved from abroad.
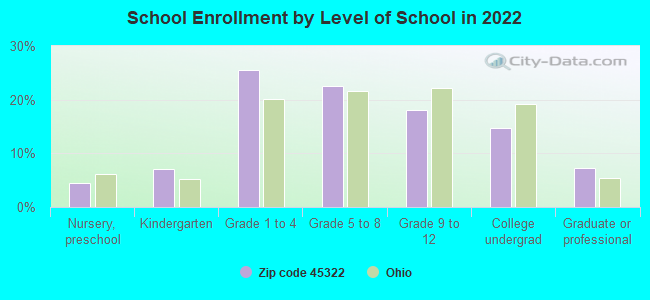
Private vs. public school enrollment:
Students in private schools in grades 1 to 8 (elementary and middle school): 182
Here:
7.6%
Ohio:
16.0%
Students in private schools in grades 9 to 12 (high school): 83
Here:
9.2%
Ohio:
13.1%
Students in private undergraduate colleges: 76
Here:
10.3%
Ohio:
22.3%
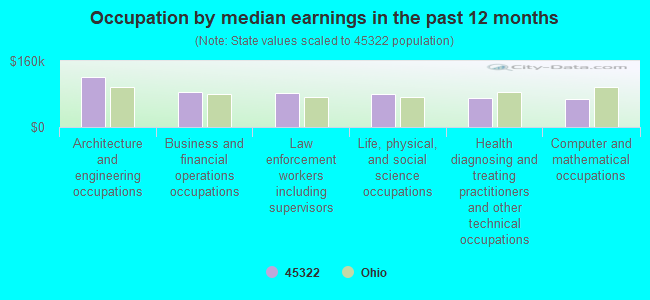
Occupation by median earnings in the past 12 months ($)
120,692Architecture and engineering occupations
84,508Business and financial operations occupations
82,878Law enforcement workers including supervisors
78,824Life, physical, and social science occupations
71,168Health diagnosing and treating practitioners and other technical occupations
68,029Computer and mathematical occupations
Companies with federal contracts located in this zip code (ENGLEWOOD, OH):
TRIAD FLUID POWER, INC (100 ROCKRIDGE RD; small business) : $2,165,597 in 162 contractsfrom 2001 to 2006
Contracts for Miscellaneous Power Transmission Equipment, Valves, Nonpowered, Engine Air and Oil Filters, Strainers, and Cleaners, Nonaircraft, Vehicular Power Transmission Components, and moreby Defense Logistics Agency, Navy, Army, NASA, and others Signed by year:2000: $0; 2001: $175,995; 2002: $126,459; 2003: $70,638; 2004: $398,853; 2005: $894,455; 2006: $499,197.
Biggest contracts:
$233,294 with Defense Logistics Agency for Miscellaneous Power Transmission Equipment. Signed on 2005-04-29. Completion date: 2005-10-06.
$98,260 with Defense Logistics Agency for Valves, Nonpowered. Signed on 2005-03-20. Completion date: 2005-06-03.
$72,240 with Defense Logistics Agency for Engine Air and Oil Filters, Strainers, and Cleaners, Nonaircraft. Signed on 2006-03-13. Completion date: 2006-06-27.
$66,000 with Defense Logistics Agency for Valves, Nonpowered. Signed on 2001-06-05. Completion date: 2001-08-09.
ARGENT INDUSTRIES, INC (705 TAYWOOD ROAD; small business) : $488,484 in 28 contractsfrom 2000 to 2006
Contracts for Resistors, Electron Tubes and Associated Hardware, Microcircuits, Electronic, Semiconductor Devices and Associated Hardware, and moreby Defense Logistics Agency, Navy, Army Signed by year:2000: $151,982; 2001: $182,424; 2002: $80,197; 2003: $0; 2004: $61,229; 2005: $8,236; 2006: $4,416.
Biggest contracts:
$69,377 with Defense Logistics Agency for Resistors. Signed on 2001-02-23. Completion date: 2001-07-23.
$56,210 with Defense Logistics Agency for Electron Tubes and Associated Hardware. Signed on 2000-11-27. Completion date: 2001-02-25.
$44,625 with Defense Logistics Agency for Microcircuits, Electronic. Signed on 2001-07-27. Completion date: 2001-09-25.
$42,804 with Defense Logistics Agency for Semiconductor Devices and Associated Hardware. Signed on 2000-09-22. Completion date: 2000-11-23.
BELMONTE PARK ENVIRONMENTAL LA (25 HOLIDAY DR; small business)
$12,266 with Air Force for Water Quality Studies. Signed on 2004-10-19. Completion date: 2005-09-30.
RIANCHO, LUIS G & ASSOCIATES I (140 W WENGER RD; small business)
$2,176 with Army for Other Architect and Engineering Services. Signed on 2005-07-13. Completion date: 2005-08-12.
Top industries in this zip code by the number of employees in 2005:
2002 - 2018 National Fire Incident Reporting System (NFIRS) incidents
Based on the data from the years 2002 - 2018 the average number of fires per year is 57. The highest number of reported fires - 83 took place in 2018, and the least - 12 in 2002. The data has an increasing trend.
When looking into fire subcategories, the most incidents belonged to: Structure Fires (51.2%), and Outside Fires (31.3%).
Fire incident types reported to NFIRS in Zip Code 45322


+$429
-$3,706
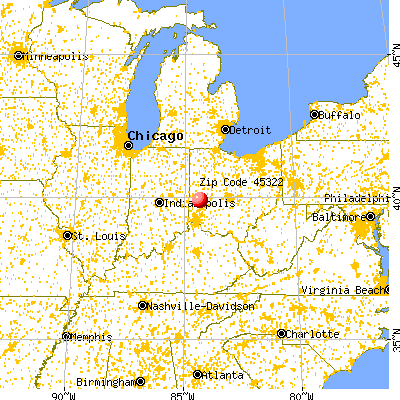
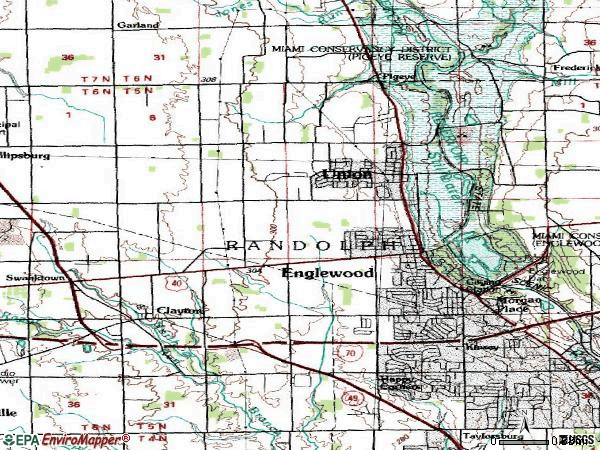
 Nearest zip codes: 45315, 45383, 45354, 45415, 45426, 45377.


 Based on the data from the years 2002 - 2018 the average number of fires per year is 57. The highest number of reported fires - 83 took place in 2018, and the least - 12 in 2002. The data has an increasing trend.
 When looking into fire subcategories, the most incidents belonged to: Structure Fires (51.2%), and Outside Fires (31.3%).