Estimated zip code population in 2022: 12,581
Zip code population in 2010: 12,631
Zip code population in 2000: 12,637
Houses and condos: 5,804
Renter-occupied apartments: 1,966
% of renters here:
35%State:
33%
March 2022 cost of living index in zip code 45415: 93.7
(less than average, U.S. average is 100)
Land area: 6.2
sq. mi.
Water area: 0.1
sq. mi.
Population density: 2,039 people per square mile (low).
OSM Map
General Map
Google Map
MSN Map
OSM Map
General Map
Google Map
MSN Map
OSM Map
General Map
Google Map
MSN Map
OSM Map
General Map
Google Map
MSN Map
Please wait while loading the map...
Real estate property taxes paid for housing units in 2022:
This zip code:
1.9% ($3,445)Ohio:
1.3% ($2,639)
Median real estate property taxes paid for housing units with mortgages in 2022: $3,759 (2.0%)
Median real estate property taxes paid for housing units with no mortgage in 2022: $2,843 (1.9%)
Business Search - 14 Million verified businesses
Males: 6,269 Females: 6,312
For population 25 years and over in 45415:
High school or higher: 94.6%Bachelor's degree or higher: 32.7%Graduate or professional degree: 13.3%Unemployed: 2.7%Mean travel time to work (commute): 24.0 minutes
For population 15 years and over in 45415:
Never married: 31.8%Now married: 45.5%Separated: 2.7%Widowed: 7.1%Divorced: 12.9%
Zip code 45415 compared to state average:
Black race population percentage significantly above state average. Hispanic race population percentage significantly below state average. Length of stay since moving in significantly above state average. 5,912 47.0% White 5,790 46.0% Black 522 4.2% Two or more races 184 1.5% Asian 95 0.8% Hispanic or Latino 44 0.3% American Indian 24 0.2% Some other race 4 0.03% Native Hawaiian and Other
Data:
Median household income ($)
Median household income (% change since 2000)
Household income diversity
Ratio of average income to average house value (%)
Ratio of average income to average rent
Median household income ($) - White
Median household income ($) - Black or African American
Median household income ($) - Asian
Median household income ($) - Hispanic or Latino
Median household income ($) - American Indian and Alaska Native
Median household income ($) - Multirace
Median household income ($) - Other Race
Median household income for houses/condos with a mortgage ($)
Median household income for apartments without a mortgage ($)
Races - White alone (%)
Races - White alone (% change since 2000)
Races - Black alone (%)
Races - Black alone (% change since 2000)
Races - American Indian alone (%)
Races - American Indian alone (% change since 2000)
Races - Asian alone (%)
Races - Asian alone (% change since 2000)
Races - Hispanic (%)
Races - Hispanic (% change since 2000)
Races - Native Hawaiian and Other Pacific Islander alone (%)
Races - Native Hawaiian and Other Pacific Islander alone (% change since 2000)
Races - Two or more races (%)
Races - Two or more races (% change since 2000)
Races - Other race alone (%)
Races - Other race alone (% change since 2000)
Racial diversity
Unemployment (%)
Unemployment (% change since 2000)
Unemployment (%) - White
Unemployment (%) - Black or African American
Unemployment (%) - Asian
Unemployment (%) - Hispanic or Latino
Unemployment (%) - American Indian and Alaska Native
Unemployment (%) - Multirace
Unemployment (%) - Other Race
Population density (people per square mile)
Population - Males (%)
Population - Females (%)
Population - Males (%) - White
Population - Males (%) - Black or African American
Population - Males (%) - Asian
Population - Males (%) - Hispanic or Latino
Population - Males (%) - American Indian and Alaska Native
Population - Males (%) - Multirace
Population - Males (%) - Other Race
Population - Females (%) - White
Population - Females (%) - Black or African American
Population - Females (%) - Asian
Population - Females (%) - Hispanic or Latino
Population - Females (%) - American Indian and Alaska Native
Population - Females (%) - Multirace
Population - Females (%) - Other Race
Coronavirus confirmed cases (Apr 27, 2024)
Deaths caused by coronavirus (Apr 27, 2024)
Coronavirus confirmed cases (per 100k population) (Apr 27, 2024)
Deaths caused by coronavirus (per 100k population) (Apr 27, 2024)
Daily increase in number of cases (Apr 27, 2024)
Weekly increase in number of cases (Apr 27, 2024)
Cases doubled (in days) (Apr 27, 2024)
Hospitalized patients (Apr 18, 2022)
Negative test results (Apr 18, 2022)
Total test results (Apr 18, 2022)
COVID Vaccine doses distributed (per 100k population) (Sep 19, 2023)
COVID Vaccine doses administered (per 100k population) (Sep 19, 2023)
COVID Vaccine doses distributed (Sep 19, 2023)
COVID Vaccine doses administered (Sep 19, 2023)
Likely homosexual households (%)
Likely homosexual households (% change since 2000)
Likely homosexual households - Lesbian couples (%)
Likely homosexual households - Lesbian couples (% change since 2000)
Likely homosexual households - Gay men (%)
Likely homosexual households - Gay men (% change since 2000)
Cost of living index
Median gross rent ($)
Median contract rent ($)
Median monthly housing costs ($)
Median house or condo value ($)
Median house or condo value ($ change since 2000)
Mean house or condo value by units in structure - 1, detached ($)
Mean house or condo value by units in structure - 1, attached ($)
Mean house or condo value by units in structure - 2 ($)
Mean house or condo value by units in structure by units in structure - 3 or 4 ($)
Mean house or condo value by units in structure - 5 or more ($)
Mean house or condo value by units in structure - Boat, RV, van, etc. ($)
Mean house or condo value by units in structure - Mobile home ($)
Median house or condo value ($) - White
Median house or condo value ($) - Black or African American
Median house or condo value ($) - Asian
Median house or condo value ($) - Hispanic or Latino
Median house or condo value ($) - American Indian and Alaska Native
Median house or condo value ($) - Multirace
Median house or condo value ($) - Other Race
Median resident age
Resident age diversity
Median resident age - Males
Median resident age - Females
Median resident age - White
Median resident age - Black or African American
Median resident age - Asian
Median resident age - Hispanic or Latino
Median resident age - American Indian and Alaska Native
Median resident age - Multirace
Median resident age - Other Race
Median resident age - Males - White
Median resident age - Males - Black or African American
Median resident age - Males - Asian
Median resident age - Males - Hispanic or Latino
Median resident age - Males - American Indian and Alaska Native
Median resident age - Males - Multirace
Median resident age - Males - Other Race
Median resident age - Females - White
Median resident age - Females - Black or African American
Median resident age - Females - Asian
Median resident age - Females - Hispanic or Latino
Median resident age - Females - American Indian and Alaska Native
Median resident age - Females - Multirace
Median resident age - Females - Other Race
Commute - mean travel time to work (minutes)
Travel time to work - Less than 5 minutes (%)
Travel time to work - Less than 5 minutes (% change since 2000)
Travel time to work - 5 to 9 minutes (%)
Travel time to work - 5 to 9 minutes (% change since 2000)
Travel time to work - 10 to 19 minutes (%)
Travel time to work - 10 to 19 minutes (% change since 2000)
Travel time to work - 20 to 29 minutes (%)
Travel time to work - 20 to 29 minutes (% change since 2000)
Travel time to work - 30 to 39 minutes (%)
Travel time to work - 30 to 39 minutes (% change since 2000)
Travel time to work - 40 to 59 minutes (%)
Travel time to work - 40 to 59 minutes (% change since 2000)
Travel time to work - 60 to 89 minutes (%)
Travel time to work - 60 to 89 minutes (% change since 2000)
Travel time to work - 90 or more minutes (%)
Travel time to work - 90 or more minutes (% change since 2000)
Marital status - Never married (%)
Marital status - Now married (%)
Marital status - Separated (%)
Marital status - Widowed (%)
Marital status - Divorced (%)
Median family income ($)
Median family income (% change since 2000)
Median non-family income ($)
Median non-family income (% change since 2000)
Median per capita income ($)
Median per capita income (% change since 2000)
Median family income ($) - White
Median family income ($) - Black or African American
Median family income ($) - Asian
Median family income ($) - Hispanic or Latino
Median family income ($) - American Indian and Alaska Native
Median family income ($) - Multirace
Median family income ($) - Other Race
Median year house/condo built
Median year apartment built
Year house built - Built 2005 or later (%)
Year house built - Built 2000 to 2004 (%)
Year house built - Built 1990 to 1999 (%)
Year house built - Built 1980 to 1989 (%)
Year house built - Built 1970 to 1979 (%)
Year house built - Built 1960 to 1969 (%)
Year house built - Built 1950 to 1959 (%)
Year house built - Built 1940 to 1949 (%)
Year house built - Built 1939 or earlier (%)
Average household size
Household density (households per square mile)
Average household size - White
Average household size - Black or African American
Average household size - Asian
Average household size - Hispanic or Latino
Average household size - American Indian and Alaska Native
Average household size - Multirace
Average household size - Other Race
Occupied housing units (%)
Vacant housing units (%)
Owner occupied housing units (%)
Renter occupied housing units (%)
Vacancy status - For rent (%)
Vacancy status - For sale only (%)
Vacancy status - Rented or sold, not occupied (%)
Vacancy status - For seasonal, recreational, or occasional use (%)
Vacancy status - For migrant workers (%)
Vacancy status - Other vacant (%)
Residents with income below the poverty level (%)
Residents with income below 50% of the poverty level (%)
Children below poverty level (%)
Poor families by family type - Married-couple family (%)
Poor families by family type - Male, no wife present (%)
Poor families by family type - Female, no husband present (%)
Poverty status for native-born residents (%)
Poverty status for foreign-born residents (%)
Poverty among high school graduates not in families (%)
Poverty among people who did not graduate high school not in families (%)
Residents with income below the poverty level (%) - White
Residents with income below the poverty level (%) - Black or African American
Residents with income below the poverty level (%) - Asian
Residents with income below the poverty level (%) - Hispanic or Latino
Residents with income below the poverty level (%) - American Indian and Alaska Native
Residents with income below the poverty level (%) - Multirace
Residents with income below the poverty level (%) - Other Race
Air pollution - Air Quality Index (AQI)
Air pollution - CO
Air pollution - NO2
Air pollution - SO2
Air pollution - Ozone
Air pollution - PM10
Air pollution - PM25
Air pollution - Pb
Crime - Murders per 100,000 population
Crime - Rapes per 100,000 population
Crime - Robberies per 100,000 population
Crime - Assaults per 100,000 population
Crime - Burglaries per 100,000 population
Crime - Thefts per 100,000 population
Crime - Auto thefts per 100,000 population
Crime - Arson per 100,000 population
Crime - City-data.com crime index
Crime - Violent crime index
Crime - Property crime index
Crime - Murders per 100,000 population (5 year average)
Crime - Rapes per 100,000 population (5 year average)
Crime - Robberies per 100,000 population (5 year average)
Crime - Assaults per 100,000 population (5 year average)
Crime - Burglaries per 100,000 population (5 year average)
Crime - Thefts per 100,000 population (5 year average)
Crime - Auto thefts per 100,000 population (5 year average)
Crime - Arson per 100,000 population (5 year average)
Crime - City-data.com crime index (5 year average)
Crime - Violent crime index (5 year average)
Crime - Property crime index (5 year average)
1996 Presidential Elections Results (%) - Democratic Party (Clinton)
1996 Presidential Elections Results (%) - Republican Party (Dole)
1996 Presidential Elections Results (%) - Other
2000 Presidential Elections Results (%) - Democratic Party (Gore)
2000 Presidential Elections Results (%) - Republican Party (Bush)
2000 Presidential Elections Results (%) - Other
2004 Presidential Elections Results (%) - Democratic Party (Kerry)
2004 Presidential Elections Results (%) - Republican Party (Bush)
2004 Presidential Elections Results (%) - Other
2008 Presidential Elections Results (%) - Democratic Party (Obama)
2008 Presidential Elections Results (%) - Republican Party (McCain)
2008 Presidential Elections Results (%) - Other
2012 Presidential Elections Results (%) - Democratic Party (Obama)
2012 Presidential Elections Results (%) - Republican Party (Romney)
2012 Presidential Elections Results (%) - Other
2016 Presidential Elections Results (%) - Democratic Party (Clinton)
2016 Presidential Elections Results (%) - Republican Party (Trump)
2016 Presidential Elections Results (%) - Other
2020 Presidential Elections Results (%) - Democratic Party (Biden)
2020 Presidential Elections Results (%) - Republican Party (Trump)
2020 Presidential Elections Results (%) - Other
Ancestries Reported - Arab (%)
Ancestries Reported - Czech (%)
Ancestries Reported - Danish (%)
Ancestries Reported - Dutch (%)
Ancestries Reported - English (%)
Ancestries Reported - French (%)
Ancestries Reported - French Canadian (%)
Ancestries Reported - German (%)
Ancestries Reported - Greek (%)
Ancestries Reported - Hungarian (%)
Ancestries Reported - Irish (%)
Ancestries Reported - Italian (%)
Ancestries Reported - Lithuanian (%)
Ancestries Reported - Norwegian (%)
Ancestries Reported - Polish (%)
Ancestries Reported - Portuguese (%)
Ancestries Reported - Russian (%)
Ancestries Reported - Scotch-Irish (%)
Ancestries Reported - Scottish (%)
Ancestries Reported - Slovak (%)
Ancestries Reported - Subsaharan African (%)
Ancestries Reported - Swedish (%)
Ancestries Reported - Swiss (%)
Ancestries Reported - Ukrainian (%)
Ancestries Reported - United States (%)
Ancestries Reported - Welsh (%)
Ancestries Reported - West Indian (%)
Ancestries Reported - Other (%)
Educational Attainment - No schooling completed (%)
Educational Attainment - Less than high school (%)
Educational Attainment - High school or equivalent (%)
Educational Attainment - Less than 1 year of college (%)
Educational Attainment - 1 or more years of college (%)
Educational Attainment - Associate degree (%)
Educational Attainment - Bachelor's degree (%)
Educational Attainment - Master's degree (%)
Educational Attainment - Professional school degree (%)
Educational Attainment - Doctorate degree (%)
School Enrollment - Nursery, preschool (%)
School Enrollment - Kindergarten (%)
School Enrollment - Grade 1 to 4 (%)
School Enrollment - Grade 5 to 8 (%)
School Enrollment - Grade 9 to 12 (%)
School Enrollment - College undergrad (%)
School Enrollment - Graduate or professional (%)
School Enrollment - Not enrolled in school (%)
School enrollment - Public schools (%)
School enrollment - Private schools (%)
School enrollment - Not enrolled (%)
Median number of rooms in houses and condos
Median number of rooms in apartments
Housing units lacking complete plumbing facilities (%)
Housing units lacking complete kitchen facilities (%)
Density of houses
Urban houses (%)
Rural houses (%)
Households with people 60 years and over (%)
Households with people 65 years and over (%)
Households with people 75 years and over (%)
Households with one or more nonrelatives (%)
Households with no nonrelatives (%)
Population in households (%)
Family households (%)
Nonfamily households (%)
Population in families (%)
Family households with own children (%)
Median number of bedrooms in owner occupied houses
Mean number of bedrooms in owner occupied houses
Median number of bedrooms in renter occupied houses
Mean number of bedrooms in renter occupied houses
Median number of vehichles in owner occupied houses
Mean number of vehichles in owner occupied houses
Median number of vehichles in renter occupied houses
Mean number of vehichles in renter occupied houses
Mortgage status - with mortgage (%)
Mortgage status - with second mortgage (%)
Mortgage status - with home equity loan (%)
Mortgage status - with both second mortgage and home equity loan (%)
Mortgage status - without a mortgage (%)
Average family size
Average family size - White
Average family size - Black or African American
Average family size - Asian
Average family size - Hispanic or Latino
Average family size - American Indian and Alaska Native
Average family size - Multirace
Average family size - Other Race
Geographical mobility - Same house 1 year ago (%)
Geographical mobility - Moved within same county (%)
Geographical mobility - Moved from different county within same state (%)
Geographical mobility - Moved from different state (%)
Geographical mobility - Moved from abroad (%)
Place of birth - Born in state of residence (%)
Place of birth - Born in other state (%)
Place of birth - Native, outside of US (%)
Place of birth - Foreign born (%)
Housing units in structures - 1, detached (%)
Housing units in structures - 1, attached (%)
Housing units in structures - 2 (%)
Housing units in structures - 3 or 4 (%)
Housing units in structures - 5 to 9 (%)
Housing units in structures - 10 to 19 (%)
Housing units in structures - 20 to 49 (%)
Housing units in structures - 50 or more (%)
Housing units in structures - Mobile home (%)
Housing units in structures - Boat, RV, van, etc. (%)
House/condo owner moved in on average (years ago)
Renter moved in on average (years ago)
Year householder moved into unit - Moved in 1999 to March 2000 (%)
Year householder moved into unit - Moved in 1995 to 1998 (%)
Year householder moved into unit - Moved in 1990 to 1994 (%)
Year householder moved into unit - Moved in 1980 to 1989 (%)
Year householder moved into unit - Moved in 1970 to 1979 (%)
Year householder moved into unit - Moved in 1969 or earlier (%)
Means of transportation to work - Drove car alone (%)
Means of transportation to work - Carpooled (%)
Means of transportation to work - Public transportation (%)
Means of transportation to work - Bus or trolley bus (%)
Means of transportation to work - Streetcar or trolley car (%)
Means of transportation to work - Subway or elevated (%)
Means of transportation to work - Railroad (%)
Means of transportation to work - Ferryboat (%)
Means of transportation to work - Taxicab (%)
Means of transportation to work - Motorcycle (%)
Means of transportation to work - Bicycle (%)
Means of transportation to work - Walked (%)
Means of transportation to work - Other means (%)
Working at home (%)
Industry diversity
Most Common Industries - Agriculture, forestry, fishing and hunting, and mining (%)
Most Common Industries - Agriculture, forestry, fishing and hunting (%)
Most Common Industries - Mining, quarrying, and oil and gas extraction (%)
Most Common Industries - Construction (%)
Most Common Industries - Manufacturing (%)
Most Common Industries - Wholesale trade (%)
Most Common Industries - Retail trade (%)
Most Common Industries - Transportation and warehousing, and utilities (%)
Most Common Industries - Transportation and warehousing (%)
Most Common Industries - Utilities (%)
Most Common Industries - Information (%)
Most Common Industries - Finance and insurance, and real estate and rental and leasing (%)
Most Common Industries - Finance and insurance (%)
Most Common Industries - Real estate and rental and leasing (%)
Most Common Industries - Professional, scientific, and management, and administrative and waste management services (%)
Most Common Industries - Professional, scientific, and technical services (%)
Most Common Industries - Management of companies and enterprises (%)
Most Common Industries - Administrative and support and waste management services (%)
Most Common Industries - Educational services, and health care and social assistance (%)
Most Common Industries - Educational services (%)
Most Common Industries - Health care and social assistance (%)
Most Common Industries - Arts, entertainment, and recreation, and accommodation and food services (%)
Most Common Industries - Arts, entertainment, and recreation (%)
Most Common Industries - Accommodation and food services (%)
Most Common Industries - Other services, except public administration (%)
Most Common Industries - Public administration (%)
Occupation diversity
Most Common Occupations - Management, business, science, and arts occupations (%)
Most Common Occupations - Management, business, and financial occupations (%)
Most Common Occupations - Management occupations (%)
Most Common Occupations - Business and financial operations occupations (%)
Most Common Occupations - Computer, engineering, and science occupations (%)
Most Common Occupations - Computer and mathematical occupations (%)
Most Common Occupations - Architecture and engineering occupations (%)
Most Common Occupations - Life, physical, and social science occupations (%)
Most Common Occupations - Education, legal, community service, arts, and media occupations (%)
Most Common Occupations - Community and social service occupations (%)
Most Common Occupations - Legal occupations (%)
Most Common Occupations - Education, training, and library occupations (%)
Most Common Occupations - Arts, design, entertainment, sports, and media occupations (%)
Most Common Occupations - Healthcare practitioners and technical occupations (%)
Most Common Occupations - Health diagnosing and treating practitioners and other technical occupations (%)
Most Common Occupations - Health technologists and technicians (%)
Most Common Occupations - Service occupations (%)
Most Common Occupations - Healthcare support occupations (%)
Most Common Occupations - Protective service occupations (%)
Most Common Occupations - Fire fighting and prevention, and other protective service workers including supervisors (%)
Most Common Occupations - Law enforcement workers including supervisors (%)
Most Common Occupations - Food preparation and serving related occupations (%)
Most Common Occupations - Building and grounds cleaning and maintenance occupations (%)
Most Common Occupations - Personal care and service occupations (%)
Most Common Occupations - Sales and office occupations (%)
Most Common Occupations - Sales and related occupations (%)
Most Common Occupations - Office and administrative support occupations (%)
Most Common Occupations - Natural resources, construction, and maintenance occupations (%)
Most Common Occupations - Farming, fishing, and forestry occupations (%)
Most Common Occupations - Construction and extraction occupations (%)
Most Common Occupations - Installation, maintenance, and repair occupations (%)
Most Common Occupations - Production, transportation, and material moving occupations (%)
Most Common Occupations - Production occupations (%)
Most Common Occupations - Transportation occupations (%)
Most Common Occupations - Material moving occupations (%)
People in Group quarters - Institutionalized population (%)
People in Group quarters - Correctional institutions (%)
People in Group quarters - Federal prisons and detention centers (%)
People in Group quarters - Halfway houses (%)
People in Group quarters - Local jails and other confinement facilities (including police lockups) (%)
People in Group quarters - Military disciplinary barracks (%)
People in Group quarters - State prisons (%)
People in Group quarters - Other types of correctional institutions (%)
People in Group quarters - Nursing homes (%)
People in Group quarters - Hospitals/wards, hospices, and schools for the handicapped (%)
People in Group quarters - Hospitals/wards and hospices for chronically ill (%)
People in Group quarters - Hospices or homes for chronically ill (%)
People in Group quarters - Military hospitals or wards for chronically ill (%)
People in Group quarters - Other hospitals or wards for chronically ill (%)
People in Group quarters - Hospitals or wards for drug/alcohol abuse (%)
People in Group quarters - Mental (Psychiatric) hospitals or wards (%)
People in Group quarters - Schools, hospitals, or wards for the mentally retarded (%)
People in Group quarters - Schools, hospitals, or wards for the physically handicapped (%)
People in Group quarters - Institutions for the deaf (%)
People in Group quarters - Institutions for the blind (%)
People in Group quarters - Orthopedic wards and institutions for the physically handicapped (%)
People in Group quarters - Wards in general hospitals for patients who have no usual home elsewhere (%)
People in Group quarters - Wards in military hospitals for patients who have no usual home elsewhere (%)
People in Group quarters - Juvenile institutions (%)
People in Group quarters - Long-term care (%)
People in Group quarters - Homes for abused, dependent, and neglected children (%)
People in Group quarters - Residential treatment centers for emotionally disturbed children (%)
People in Group quarters - Training schools for juvenile delinquents (%)
People in Group quarters - Short-term care, detention or diagnostic centers for delinquent children (%)
People in Group quarters - Type of juvenile institution unknown (%)
People in Group quarters - Noninstitutionalized population (%)
People in Group quarters - College dormitories (includes college quarters off campus) (%)
People in Group quarters - Military quarters (%)
People in Group quarters - On base (%)
People in Group quarters - Barracks, unaccompanied personnel housing (UPH), (Enlisted/Officer), ;and similar group living quarters for military personnel (%)
People in Group quarters - Transient quarters for temporary residents (%)
People in Group quarters - Military ships (%)
People in Group quarters - Group homes (%)
People in Group quarters - Homes or halfway houses for drug/alcohol abuse (%)
People in Group quarters - Homes for the mentally ill (%)
People in Group quarters - Homes for the mentally retarded (%)
People in Group quarters - Homes for the physically handicapped (%)
People in Group quarters - Other group homes (%)
People in Group quarters - Religious group quarters (%)
People in Group quarters - Dormitories (%)
People in Group quarters - Agriculture workers' dormitories on farms (%)
People in Group quarters - Job Corps and vocational training facilities (%)
People in Group quarters - Other workers' dormitories (%)
People in Group quarters - Crews of maritime vessels (%)
People in Group quarters - Other nonhousehold living situations (%)
People in Group quarters - Other noninstitutional group quarters (%)
Residents speaking English at home (%)
Residents speaking English at home - Born in the United States (%)
Residents speaking English at home - Native, born elsewhere (%)
Residents speaking English at home - Foreign born (%)
Residents speaking Spanish at home (%)
Residents speaking Spanish at home - Born in the United States (%)
Residents speaking Spanish at home - Native, born elsewhere (%)
Residents speaking Spanish at home - Foreign born (%)
Residents speaking other language at home (%)
Residents speaking other language at home - Born in the United States (%)
Residents speaking other language at home - Native, born elsewhere (%)
Residents speaking other language at home - Foreign born (%)
Class of Workers - Employee of private company (%)
Class of Workers - Self-employed in own incorporated business (%)
Class of Workers - Private not-for-profit wage and salary workers (%)
Class of Workers - Local government workers (%)
Class of Workers - State government workers (%)
Class of Workers - Federal government workers (%)
Class of Workers - Self-employed workers in own not incorporated business and Unpaid family workers (%)
House heating fuel used in houses and condos - Utility gas (%)
House heating fuel used in houses and condos - Bottled, tank, or LP gas (%)
House heating fuel used in houses and condos - Electricity (%)
House heating fuel used in houses and condos - Fuel oil, kerosene, etc. (%)
House heating fuel used in houses and condos - Coal or coke (%)
House heating fuel used in houses and condos - Wood (%)
House heating fuel used in houses and condos - Solar energy (%)
House heating fuel used in houses and condos - Other fuel (%)
House heating fuel used in houses and condos - No fuel used (%)
House heating fuel used in apartments - Utility gas (%)
House heating fuel used in apartments - Bottled, tank, or LP gas (%)
House heating fuel used in apartments - Electricity (%)
House heating fuel used in apartments - Fuel oil, kerosene, etc. (%)
House heating fuel used in apartments - Coal or coke (%)
House heating fuel used in apartments - Wood (%)
House heating fuel used in apartments - Solar energy (%)
House heating fuel used in apartments - Other fuel (%)
House heating fuel used in apartments - No fuel used (%)
Armed forces status - In Armed Forces (%)
Armed forces status - Civilian (%)
Armed forces status - Civilian - Veteran (%)
Armed forces status - Civilian - Nonveteran (%)
Fatal accidents locations in years 2005-2021
Fatal accidents locations in 2005
Fatal accidents locations in 2006
Fatal accidents locations in 2007
Fatal accidents locations in 2008
Fatal accidents locations in 2009
Fatal accidents locations in 2010
Fatal accidents locations in 2011
Fatal accidents locations in 2012
Fatal accidents locations in 2013
Fatal accidents locations in 2014
Fatal accidents locations in 2015
Fatal accidents locations in 2016
Fatal accidents locations in 2017
Fatal accidents locations in 2018
Fatal accidents locations in 2019
Fatal accidents locations in 2020
Fatal accidents locations in 2021
Alcohol use - People drinking some alcohol every month (%)
Alcohol use - People not drinking at all (%)
Alcohol use - Average days/month drinking alcohol
Alcohol use - Average drinks/week
Alcohol use - Average days/year people drink much
Audiometry - Average condition of hearing (%)
Audiometry - People that can hear a whisper from across a quiet room (%)
Audiometry - People that can hear normal voice from across a quiet room (%)
Audiometry - Ears ringing, roaring, buzzing (%)
Audiometry - Had a job exposure to loud noise (%)
Audiometry - Had off-work exposure to loud noise (%)
Blood Pressure & Cholesterol - Has high blood pressure (%)
Blood Pressure & Cholesterol - Checking blood pressure at home (%)
Blood Pressure & Cholesterol - Frequently checking blood cholesterol (%)
Blood Pressure & Cholesterol - Has high cholesterol level (%)
Consumer Behavior - Money monthly spent on food at supermarket/grocery store
Consumer Behavior - Money monthly spent on food at other stores
Consumer Behavior - Money monthly spent on eating out
Consumer Behavior - Money monthly spent on carryout/delivered foods
Consumer Behavior - Income spent on food at supermarket/grocery store (%)
Consumer Behavior - Income spent on food at other stores (%)
Consumer Behavior - Income spent on eating out (%)
Consumer Behavior - Income spent on carryout/delivered foods (%)
Current Health Status - General health condition (%)
Current Health Status - Blood donors (%)
Current Health Status - Has blood ever tested for HIV virus (%)
Current Health Status - Left-handed people (%)
Dermatology - People using sunscreen (%)
Diabetes - Diabetics (%)
Diabetes - Had a blood test for high blood sugar (%)
Diabetes - People taking insulin (%)
Diet Behavior & Nutrition - Diet health (%)
Diet Behavior & Nutrition - Milk product consumption (# of products/month)
Diet Behavior & Nutrition - Meals not home prepared (#/week)
Diet Behavior & Nutrition - Meals from fast food or pizza place (#/week)
Diet Behavior & Nutrition - Ready-to-eat foods (#/month)
Diet Behavior & Nutrition - Frozen meals/pizza (#/month)
Drug Use - People that ever used marijuana or hashish (%)
Drug Use - Ever used hard drugs (%)
Drug Use - Ever used any form of cocaine (%)
Drug Use - Ever used heroin (%)
Drug Use - Ever used methamphetamine (%)
Health Insurance - People covered by health insurance (%)
Kidney Conditions-Urology - Avg. # of times urinating at night
Medical Conditions - People with asthma (%)
Medical Conditions - People with anemia (%)
Medical Conditions - People with psoriasis (%)
Medical Conditions - People with overweight (%)
Medical Conditions - Elderly people having difficulties in thinking or remembering (%)
Medical Conditions - People who ever received blood transfusion (%)
Medical Conditions - People having trouble seeing even with glass/contacts (%)
Medical Conditions - People with arthritis (%)
Medical Conditions - People with gout (%)
Medical Conditions - People with congestive heart failure (%)
Medical Conditions - People with coronary heart disease (%)
Medical Conditions - People with angina pectoris (%)
Medical Conditions - People who ever had heart attack (%)
Medical Conditions - People who ever had stroke (%)
Medical Conditions - People with emphysema (%)
Medical Conditions - People with thyroid problem (%)
Medical Conditions - People with chronic bronchitis (%)
Medical Conditions - People with any liver condition (%)
Medical Conditions - People who ever had cancer or malignancy (%)
Mental Health - People who have little interest in doing things (%)
Mental Health - People feeling down, depressed, or hopeless (%)
Mental Health - People who have trouble sleeping or sleeping too much (%)
Mental Health - People feeling tired or having little energy (%)
Mental Health - People with poor appetite or overeating (%)
Mental Health - People feeling bad about themself (%)
Mental Health - People who have trouble concentrating on things (%)
Mental Health - People moving or speaking slowly or too fast (%)
Mental Health - People having thoughts they would be better off dead (%)
Oral Health - Average years since last visit a dentist
Oral Health - People embarrassed because of mouth (%)
Oral Health - People with gum disease (%)
Oral Health - General health of teeth and gums (%)
Oral Health - Average days a week using dental floss/device
Oral Health - Average days a week using mouthwash for dental problem
Oral Health - Average number of teeth
Pesticide Use - Households using pesticides to control insects (%)
Pesticide Use - Households using pesticides to kill weeds (%)
Physical Activity - People doing vigorous-intensity work activities (%)
Physical Activity - People doing moderate-intensity work activities (%)
Physical Activity - People walking or bicycling (%)
Physical Activity - People doing vigorous-intensity recreational activities (%)
Physical Activity - People doing moderate-intensity recreational activities (%)
Physical Activity - Average hours a day doing sedentary activities
Physical Activity - Average hours a day watching TV or videos
Physical Activity - Average hours a day using computer
Physical Functioning - People having limitations keeping them from working (%)
Physical Functioning - People limited in amount of work they can do (%)
Physical Functioning - People that need special equipment to walk (%)
Physical Functioning - People experiencing confusion/memory problems (%)
Physical Functioning - People requiring special healthcare equipment (%)
Prescription Medications - Average number of prescription medicines taking
Preventive Aspirin Use - Adults 40+ taking low-dose aspirin (%)
Reproductive Health - Vaginal deliveries (%)
Reproductive Health - Cesarean deliveries (%)
Reproductive Health - Deliveries resulted in a live birth (%)
Reproductive Health - Pregnancies resulted in a delivery (%)
Reproductive Health - Women breastfeeding newborns (%)
Reproductive Health - Women that had a hysterectomy (%)
Reproductive Health - Women that had both ovaries removed (%)
Reproductive Health - Women that have ever taken birth control pills (%)
Reproductive Health - Women taking birth control pills (%)
Reproductive Health - Women that have ever used Depo-Provera or injectables (%)
Reproductive Health - Women that have ever used female hormones (%)
Sexual Behavior - People 18+ that ever had sex (vaginal, anal, or oral) (%)
Sexual Behavior - Males 18+ that ever had vaginal sex with a woman (%)
Sexual Behavior - Males 18+ that ever performed oral sex on a woman (%)
Sexual Behavior - Males 18+ that ever had anal sex with a woman (%)
Sexual Behavior - Males 18+ that ever had any sex with a man (%)
Sexual Behavior - Females 18+ that ever had vaginal sex with a man (%)
Sexual Behavior - Females 18+ that ever performed oral sex on a man (%)
Sexual Behavior - Females 18+ that ever had anal sex with a man (%)
Sexual Behavior - Females 18+ that ever had any kind of sex with a woman (%)
Sexual Behavior - Average age people first had sex
Sexual Behavior - Average number of female sex partners in lifetime (males 18+)
Sexual Behavior - Average number of female vaginal sex partners in lifetime (males 18+)
Sexual Behavior - Average age people first performed oral sex on a woman (18+)
Sexual Behavior - Average number of woman performed oral sex on in lifetime (18+)
Sexual Behavior - Average number of male sex partners in lifetime (males 18+)
Sexual Behavior - Average number of male anal sex partners in lifetime (males 18+)
Sexual Behavior - Average age people first performed oral sex on a man (18+)
Sexual Behavior - Average number of male oral sex partners in lifetime (18+)
Sexual Behavior - People using protection when performing oral sex (%)
Sexual Behavior - Average number of times people have vaginal or anal sex a year
Sexual Behavior - People having sex without condom (%)
Sexual Behavior - Average number of male sex partners in lifetime (females 18+)
Sexual Behavior - Average number of male vaginal sex partners in lifetime (females 18+)
Sexual Behavior - Average number of female sex partners in lifetime (females 18+)
Sexual Behavior - Circumcised males 18+ (%)
Sleep Disorders - Average hours sleeping at night
Sleep Disorders - People that has trouble sleeping (%)
Smoking-Cigarette Use - People smoking cigarettes (%)
Taste & Smell - People 40+ having problems with smell (%)
Taste & Smell - People 40+ having problems with taste (%)
Taste & Smell - People 40+ that ever had wisdom teeth removed (%)
Taste & Smell - People 40+ that ever had tonsils teeth removed (%)
Taste & Smell - People 40+ that ever had a loss of consciousness because of a head injury (%)
Taste & Smell - People 40+ that ever had a broken nose or other serious injury to face or skull (%)
Taste & Smell - People 40+ that ever had two or more sinus infections (%)
Weight - Average height (inches)
Weight - Average weight (pounds)
Weight - Average BMI
Weight - People that are obese (%)
Weight - People that ever were obese (%)
Weight - People trying to lose weight (%)
100%
urban population.
Estimated median house/condo value in 2022: $178,601
45415:
$178,601Ohio:
$204,100
According to our research of Ohio and other state lists, there were 27 registered sex offenders living in 45415 zip code as of April 27, 2024 . The ratio of all residents to sex offenders in zip code 45415 is 474 to 1.The ratio of registered sex offenders to all residents in this zip code is near the state average.
Median resident age: This zip code:
43.2 yearsOhio median age:
39.9 years
Average household size: This zip code:
2.2 peopleOhio:
2.4 people
Averages for the 2020 tax year for zip code 45415, filed in 2021:
Average Adjusted Gross Income (AGI) in 2020: $56,242 (Individual Income Tax Returns) Here:
$56,242State:
$67,288
Salary/wage: $47,812 (reported on 80.3% of returns )Here:
$47,812State:
$55,628
(% of AGI for various income ranges: 1119.9% for AGIs below $25k , 3497.9% for AGIs $25k-50k , 6366.5% for AGIs $50k-75k , 8983.9% for AGIs $75k-100k , 17376.7% for AGIs $100k-200k , 66816.7% for AGIs over 200k ) Taxable interest for individuals: $967 (reported on 30.9% of returns )This zip code:
$967Ohio:
$1,518
(% of AGI for various income ranges: 9.5% for AGIs below $25k , 21.0% for AGIs $25k-50k , 33.1% for AGIs $50k-75k , 49.3% for AGIs $75k-100k , 118.1% for AGIs $100k-200k , 1723.3% for AGIs over 200k ) Ordinary dividends: $7,214 (reported on 15.6% of returns )(% of AGI for various income ranges: 18.1% for AGIs below $25k , 35.7% for AGIs $25k-50k , 78.8% for AGIs $50k-75k , 199.1% for AGIs $75k-100k , 290.7% for AGIs $100k-200k , 12496.7% for AGIs over 200k ) Net capital gain/loss in AGI: +$8,552 (reported on 12.9% of returns )Here:
+$8,552State:
+$18,919
(% of AGI for various income ranges: 7.3% for AGIs below $25k , 17.9% for AGIs $25k-50k , 65.8% for AGIs $50k-75k , 162.0% for AGIs $75k-100k , 485.7% for AGIs $100k-200k , 11600.0% for AGIs over 200k ) Profit/loss from business: +$8,179 (reported on 13.9% of returns )Here:
+$8,179State:
+$13,744
(% of AGI for various income ranges: 57.1% for AGIs below $25k , 85.9% for AGIs $25k-50k , 153.7% for AGIs $50k-75k , 90.9% for AGIs $75k-100k , 872.4% for AGIs $100k-200k ) Taxable individual retirement arrangement distribution: $16,048 (reported on 10.1% of returns )45415:
$16,048Ohio:
$18,876
(% of AGI for various income ranges: 55.5% for AGIs below $25k , 109.9% for AGIs $25k-50k , 191.9% for AGIs $50k-75k , 465.2% for AGIs $75k-100k , 680.7% for AGIs $100k-200k , 5706.7% for AGIs over 200k ) Total itemized deductions: $26,843 (reported on 6.6% of returns )Here:
$26,843State:
$33,869
(% of AGI for various income ranges: 34.1% for AGIs below $25k , 118.0% for AGIs $25k-50k , 285.6% for AGIs $50k-75k , 415.5% for AGIs $75k-100k , 847.9% for AGIs $100k-200k , 5173.3% for AGIs over 200k ) Charity contributions: $10,400 (reported on 5.1% of returns )Here:
$10,400State:
$14,577
(% of AGI for various income ranges: 20.4% for AGIs $25k-50k , 59.9% for AGIs $50k-75k , 132.3% for AGIs $75k-100k , 336.0% for AGIs $100k-200k , 2323.3% for AGIs over 200k ) Taxes paid: $7,136 (reported on 6.1% of returns )(% of AGI for various income ranges: 3.6% for AGIs below $25k , 21.3% for AGIs $25k-50k , 60.1% for AGIs $50k-75k , 123.6% for AGIs $75k-100k , 250.2% for AGIs $100k-200k , 1260.0% for AGIs over 200k ) Earned income credit: $2,098 (reported on 14.5% of returns )(% of AGI for various income ranges: 71.9% for AGIs below $25k , 64.6% for AGIs $25k-50k ) Percentage of individuals using paid preparers for their 2020 taxes: 92.0%(% for various income ranges: 91.0% for AGIs below $25k , 93.6% for AGIs $25k-50k , 92.0% for AGIs $50k-75k , 93.9% for AGIs $75k-100k , 91.1% for AGIs $100k-200k , 83.3% for AGIs over 200k )
Averages for the 2012 tax year for zip code 45415, filed in 2013:
Average Adjusted Gross Income (AGI) in 2012: $51,936 (Individual Income Tax Returns) Here:
$51,936State:
$54,926
Salary/wage: $42,129 (reported on 80.7% of returns )Here:
$42,129State:
$45,869
(% of AGI for various income ranges: 69.9% for AGIs below $25k , 72.7% for AGIs $25k-50k , 68.9% for AGIs $50k-75k , 71.6% for AGIs $75k-100k , 70.4% for AGIs $100k-200k , 34.5% for AGIs over 200k ) Taxable interest for individuals: $1,447 (reported on 34.7% of returns )This zip code:
$1,447Ohio:
$1,297
(% of AGI for various income ranges: 1.1% for AGIs below $25k , 0.7% for AGIs $25k-50k , 0.5% for AGIs $50k-75k , 0.6% for AGIs $75k-100k , 1.1% for AGIs $100k-200k , 2.1% for AGIs over 200k ) Ordinary dividends: $5,462 (reported on 20.5% of returns )(% of AGI for various income ranges: 1.6% for AGIs below $25k , 1.2% for AGIs $25k-50k , 1.3% for AGIs $50k-75k , 1.5% for AGIs $75k-100k , 1.8% for AGIs $100k-200k , 6.2% for AGIs over 200k ) Net capital gain/loss in AGI: +$4,373 (reported on 15.1% of returns )Here:
+$4,373State:
+$11,232
(% of AGI for various income ranges: 0.2% for AGIs $50k-75k , 0.7% for AGIs $75k-100k , 0.9% for AGIs $100k-200k , 6.3% for AGIs over 200k ) Profit/loss from business: +$10,127 (reported on 14.2% of returns )Here:
+$10,127State:
+$12,773
(% of AGI for various income ranges: 6.4% for AGIs below $25k , 2.0% for AGIs $25k-50k , 2.3% for AGIs $50k-75k , 1.8% for AGIs $75k-100k , 3.3% for AGIs $100k-200k , 2.2% for AGIs over 200k ) Taxable individual retirement arrangement distribution: $12,781 (reported on 12.6% of returns )45415:
$12,781Ohio:
$14,511
(% of AGI for various income ranges: 3.5% for AGIs below $25k , 2.9% for AGIs $25k-50k , 2.7% for AGIs $50k-75k , 2.6% for AGIs $75k-100k , 3.2% for AGIs $100k-200k , 4.1% for AGIs over 200k ) Self-employment retirement plans: $15,100 (reported on 0.5% of returns )45415:
$15,100Ohio:
$20,257
(% of AGI for various income ranges: 0.6% for AGIs $100k-200k ) Total itemized deductions: $18,784 (21% of AGI, reported on 36.3% of returns )Here:
$18,784State:
$21,278
Here:
20.8% of AGIState:
18.8% of AGI
(% of AGI for various income ranges: 8.8% for AGIs below $25k , 12.5% for AGIs $25k-50k , 13.7% for AGIs $50k-75k , 14.5% for AGIs $75k-100k , 15.1% for AGIs $100k-200k , 11.0% for AGIs over 200k ) Charity contributions: $4,271 (reported on 29.5% of returns )(% of AGI for various income ranges: 0.8% for AGIs below $25k , 1.9% for AGIs $25k-50k , 2.5% for AGIs $50k-75k , 2.5% for AGIs $75k-100k , 3.0% for AGIs $100k-200k , 3.0% for AGIs over 200k ) Taxes paid: $7,620 (reported on 36.1% of returns )(% of AGI for various income ranges: 1.9% for AGIs below $25k , 3.7% for AGIs $25k-50k , 4.9% for AGIs $50k-75k , 5.9% for AGIs $75k-100k , 7.0% for AGIs $100k-200k , 6.4% for AGIs over 200k ) Earned income credit: $2,134 (reported on 16.2% of returns )(% of AGI for various income ranges: 5.8% for AGIs below $25k , 0.9% for AGIs $25k-50k ) Percentage of individuals using paid preparers for their 2012 taxes: 45.2%(% for various income ranges: 38.3% for AGIs below $25k , 47.0% for AGIs $25k-50k , 49.0% for AGIs $50k-75k , 52.5% for AGIs $75k-100k , 48.4% for AGIs $100k-200k , 80.0% for AGIs over 200k )
Averages for the 2004 tax year for zip code 45415, filed in 2005:
Average Adjusted Gross Income (AGI) in 2004: $48,822 (Individual Income Tax Returns) Here:
$48,822State:
$44,480
Salary/wage: $42,743 (reported on 83.7% of returns )Here:
$42,743State:
$39,198
(% of AGI for various income ranges: 116.0% for AGIs below $10k , 69.6% for AGIs $10k-25k , 75.4% for AGIs $25k-50k , 77.0% for AGIs $50k-75k , 79.1% for AGIs $75k-100k , 66.0% for AGIs over 100k ) Taxable interest for individuals: $1,715 (reported on 48.8% of returns )This zip code:
$1,715Ohio:
$1,532
(% of AGI for various income ranges: 7.0% for AGIs below $10k , 3.3% for AGIs $10k-25k , 1.6% for AGIs $25k-50k , 1.3% for AGIs $50k-75k , 1.2% for AGIs $75k-100k , 1.8% for AGIs over 100k ) Taxable dividends: $3,699 (reported on 30.2% of returns )(% of AGI for various income ranges: 5.9% for AGIs below $10k , 2.1% for AGIs $10k-25k , 1.5% for AGIs $25k-50k , 1.5% for AGIs $50k-75k , 1.3% for AGIs $75k-100k , 3.6% for AGIs over 100k ) Net capital gain/loss: +$5,462 (reported on 22.6% of returns )Here:
+$5,462State:
+$8,582
(% of AGI for various income ranges: -3.0% for AGIs below $10k , 0.2% for AGIs $10k-25k , 0.4% for AGIs $25k-50k , 0.6% for AGIs $50k-75k , 1.8% for AGIs $75k-100k , 6.0% for AGIs over 100k ) Profit/loss from business: +$10,815 (reported on 13.8% of returns )Here:
+$10,815State:
+$10,813
(% of AGI for various income ranges: 5.6% for AGIs below $10k , 3.9% for AGIs $10k-25k , 2.4% for AGIs $25k-50k , 2.5% for AGIs $50k-75k , 2.7% for AGIs $75k-100k , 3.7% for AGIs over 100k ) IRA payment deduction: $3,000 (reported on 2.2% of returns )(% of AGI for various income ranges: 0.2% for AGIs $10k-25k , 0.2% for AGIs $25k-50k , 0.2% for AGIs $50k-75k , 0.1% for AGIs $75k-100k , 0.1% for AGIs over 100k ) Self-employed pension: $10,870 (reported on 0.8% of returns )Total itemized deductions: $16,833 (22% of AGI, reported on 46.0% of returns )Here:
$16,833State:
$17,503
Here:
21.5% of AGIState:
20.8% of AGI
(% of AGI for various income ranges: 17.8% for AGIs below $10k , 10.7% for AGIs $10k-25k , 14.5% for AGIs $25k-50k , 17.9% for AGIs $50k-75k , 18.0% for AGIs $75k-100k , 15.3% for AGIs over 100k ) Charity contributions deductions: $3,452 (4% of AGI, reported on 39.8% of returns )Here:
4.2% of AGIState:
3.4% of AGI
(% of AGI for various income ranges: 0.8% for AGIs below $10k , 1.3% for AGIs $10k-25k , 2.0% for AGIs $25k-50k , 2.7% for AGIs $50k-75k , 3.1% for AGIs $75k-100k , 3.6% for AGIs over 100k ) Total tax: $6,985 (reported on 79.8% of returns )(% of AGI for various income ranges: 3.1% for AGIs below $10k , 4.3% for AGIs $10k-25k , 7.5% for AGIs $25k-50k , 9.4% for AGIs $50k-75k , 10.5% for AGIs $75k-100k , 17.1% for AGIs over 100k ) Earned income credit: $1,520 (reported on 10.1% of returns )Percentage of individuals using paid preparers for their 2004 taxes: 52.2%(% for various income ranges: 40.7% for AGIs below $10k , 54.8% for AGIs $10k-25k , 55.7% for AGIs $25k-50k , 54.5% for AGIs $50k-75k , 49.8% for AGIs $75k-100k , 56.2% for AGIs over 100k )
Estimated median household income in 2022: This zip code:
$72,532Ohio:
$65,720
Nearest zip codes: 45416 ,
45414 ,
45406 ,
45405 ,
45377 ,
45426 .
Trotwood Zip Code Map
Percentage of family households: This zip code:
39.2%Ohio:
43.3%
Percentage of households with unmarried partners: This zip code:
8.2%Ohio:
44.6%
Likely homosexual households (counted as self-reported same-sex unmarried-partner households)
Lesbian couples: 0.1% of all households Gay men: 0.1% of all households
Household received Food Stamps/SNAP in the past 12 months: 529Household did not receive Food Stamps/SNAP in the past 12 months: 5,054
Women who had a birth in the past 12 months: 43 (14 now married , 28 unmarried) Women who did not have a birth in the past 12 months: 2,517 (882 now married , 1,635 unmarried)
Housing units in zip code 45415 with a mortgage: 2,480 (301
second mortgage , 18
home equity loan , 287
both second mortgage and home equity loan )
Houses without a mortgage: 69
Median monthly owner costs for units with a mortgage: $1,392
Median monthly owner costs for units without a mortgage: $563
Residents with income below the poverty level in 2022:
This zip code:
10.2%Whole state:
13.4%
Residents with income below 50% of the poverty level in 2022:
This zip code:
6.8%Whole state:
7.0%
Median number of rooms in houses and condos: Median number of rooms in apartments: Notable locations in this zip code not listed on our city pages
Click to draw/clear zip code borders Notable locations in zip code 45415: (A) , The Siena Sisters of Mercy Rest Home (B) , Heathcliff Office Park (C) , Singing Woods Office Park (D) , Clayton Fire Department Station 85 (E) , Feller's Farm (F) . Display/hide their locations on the map
Shopping Center: (1) . Display/hide its location on the map
Churches in zip code 45415 include: (A) , Saint Rita Catholic Church (B) . Display/hide their locations on the map
Cemetery: (1) . Display/hide its location on the map
Parks in zip code 45415 include: (1) , Shiloh Springs Park (2) , Harrison Community Park (3) , Heathcliff Wellfield Park (4) , Westbrook Road Park (5) , Northview Estate Park (6) . Display/hide their locations on the map
Year house built (houses)
0 2020 or later25 2010 to 2019152 2000 to 2009317 1990 to 1999684 1980 to 19891,326 1970 to 19791,277 1960 to 19691,087 1950 to 1959398 1940 to 1949430 1939 or earlier
Zip code 45415 household income distribution in 2022 230 Less than $10,000355 $10,000 to $14,99999 $15,000 to $19,999203 $20,000 to $24,999282 $25,000 to $29,999390 $30,000 to $34,999113 $35,000 to $39,999177 $40,000 to $44,999276 $45,000 to $49,999284 $50,000 to $59,999451 $60,000 to $74,999942 $75,000 to $99,999592 $100,000 to $124,999221 $125,000 to $149,999460 $150,000 to $199,999493 $200,000 or moreEstimate of home value of owner-occupied houses/condos in 2022 in zip code 45415 40 $10,000 to $14,99916 $15,000 to $19,99910 $30,000 to $34,99920 $35,000 to $39,99937 $40,000 to $49,99924 $50,000 to $59,99953 $60,000 to $69,99981 $70,000 to $79,999108 $80,000 to $89,999131 $90,000 to $99,999387 $100,000 to $124,999430 $125,000 to $149,999512 $150,000 to $174,999378 $175,000 to $199,999655 $200,000 to $249,999324 $250,000 to $299,99989 $300,000 to $399,99946 $400,000 to $499,9997 $1,500,000 to $1,999,999Rent paid by renters in 2022 in zip code 45415 88 $200 to $24917 $300 to $34914 $400 to $44976 $450 to $49921 $500 to $54990 $550 to $599308 $600 to $649279 $650 to $699203 $700 to $749247 $750 to $799170 $800 to $899142 $900 to $999130 $1,000 to $1,249135 $1,250 to $1,49916 $1,500 to $1,99937 No cash rent
Median gross rent in 2022: $899.
Estimated median house (or condo) value in 2022 for: White Non-Hispanic householders: $175,756Black or African American householders: $198,811American Indian or Alaska Native householders: $121,413Asian householders: $196,566Some other race householders: $205,848Two or more races householders: $216,477Hispanic or Latino householders: $67,368Estimated median house or condo value in 2022: $178,601
45415:
$178,601Ohio:
$204,100
Lower value quartile - upper value quartile: $126,179 - $240,270
Mean price in 2022: Detached houses: $222,056Here:
$222,056State:
$254,366
Townhouses or other attached units: $172,284Here:
$172,284State:
$225,733
Housing units in structures:
One, detached: 4,151One, attached: 113Two: 43 or 4: 3045 to 9: 29110 to 19: 43020 to 49: 26150 or more: 248Unemployment : 2.7%
Means of transportation to work in zip code 45415 74.3% 4,708 Drove a car alone13.7% 871 Carpooled1.2% 74 Bus or trolley bus0.2% 13 Walked1.2% 75 Other means8.3% 526 Worked at homeTravel time to work (commute) in zip code 45415 190 Less than 5 minutes642 5 to 9 minutes723 10 to 14 minutes1,330 15 to 19 minutes995 20 to 24 minutes412 25 to 29 minutes475 30 to 34 minutes159 35 to 39 minutes108 40 to 44 minutes335 45 to 59 minutes212 60 to 89 minutes141 90 or more minutes
Percentage of zip code residents living and working in this county: 83.1%
Household type by relationship:
Households: 12,581
Male householders: 2,869 (1,101 living alone ), Female householders: 2,718 (926 living alone )2,050 spouses (1,994 opposite-sex spouses ), 319 unmarried partners , (292 opposite-sex unmarried partners ), 3,299 children (3,026 natural , 142 adopted , 135 stepchildren ), 298 grandchildren , 71 brothers or sisters , 98 parents , 0 foster children , 267 other relatives , 285 non-relatives In group quarters: 307 (-1 institutionalized population )
Size of family households: 1,678 2-persons , 731 3-persons , 561 4-persons , 183 5-persons , 86 6-persons , 55 7-or-more-persons
Size of nonfamily households: 2,024 1-person , 194 2-persons , 26 3-persons , 15 4-persons , 47 5-persons
1,359 married couples with children. single-parent households (135 men , 760 women ).
94.7% of residents of 45415 zip code speak English at home. of residents speak Spanish at home (78% very well, 22% well ).of residents speak other Indo-European language at home (48% very well, 25% well, 28% not well ).of residents speak Asian or Pacific Island language at home (36% very well, 64% well ).of residents speak other language at home (51% very well, 41% well, 8% not well ).
Foreign born population: 603 (4.8%)
(62.4%
of them are naturalized citizens )
This zip code:
4.8%Whole state:
5.0%
29% Bhutan 14% Liberia 12% Nigeria 5% India 3% St. Vincent and the Grenadines 3% Costa Rica 3% Iraq 8% German 5% American 5% English 3% Irish 2% African 2% Polish 1% French Canadian
Year of entry for the foreign-born population
105 2010 or later 175 2000 to 2009 194 1990 to 1999 168 Before 1990
There are
230 Medical Specialists in Zip Code 45415 .
Facilities with environmental interests located in this zip code:
ARENA DODGE INC (924 SHILOH SPRINGS RD in DAYTON, OH)
Small Quantity Generators, between 100 kg and 1000 kg of hazardous waste/month (Resource Conservation and Recovery Act (tracking hazardous waste)) - notification Organizations: CHRYSLER REALTY INC (CONTACT/OWNER)
Housing units lacking complete kitchen facilities: 0.3%
59.9% Utility gas 37.4% Electricity 1.2% Fuel oil, kerosene, etc. 0.7% Bottled, tank, or LP gas
Population in 1990: 12,885.
Place of birth for U.S.-born residents:
This state: 8,992Northeast: 534Midwest: 1,023South: 1,115West: 228
61% of the 45415 zip code residents lived in the same house 5 years ago.
Out of people who lived in different houses, 73% lived in this county.
Out of people who lived in different counties, 50% lived in Ohio.
84% of the 45415 zip code residents lived in the same house 1 year ago.
Out of people who lived in different houses, 74% moved from this county.
Out of people who lived in different houses, 15% moved from different county within same state.
Out of people who lived in different houses, 4% moved from different state.
Out of people who lived in different houses, 0% moved from abroad.
Private vs. public school enrollment:
Students in private schools in grades 1 to 8 (elementary and middle school): 58
Students in private schools in grades 9 to 12 (high school): 67
Students in private undergraduate colleges: 56
Occupation by median earnings in the past 12 months ($)
257,190 Health technologists and technicians 104,682 Architecture and engineering occupations 84,063 Health diagnosing and treating practitioners and other technical occupations 80,101 Computer and mathematical occupations 75,581 Law enforcement workers including supervisors 72,152 Management occupations
Companies with federal contracts located in this zip code:
SCHULMAN,STANLEY (4140 CEDAR BLUFF CI in DAYTON, OH; small business) in 2 contracts from 2003 to 2004
$170,000 with Air Force for Other Special Studies and Analyses. Signed on 2004-02-18. Completion date: 2005-02-17.
, same as above. Signed on 2003-02-14. Completion date: 2003-12-19.
WEBB & SON SEWING MACHINE SALE (8630 FLAGLER ST in DAYTON, OH; small business) in 5 contracts from 2000 to 2005
Contracts for Motor Freight, Industrial Sewing Machines and Mobile Textile Repair Shops, Maintenance, Repair and Rebuilding of Equipment -- Service and Trade Equipment by Air ForceSigned by year: 2000: $26,966; 2001: $0; 2002: $0; 2003: $0; 2004: $20,850; 2005: -$3,777; 2006: $0.
Biggest contracts: with Air Force for Motor Freight. Signed on 2000-07-11. Completion date: 2000-10-09.
with Air Force for Industrial Sewing Machines and Mobile Textile Repair Shops. Signed on 2004-12-21. Completion date: 2005-01-24.
with Air Force for Maintenance, Repair and Rebuilding of Equipment -- Service and Trade Equipment. Signed on 2005-11-17. Completion date: 2006-12-17.
, same as above. Signed on 2004-12-17. Completion date: 2005-12-17.
Top industries in this zip code by the number of employees in 2005:
Health Care and Social Assistance: Offices of Physicians (except Mental Health Specialists) (20-49 employees: 8 establishments, 10-19 employees: 13 establishments, 5-9 employees: 11 establishments, 1-4 employees: 8 establishments)Health Care and Social Assistance: Psychiatric and Substance Abuse Hospitals (250-499: 1)Health Care and Social Assistance: Nursing Care Facilities (100-249: 2)Accommodation and Food Services: Limited-Service Restaurants (50-99: 2, 20-49: 3, 10-19: 2, 5-9: 2, 1-4: 1)Accommodation and Food Services: Full-Service Restaurants (50-99: 1, 20-49: 4, 1-4: 4)Health Care and Social Assistance: Home Health Care Services (100-249: 1)Health Care and Social Assistance: Offices of Dentists (10-19: 3, 5-9: 13, 1-4: 8)Educational Services: Elementary and Secondary Schools (50-99: 1, 10-19: 1)
People in group quarters in 2010:
394 people in nursing facilities/skilled-nursing facilities
25 people in group homes intended for adults
3 people in residential treatment centers for adults
People in group quarters in 2000:
179 people in nursing homes
99 people in schools, hospitals, or wards for the intellectually disabled
21 people in other group homes
9 people in mental (psychiatric) hospitals or wards
4 people in homes for the mentally retarded
Fatal accident statistics in 2014:
Fatal accident count: 2Vehicles involved in fatal accidents: 2Fatal accidents caused by drunken drivers: 1Fatalities: 2Persons involved in fatal accidents: 3Pedestrians involved in fatal accidents: 1
Fatal accident statistics in 2013:
Fatal accident count: 1Vehicles involved in fatal accidents: 2Fatal accidents caused by drunken drivers: 0Fatalities: 1Persons involved in fatal accidents: 2Pedestrians involved in fatal accidents: 0
Home Mortgage Disclosure Act Aggregated Statistics For Year 2009(Based on 6 full and 4 partial tracts) A) FHA, FSA/RHS & VA B) Conventional C) Refinancings D) Home Improvement Loans F) Non-occupant Loans on G) Loans On Manufactured Number Average Value Number Average Value Number Average Value Number Average Value Number Average Value Number Average Value
LOANS ORIGINATED 131 $105,162 69 $97,399 499 $111,552 19 $63,017 18 $106,914 0 $0 APPLICATIONS APPROVED, NOT ACCEPTED 8 $107,274 8 $104,614 61 $124,478 9 $9,283 2 $82,655 0 $0 APPLICATIONS DENIED 41 $98,208 8 $50,486 250 $111,756 33 $12,225 11 $51,725 0 $0 APPLICATIONS WITHDRAWN 15 $106,617 7 $113,500 110 $106,788 3 $104,497 5 $144,968 1 $71,160 FILES CLOSED FOR INCOMPLETENESS 2 $77,735 0 $0 21 $131,480 0 $0 2 $209,590 0 $0
Aggregated Statistics For Year 2008(Based on 6 full and 4 partial tracts) A) FHA, FSA/RHS & VA B) Conventional C) Refinancings D) Home Improvement Loans E) Loans on Dwellings For 5+ Families F) Non-occupant Loans on Number Average Value Number Average Value Number Average Value Number Average Value Number Average Value Number Average Value
LOANS ORIGINATED 132 $114,199 129 $106,469 264 $110,610 37 $30,869 4 $820,160 29 $62,760 APPLICATIONS APPROVED, NOT ACCEPTED 13 $119,989 7 $35,756 40 $112,744 11 $14,756 0 $0 1 $86,600 APPLICATIONS DENIED 38 $96,097 15 $97,246 246 $119,311 41 $28,191 0 $0 19 $67,874 APPLICATIONS WITHDRAWN 21 $116,075 10 $91,582 128 $120,322 20 $50,802 1 $330,960 4 $113,050 FILES CLOSED FOR INCOMPLETENESS 3 $117,913 1 $18,550 29 $116,569 6 $54,500 0 $0 1 $76,620
Aggregated Statistics For Year 2007(Based on 6 full and 4 partial tracts) A) FHA, FSA/RHS & VA B) Conventional C) Refinancings D) Home Improvement Loans E) Loans on Dwellings For 5+ Families F) Non-occupant Loans on Number Average Value Number Average Value Number Average Value Number Average Value Number Average Value Number Average Value
LOANS ORIGINATED 95 $122,969 281 $96,073 316 $102,551 48 $28,961 4 $1,816,418 62 $56,233 APPLICATIONS APPROVED, NOT ACCEPTED 7 $102,257 28 $91,163 113 $119,012 17 $27,841 0 $0 6 $51,860 APPLICATIONS DENIED 29 $114,828 71 $92,028 467 $117,619 91 $37,725 0 $0 31 $49,581 APPLICATIONS WITHDRAWN 10 $121,818 47 $109,530 159 $116,159 10 $42,487 3 $297,473 15 $73,811 FILES CLOSED FOR INCOMPLETENESS 5 $62,950 14 $86,552 45 $131,240 2 $7,890 0 $0 3 $71,877
Aggregated Statistics For Year 2006(Based on 6 full and 4 partial tracts) A) FHA, FSA/RHS & VA B) Conventional C) Refinancings D) Home Improvement Loans E) Loans on Dwellings For 5+ Families F) Non-occupant Loans on Number Average Value Number Average Value Number Average Value Number Average Value Number Average Value Number Average Value
LOANS ORIGINATED 70 $116,055 419 $90,920 427 $101,916 82 $30,010 1 $4,786,700 64 $64,718 APPLICATIONS APPROVED, NOT ACCEPTED 4 $113,642 42 $97,871 121 $100,436 26 $35,522 0 $0 18 $72,508 APPLICATIONS DENIED 17 $109,235 132 $82,944 526 $112,318 94 $53,811 0 $0 38 $78,282 APPLICATIONS WITHDRAWN 7 $110,064 54 $88,667 256 $104,774 21 $59,473 0 $0 14 $76,113 FILES CLOSED FOR INCOMPLETENESS 4 $150,935 14 $61,655 105 $142,946 2 $78,920 0 $0 2 $64,950
Aggregated Statistics For Year 2005(Based on 6 full and 4 partial tracts) A) FHA, FSA/RHS & VA B) Conventional C) Refinancings D) Home Improvement Loans E) Loans on Dwellings For 5+ Families F) Non-occupant Loans on G) Loans On Manufactured Number Average Value Number Average Value Number Average Value Number Average Value Number Average Value Number Average Value Number Average Value
LOANS ORIGINATED 83 $124,014 520 $100,150 578 $106,816 78 $33,600 2 $819,580 70 $63,434 2 $19,730 APPLICATIONS APPROVED, NOT ACCEPTED 15 $141,359 91 $98,097 143 $101,383 29 $45,357 0 $0 9 $111,926 2 $9,530 APPLICATIONS DENIED 20 $107,814 134 $100,044 500 $118,345 94 $36,333 0 $0 30 $83,263 0 $0 APPLICATIONS WITHDRAWN 5 $92,232 99 $100,684 336 $126,479 47 $120,753 0 $0 27 $107,137 6 $95,163 FILES CLOSED FOR INCOMPLETENESS 0 $0 42 $103,345 72 $120,373 15 $53,441 0 $0 10 $106,205 0 $0
Aggregated Statistics For Year 2004(Based on 6 full and 4 partial tracts) A) FHA, FSA/RHS & VA B) Conventional C) Refinancings D) Home Improvement Loans E) Loans on Dwellings For 5+ Families F) Non-occupant Loans on G) Loans On Manufactured Number Average Value Number Average Value Number Average Value Number Average Value Number Average Value Number Average Value Number Average Value
LOANS ORIGINATED 128 $120,909 435 $100,297 771 $102,475 60 $25,429 2 $989,985 88 $63,740 0 $0 APPLICATIONS APPROVED, NOT ACCEPTED 9 $118,789 65 $100,039 200 $103,561 19 $43,424 0 $0 18 $71,606 0 $0 APPLICATIONS DENIED 21 $96,257 81 $103,302 563 $105,977 112 $35,047 0 $0 41 $67,148 4 $53,722 APPLICATIONS WITHDRAWN 13 $98,664 40 $83,844 307 $115,374 26 $53,098 0 $0 24 $84,008 0 $0 FILES CLOSED FOR INCOMPLETENESS 0 $0 13 $71,237 46 $136,922 8 $25,272 0 $0 6 $53,643 0 $0
Aggregated Statistics For Year 2003(Based on 6 full and 4 partial tracts) A) FHA, FSA/RHS & VA B) Conventional C) Refinancings D) Home Improvement Loans E) Loans on Dwellings For 5+ Families F) Non-occupant Loans on Number Average Value Number Average Value Number Average Value Number Average Value Number Average Value Number Average Value
LOANS ORIGINATED 146 $112,989 376 $105,416 1,668 $102,813 54 $17,401 4 $590,715 86 $70,029 APPLICATIONS APPROVED, NOT ACCEPTED 20 $102,365 56 $86,028 227 $104,910 14 $13,504 0 $0 6 $38,900 APPLICATIONS DENIED 23 $95,088 72 $100,444 517 $99,804 91 $35,652 0 $0 21 $60,670 APPLICATIONS WITHDRAWN 11 $107,825 34 $129,410 334 $105,739 20 $49,728 0 $0 9 $71,241 FILES CLOSED FOR INCOMPLETENESS 3 $114,787 10 $135,002 86 $101,287 2 $20,665 0 $0 2 $50,885
Aggregated Statistics For Year 2002(Based on 6 full and 4 partial tracts) A) FHA, FSA/RHS & VA B) Conventional C) Refinancings D) Home Improvement Loans F) Non-occupant Loans on Number Average Value Number Average Value Number Average Value Number Average Value Number Average Value
LOANS ORIGINATED 180 $111,846 395 $105,633 1,090 $100,942 72 $22,418 58 $71,717 APPLICATIONS APPROVED, NOT ACCEPTED 10 $94,437 59 $93,723 217 $101,959 41 $23,405 13 $85,568 APPLICATIONS DENIED 32 $109,282 69 $90,948 440 $95,870 92 $22,760 12 $55,266 APPLICATIONS WITHDRAWN 11 $100,105 24 $135,101 297 $105,772 13 $30,132 15 $79,247 FILES CLOSED FOR INCOMPLETENESS 5 $82,270 11 $77,572 75 $98,613 1 $19,850 8 $71,070
Aggregated Statistics For Year 2001(Based on 6 full and 4 partial tracts) A) FHA, FSA/RHS & VA B) Conventional C) Refinancings D) Home Improvement Loans E) Loans on Dwellings For 5+ Families F) Non-occupant Loans on Number Average Value Number Average Value Number Average Value Number Average Value Number Average Value Number Average Value
LOANS ORIGINATED 161 $104,526 313 $97,185 948 $98,217 98 $21,099 1 $449,280 64 $68,804 APPLICATIONS APPROVED, NOT ACCEPTED 7 $104,844 36 $87,775 205 $90,141 29 $21,806 0 $0 10 $61,757 APPLICATIONS DENIED 9 $96,874 96 $92,237 448 $92,050 117 $15,530 0 $0 30 $62,637 APPLICATIONS WITHDRAWN 6 $99,737 25 $106,227 319 $100,902 9 $13,019 0 $0 6 $58,250 FILES CLOSED FOR INCOMPLETENESS 3 $72,640 6 $109,683 62 $94,256 2 $118,080 0 $0 6 $78,937
Aggregated Statistics For Year 2000(Based on 6 full and 4 partial tracts) A) FHA, FSA/RHS & VA B) Conventional C) Refinancings D) Home Improvement Loans E) Loans on Dwellings For 5+ Families F) Non-occupant Loans on Number Average Value Number Average Value Number Average Value Number Average Value Number Average Value Number Average Value
LOANS ORIGINATED 121 $98,925 344 $94,681 329 $77,611 135 $14,672 1 $9,101,400 38 $64,747 APPLICATIONS APPROVED, NOT ACCEPTED 8 $100,898 47 $62,337 106 $85,172 43 $12,146 0 $0 11 $34,731 APPLICATIONS DENIED 11 $79,732 73 $74,902 300 $80,484 137 $15,821 2 $224,225 16 $60,866 APPLICATIONS WITHDRAWN 5 $93,970 34 $102,911 137 $77,918 14 $54,707 0 $0 9 $35,680 FILES CLOSED FOR INCOMPLETENESS 3 $108,727 10 $90,689 44 $90,155 1 $23,150 0 $0 0 $0
Aggregated Statistics For Year 1999(Based on 3 full and 2 partial tracts) A) FHA, FSA/RHS & VA B) Conventional C) Refinancings D) Home Improvement Loans F) Non-occupant Loans on Number Average Value Number Average Value Number Average Value Number Average Value Number Average Value
LOANS ORIGINATED 70 $98,081 183 $88,141 297 $84,672 62 $14,334 26 $57,438 APPLICATIONS APPROVED, NOT ACCEPTED 4 $76,692 18 $95,221 87 $76,194 36 $15,810 2 $31,770 APPLICATIONS DENIED 6 $92,762 24 $95,050 184 $78,542 46 $17,537 10 $78,857 APPLICATIONS WITHDRAWN 6 $88,420 15 $100,835 106 $77,808 2 $60,680 3 $43,080 FILES CLOSED FOR INCOMPLETENESS 1 $126,140 6 $107,400 28 $76,704 1 $34,220 4 $74,775
Private Mortgage Insurance Companies Aggregated Statistics For Year 2009(Based on 6 full and 4 partial tracts) A) Conventional B) Refinancings Number Average Value Number Average Value
LOANS ORIGINATED 19 $123,914 25 $138,602 APPLICATIONS APPROVED, NOT ACCEPTED 11 $116,890 12 $122,673 APPLICATIONS DENIED 8 $159,076 0 $0 APPLICATIONS WITHDRAWN 2 $81,670 4 $113,528 FILES CLOSED FOR INCOMPLETENESS 0 $0 0 $0
Aggregated Statistics For Year 2008(Based on 6 full and 4 partial tracts) A) Conventional B) Refinancings C) Non-occupant Loans on Number Average Value Number Average Value Number Average Value
LOANS ORIGINATED 67 $112,902 27 $108,795 6 $76,813 APPLICATIONS APPROVED, NOT ACCEPTED 18 $92,934 23 $151,339 2 $133,625 APPLICATIONS DENIED 12 $91,559 6 $94,665 4 $60,815 APPLICATIONS WITHDRAWN 7 $85,821 4 $154,005 0 $0 FILES CLOSED FOR INCOMPLETENESS 6 $57,875 1 $64,540 0 $0
Aggregated Statistics For Year 2007(Based on 6 full and 4 partial tracts) A) Conventional B) Refinancings C) Non-occupant Loans on Number Average Value Number Average Value Number Average Value
LOANS ORIGINATED 142 $104,265 47 $149,719 16 $61,009 APPLICATIONS APPROVED, NOT ACCEPTED 24 $91,918 14 $162,581 3 $20,213 APPLICATIONS DENIED 0 $0 4 $174,875 0 $0 APPLICATIONS WITHDRAWN 3 $138,363 2 $106,400 0 $0 FILES CLOSED FOR INCOMPLETENESS 0 $0 0 $0 0 $0
Aggregated Statistics For Year 2006(Based on 6 full and 4 partial tracts) A) Conventional B) Refinancings C) Non-occupant Loans on Number Average Value Number Average Value Number Average Value
LOANS ORIGINATED 100 $110,641 37 $119,726 11 $88,136 APPLICATIONS APPROVED, NOT ACCEPTED 8 $111,869 6 $123,092 1 $65,360 APPLICATIONS DENIED 0 $0 0 $0 0 $0 APPLICATIONS WITHDRAWN 5 $115,962 8 $103,119 4 $76,842 FILES CLOSED FOR INCOMPLETENESS 0 $0 2 $183,645 0 $0
Aggregated Statistics For Year 2005(Based on 6 full and 4 partial tracts) A) Conventional B) Refinancings C) Non-occupant Loans on Number Average Value Number Average Value Number Average Value
LOANS ORIGINATED 96 $120,530 54 $134,959 13 $83,494 APPLICATIONS APPROVED, NOT ACCEPTED 16 $104,425 14 $135,452 7 $80,171 APPLICATIONS DENIED 2 $137,230 0 $0 0 $0 APPLICATIONS WITHDRAWN 2 $286,085 2 $82,385 0 $0 FILES CLOSED FOR INCOMPLETENESS 0 $0 0 $0 0 $0
Aggregated Statistics For Year 2004(Based on 6 full and 4 partial tracts) A) Conventional B) Refinancings C) Non-occupant Loans on Number Average Value Number Average Value Number Average Value
LOANS ORIGINATED 100 $117,211 67 $120,495 20 $76,972 APPLICATIONS APPROVED, NOT ACCEPTED 16 $164,542 41 $121,191 4 $69,180 APPLICATIONS DENIED 4 $102,335 5 $129,478 6 $107,355 APPLICATIONS WITHDRAWN 4 $92,352 13 $108,870 1 $21,510 FILES CLOSED FOR INCOMPLETENESS 1 $60,400 2 $118,080 0 $0
Aggregated Statistics For Year 2003(Based on 6 full and 4 partial tracts) A) Conventional B) Refinancings C) Non-occupant Loans on Number Average Value Number Average Value Number Average Value
LOANS ORIGINATED 103 $133,081 211 $122,931 15 $78,091 APPLICATIONS APPROVED, NOT ACCEPTED 12 $112,294 61 $138,288 2 $46,750 APPLICATIONS DENIED 0 $0 6 $166,478 0 $0 APPLICATIONS WITHDRAWN 7 $166,299 22 $118,797 4 $102,538 FILES CLOSED FOR INCOMPLETENESS 0 $0 1 $73,150 0 $0
Aggregated Statistics For Year 2002(Based on 6 full and 4 partial tracts) A) Conventional B) Refinancings C) Non-occupant Loans on Number Average Value Number Average Value Number Average Value
LOANS ORIGINATED 138 $127,339 146 $122,474 12 $68,045 APPLICATIONS APPROVED, NOT ACCEPTED 16 $127,119 45 $135,990 3 $94,047 APPLICATIONS DENIED 5 $147,824 8 $114,605 2 $71,830 APPLICATIONS WITHDRAWN 11 $106,421 13 $123,286 3 $116,100 FILES CLOSED FOR INCOMPLETENESS 0 $0 5 $81,772 0 $0
Aggregated Statistics For Year 2001(Based on 6 full and 4 partial tracts) A) Conventional B) Refinancings C) Non-occupant Loans on Number Average Value Number Average Value Number Average Value
LOANS ORIGINATED 105 $116,635 111 $106,964 17 $61,038 APPLICATIONS APPROVED, NOT ACCEPTED 12 $113,388 33 $115,305 0 $0 APPLICATIONS DENIED 7 $129,713 6 $131,587 2 $37,165 APPLICATIONS WITHDRAWN 7 $162,303 0 $0 0 $0 FILES CLOSED FOR INCOMPLETENESS 0 $0 2 $71,925 0 $0
Aggregated Statistics For Year 2000(Based on 6 full and 4 partial tracts) A) Conventional B) Refinancings C) Non-occupant Loans on Number Average Value Number Average Value Number Average Value
LOANS ORIGINATED 122 $107,839 25 $95,738 3 $47,460 APPLICATIONS APPROVED, NOT ACCEPTED 16 $98,136 6 $111,045 0 $0 APPLICATIONS DENIED 4 $146,138 5 $105,134 1 $28,960 APPLICATIONS WITHDRAWN 0 $0 1 $50,590 0 $0 FILES CLOSED FOR INCOMPLETENESS 0 $0 0 $0 0 $0
Aggregated Statistics For Year 1999(Based on 3 full and 2 partial tracts) A) Conventional B) Refinancings C) Non-occupant Loans on Number Average Value Number Average Value Number Average Value
LOANS ORIGINATED 50 $94,814 38 $105,227 3 $55,230 APPLICATIONS APPROVED, NOT ACCEPTED 5 $69,058 8 $100,662 0 $0 APPLICATIONS DENIED 1 $98,080 5 $93,098 0 $0 APPLICATIONS WITHDRAWN 0 $0 0 $0 0 $0 FILES CLOSED FOR INCOMPLETENESS 0 $0 0 $0 0 $0
2002 - 2018 National Fire Incident Reporting System (NFIRS) incidents See full 2006 National Fire Incident Reporting System statistics for zip code 45415, Ohio
Most common first names in zip code 45415 among deceased individuals Name Count Lived (average)
Mary 159 82.6 years John 106 77.6 years Robert 96 71.1 years James 75 69.4 years William 72 76.9 years Helen 68 81.7 years Charles 66 78.6 years Ruth 48 80.4 years Richard 42 68.1 years Margaret 41 81.7 years
Most common last names in zip code 45415 among deceased individuals Last name Count Lived (average)
Smith 51 77.4 years Miller 35 82.7 years Brown 26 70.0 years Jones 25 77.6 years Johnson 21 74.7 years Thompson 16 73.3 years Davis 15 81.7 years Williams 15 80.5 years Martin 14 76.4 years Thomas 13 78.8 years
Businesses in zip code 45415
Name Count Name Count
Arby's 1 New Balance 1 CVS 1 SAS Shoes 1 Circle K 1 Steak 'n Shake 1 Comfort Inn 1 The Athlete's Foot 1 McDonald's 1 UPS 2 Meijer 1 Waffle House 1 Motel 6 1
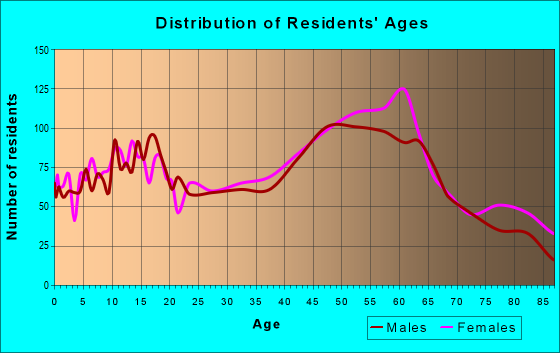
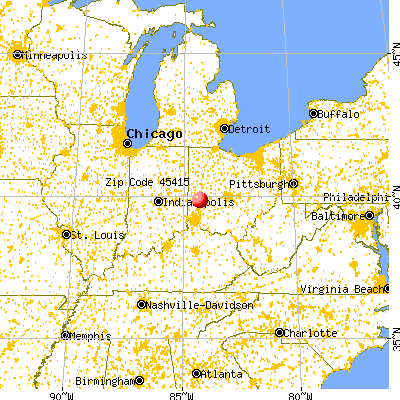

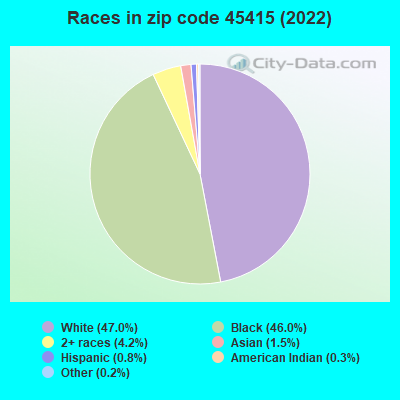


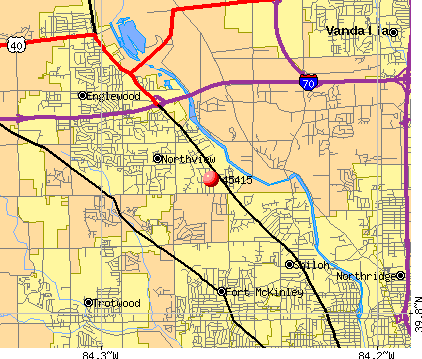 Nearest zip codes: 45416, 45414, 45406, 45405, 45377, 45426.
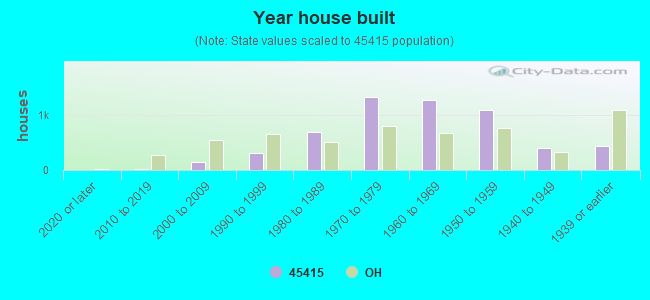
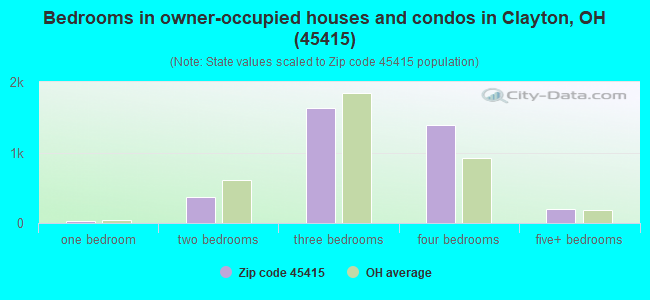
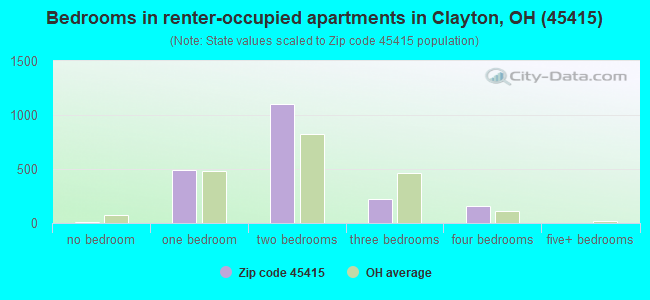
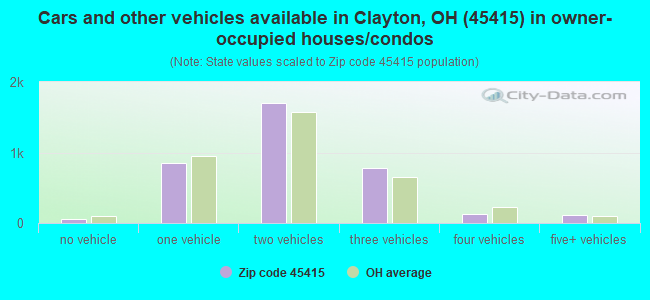
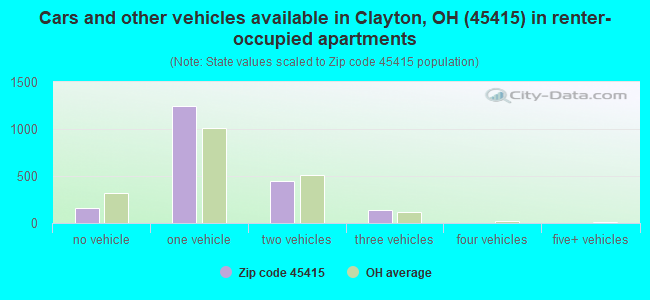


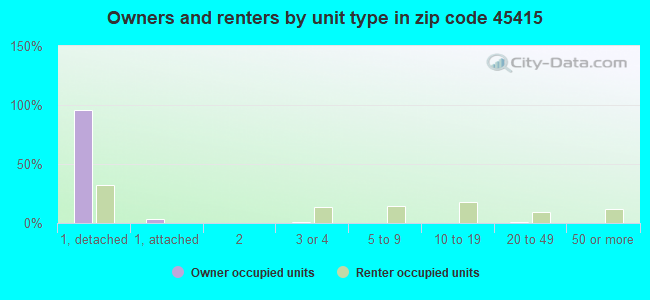
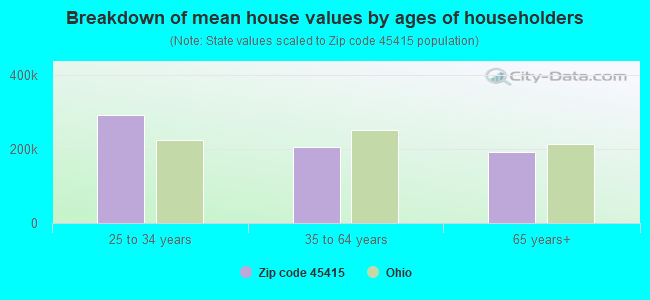


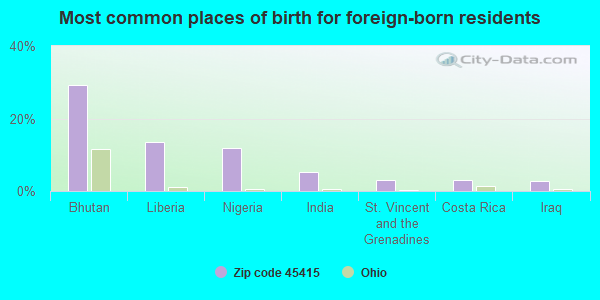
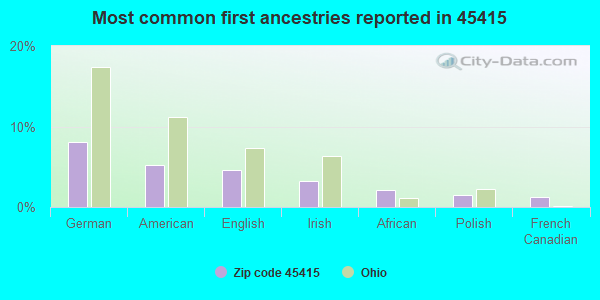
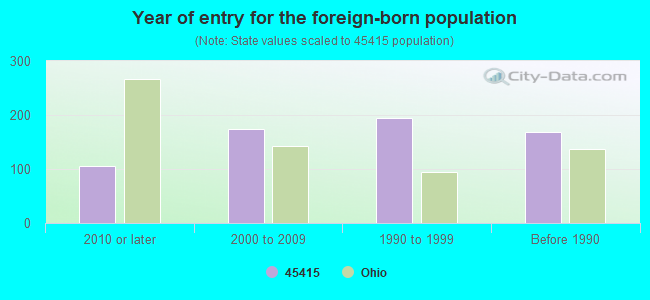


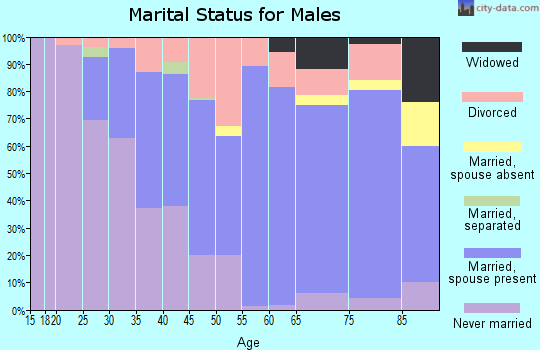
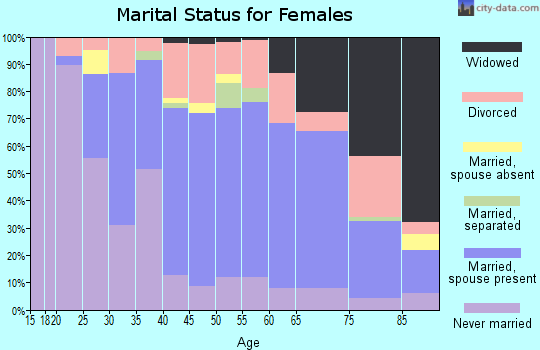
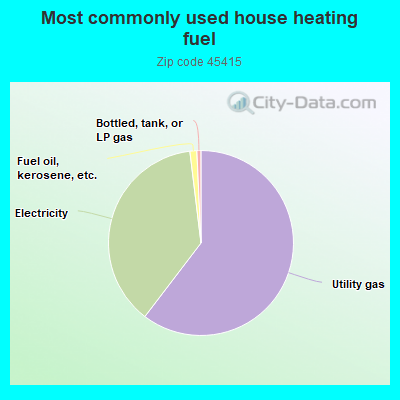
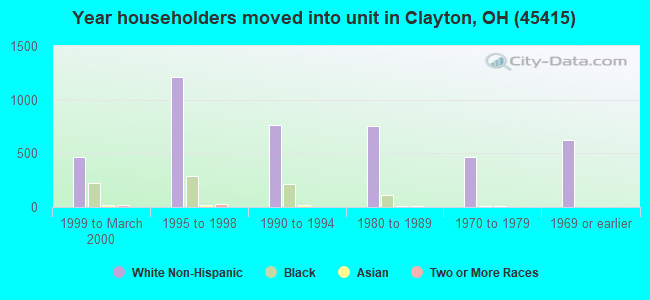
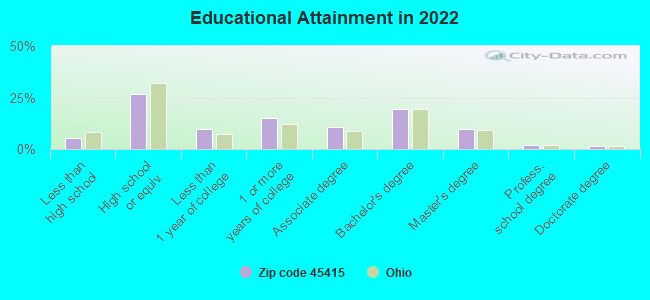
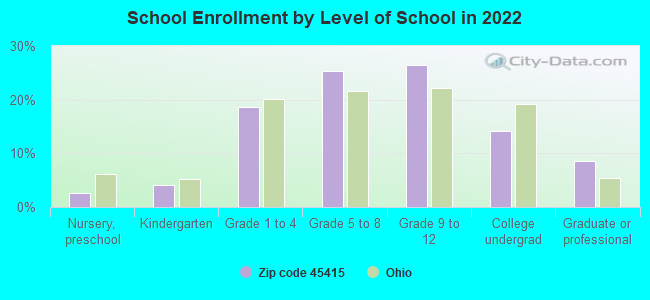
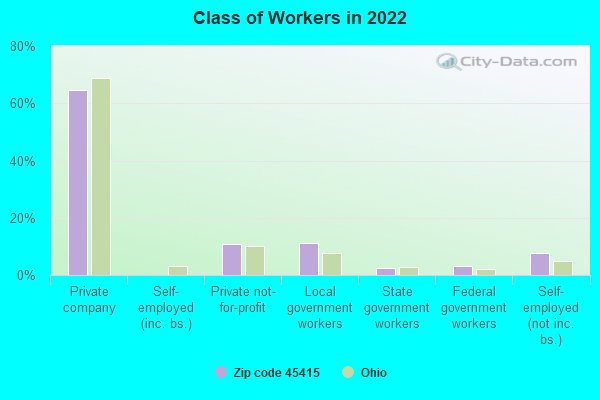
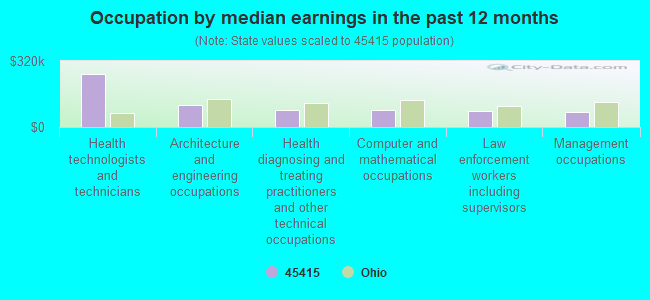
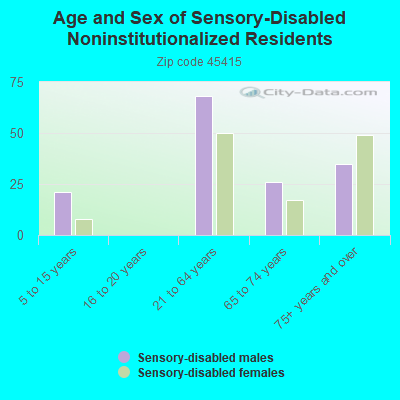
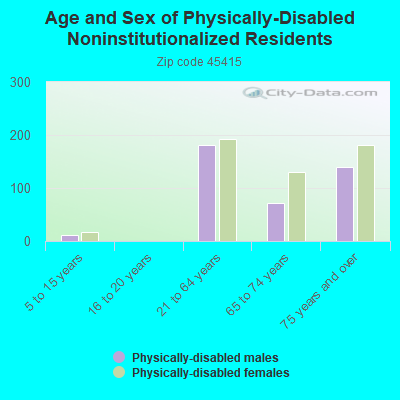
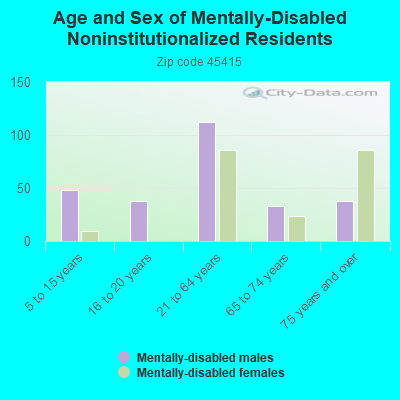
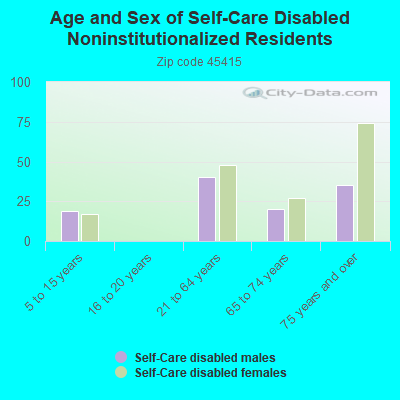
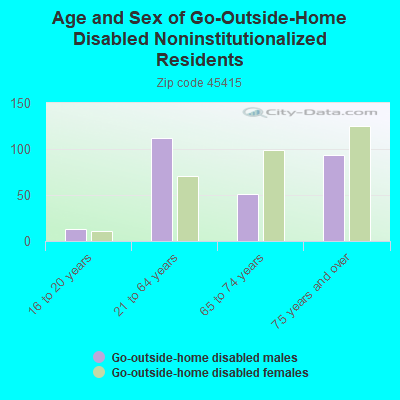
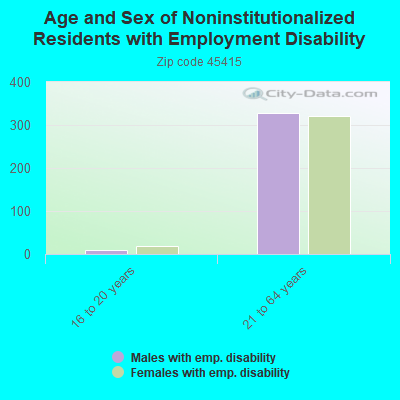
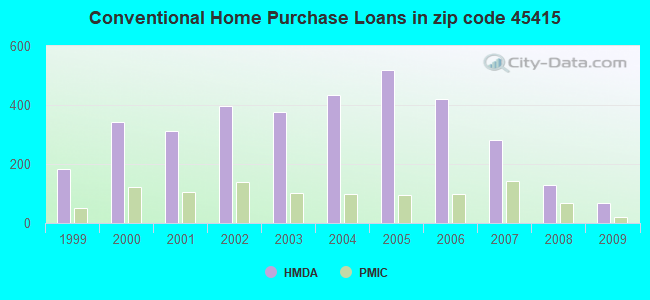
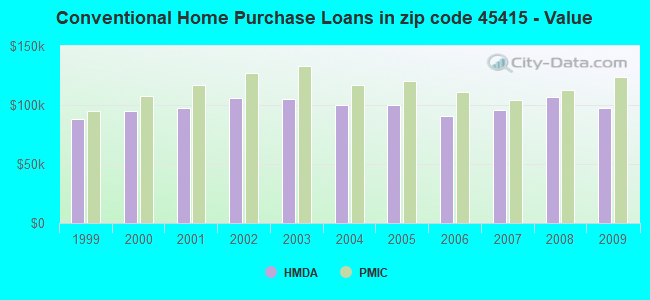
 According to the data from the years 2002 - 2018 the average number of fires per year is 40. The highest number of reported fire incidents - 60 took place in 2004, and the least - 23 in 2002. The data has a rising trend.
 When looking into fire subcategories, the most reports belonged to: Structure Fires (62.9%), and Outside Fires (20.6%).