Estimated zip code population in 2022: 19,922
Zip code population in 2010: 21,914
Zip code population in 2000: 27,679
Houses and condos: 10,885
Renter-occupied apartments: 4,598
% of renters here:
51%State:
33%
March 2022 cost of living index in zip code 45406: 93.4
(less than average, U.S. average is 100)
Land area: 5.0
sq. mi.
Water area: 0.0
sq. mi.
Population density: 3,983 people per square mile (average).
OSM Map
General Map
Google Map
MSN Map
OSM Map
General Map
Google Map
MSN Map
OSM Map
General Map
Google Map
MSN Map
OSM Map
General Map
Google Map
MSN Map
Please wait while loading the map...
Real estate property taxes paid for housing units in 2022:
This zip code:
1.7% ($1,394)Ohio:
1.3% ($2,639)
Median real estate property taxes paid for housing units with mortgages in 2022: $1,425 (1.5%)
Median real estate property taxes paid for housing units with no mortgage in 2022: $1,357 (2.0%)
Business Search - 14 Million verified businesses
Males: 9,289 Females: 10,631
For population 25 years and over in 45406:
High school or higher: 87.7%Bachelor's degree or higher: 21.8%Graduate or professional degree: 8.6%Unemployed: 9.5%Mean travel time to work (commute): 20.8 minutes
For population 15 years and over in 45406:
Never married: 46.6%Now married: 30.8%Separated: 3.4%Widowed: 5.6%Divorced: 13.6%
Zip code 45406 compared to state average:
Median household income below state average. Median house value significantly below state average. Unemployed percentage above state average. Black race population percentage significantly above state average. Foreign-born population percentage below state average. Renting percentage above state average. Length of stay since moving in significantly above state average. House age above state average. 14,759 74.1% Black 3,518 17.7% White 881 4.4% Two or more races 689 3.5% Hispanic or Latino 48 0.2% Asian 14 0.07% Some other race 8 0.04% American Indian
Data:
Median household income ($)
Median household income (% change since 2000)
Household income diversity
Ratio of average income to average house value (%)
Ratio of average income to average rent
Median household income ($) - White
Median household income ($) - Black or African American
Median household income ($) - Asian
Median household income ($) - Hispanic or Latino
Median household income ($) - American Indian and Alaska Native
Median household income ($) - Multirace
Median household income ($) - Other Race
Median household income for houses/condos with a mortgage ($)
Median household income for apartments without a mortgage ($)
Races - White alone (%)
Races - White alone (% change since 2000)
Races - Black alone (%)
Races - Black alone (% change since 2000)
Races - American Indian alone (%)
Races - American Indian alone (% change since 2000)
Races - Asian alone (%)
Races - Asian alone (% change since 2000)
Races - Hispanic (%)
Races - Hispanic (% change since 2000)
Races - Native Hawaiian and Other Pacific Islander alone (%)
Races - Native Hawaiian and Other Pacific Islander alone (% change since 2000)
Races - Two or more races (%)
Races - Two or more races (% change since 2000)
Races - Other race alone (%)
Races - Other race alone (% change since 2000)
Racial diversity
Unemployment (%)
Unemployment (% change since 2000)
Unemployment (%) - White
Unemployment (%) - Black or African American
Unemployment (%) - Asian
Unemployment (%) - Hispanic or Latino
Unemployment (%) - American Indian and Alaska Native
Unemployment (%) - Multirace
Unemployment (%) - Other Race
Population density (people per square mile)
Population - Males (%)
Population - Females (%)
Population - Males (%) - White
Population - Males (%) - Black or African American
Population - Males (%) - Asian
Population - Males (%) - Hispanic or Latino
Population - Males (%) - American Indian and Alaska Native
Population - Males (%) - Multirace
Population - Males (%) - Other Race
Population - Females (%) - White
Population - Females (%) - Black or African American
Population - Females (%) - Asian
Population - Females (%) - Hispanic or Latino
Population - Females (%) - American Indian and Alaska Native
Population - Females (%) - Multirace
Population - Females (%) - Other Race
Coronavirus confirmed cases (Apr 27, 2024)
Deaths caused by coronavirus (Apr 27, 2024)
Coronavirus confirmed cases (per 100k population) (Apr 27, 2024)
Deaths caused by coronavirus (per 100k population) (Apr 27, 2024)
Daily increase in number of cases (Apr 27, 2024)
Weekly increase in number of cases (Apr 27, 2024)
Cases doubled (in days) (Apr 27, 2024)
Hospitalized patients (Apr 18, 2022)
Negative test results (Apr 18, 2022)
Total test results (Apr 18, 2022)
COVID Vaccine doses distributed (per 100k population) (Sep 19, 2023)
COVID Vaccine doses administered (per 100k population) (Sep 19, 2023)
COVID Vaccine doses distributed (Sep 19, 2023)
COVID Vaccine doses administered (Sep 19, 2023)
Likely homosexual households (%)
Likely homosexual households (% change since 2000)
Likely homosexual households - Lesbian couples (%)
Likely homosexual households - Lesbian couples (% change since 2000)
Likely homosexual households - Gay men (%)
Likely homosexual households - Gay men (% change since 2000)
Cost of living index
Median gross rent ($)
Median contract rent ($)
Median monthly housing costs ($)
Median house or condo value ($)
Median house or condo value ($ change since 2000)
Mean house or condo value by units in structure - 1, detached ($)
Mean house or condo value by units in structure - 1, attached ($)
Mean house or condo value by units in structure - 2 ($)
Mean house or condo value by units in structure by units in structure - 3 or 4 ($)
Mean house or condo value by units in structure - 5 or more ($)
Mean house or condo value by units in structure - Boat, RV, van, etc. ($)
Mean house or condo value by units in structure - Mobile home ($)
Median house or condo value ($) - White
Median house or condo value ($) - Black or African American
Median house or condo value ($) - Asian
Median house or condo value ($) - Hispanic or Latino
Median house or condo value ($) - American Indian and Alaska Native
Median house or condo value ($) - Multirace
Median house or condo value ($) - Other Race
Median resident age
Resident age diversity
Median resident age - Males
Median resident age - Females
Median resident age - White
Median resident age - Black or African American
Median resident age - Asian
Median resident age - Hispanic or Latino
Median resident age - American Indian and Alaska Native
Median resident age - Multirace
Median resident age - Other Race
Median resident age - Males - White
Median resident age - Males - Black or African American
Median resident age - Males - Asian
Median resident age - Males - Hispanic or Latino
Median resident age - Males - American Indian and Alaska Native
Median resident age - Males - Multirace
Median resident age - Males - Other Race
Median resident age - Females - White
Median resident age - Females - Black or African American
Median resident age - Females - Asian
Median resident age - Females - Hispanic or Latino
Median resident age - Females - American Indian and Alaska Native
Median resident age - Females - Multirace
Median resident age - Females - Other Race
Commute - mean travel time to work (minutes)
Travel time to work - Less than 5 minutes (%)
Travel time to work - Less than 5 minutes (% change since 2000)
Travel time to work - 5 to 9 minutes (%)
Travel time to work - 5 to 9 minutes (% change since 2000)
Travel time to work - 10 to 19 minutes (%)
Travel time to work - 10 to 19 minutes (% change since 2000)
Travel time to work - 20 to 29 minutes (%)
Travel time to work - 20 to 29 minutes (% change since 2000)
Travel time to work - 30 to 39 minutes (%)
Travel time to work - 30 to 39 minutes (% change since 2000)
Travel time to work - 40 to 59 minutes (%)
Travel time to work - 40 to 59 minutes (% change since 2000)
Travel time to work - 60 to 89 minutes (%)
Travel time to work - 60 to 89 minutes (% change since 2000)
Travel time to work - 90 or more minutes (%)
Travel time to work - 90 or more minutes (% change since 2000)
Marital status - Never married (%)
Marital status - Now married (%)
Marital status - Separated (%)
Marital status - Widowed (%)
Marital status - Divorced (%)
Median family income ($)
Median family income (% change since 2000)
Median non-family income ($)
Median non-family income (% change since 2000)
Median per capita income ($)
Median per capita income (% change since 2000)
Median family income ($) - White
Median family income ($) - Black or African American
Median family income ($) - Asian
Median family income ($) - Hispanic or Latino
Median family income ($) - American Indian and Alaska Native
Median family income ($) - Multirace
Median family income ($) - Other Race
Median year house/condo built
Median year apartment built
Year house built - Built 2005 or later (%)
Year house built - Built 2000 to 2004 (%)
Year house built - Built 1990 to 1999 (%)
Year house built - Built 1980 to 1989 (%)
Year house built - Built 1970 to 1979 (%)
Year house built - Built 1960 to 1969 (%)
Year house built - Built 1950 to 1959 (%)
Year house built - Built 1940 to 1949 (%)
Year house built - Built 1939 or earlier (%)
Average household size
Household density (households per square mile)
Average household size - White
Average household size - Black or African American
Average household size - Asian
Average household size - Hispanic or Latino
Average household size - American Indian and Alaska Native
Average household size - Multirace
Average household size - Other Race
Occupied housing units (%)
Vacant housing units (%)
Owner occupied housing units (%)
Renter occupied housing units (%)
Vacancy status - For rent (%)
Vacancy status - For sale only (%)
Vacancy status - Rented or sold, not occupied (%)
Vacancy status - For seasonal, recreational, or occasional use (%)
Vacancy status - For migrant workers (%)
Vacancy status - Other vacant (%)
Residents with income below the poverty level (%)
Residents with income below 50% of the poverty level (%)
Children below poverty level (%)
Poor families by family type - Married-couple family (%)
Poor families by family type - Male, no wife present (%)
Poor families by family type - Female, no husband present (%)
Poverty status for native-born residents (%)
Poverty status for foreign-born residents (%)
Poverty among high school graduates not in families (%)
Poverty among people who did not graduate high school not in families (%)
Residents with income below the poverty level (%) - White
Residents with income below the poverty level (%) - Black or African American
Residents with income below the poverty level (%) - Asian
Residents with income below the poverty level (%) - Hispanic or Latino
Residents with income below the poverty level (%) - American Indian and Alaska Native
Residents with income below the poverty level (%) - Multirace
Residents with income below the poverty level (%) - Other Race
Air pollution - Air Quality Index (AQI)
Air pollution - CO
Air pollution - NO2
Air pollution - SO2
Air pollution - Ozone
Air pollution - PM10
Air pollution - PM25
Air pollution - Pb
Crime - Murders per 100,000 population
Crime - Rapes per 100,000 population
Crime - Robberies per 100,000 population
Crime - Assaults per 100,000 population
Crime - Burglaries per 100,000 population
Crime - Thefts per 100,000 population
Crime - Auto thefts per 100,000 population
Crime - Arson per 100,000 population
Crime - City-data.com crime index
Crime - Violent crime index
Crime - Property crime index
Crime - Murders per 100,000 population (5 year average)
Crime - Rapes per 100,000 population (5 year average)
Crime - Robberies per 100,000 population (5 year average)
Crime - Assaults per 100,000 population (5 year average)
Crime - Burglaries per 100,000 population (5 year average)
Crime - Thefts per 100,000 population (5 year average)
Crime - Auto thefts per 100,000 population (5 year average)
Crime - Arson per 100,000 population (5 year average)
Crime - City-data.com crime index (5 year average)
Crime - Violent crime index (5 year average)
Crime - Property crime index (5 year average)
1996 Presidential Elections Results (%) - Democratic Party (Clinton)
1996 Presidential Elections Results (%) - Republican Party (Dole)
1996 Presidential Elections Results (%) - Other
2000 Presidential Elections Results (%) - Democratic Party (Gore)
2000 Presidential Elections Results (%) - Republican Party (Bush)
2000 Presidential Elections Results (%) - Other
2004 Presidential Elections Results (%) - Democratic Party (Kerry)
2004 Presidential Elections Results (%) - Republican Party (Bush)
2004 Presidential Elections Results (%) - Other
2008 Presidential Elections Results (%) - Democratic Party (Obama)
2008 Presidential Elections Results (%) - Republican Party (McCain)
2008 Presidential Elections Results (%) - Other
2012 Presidential Elections Results (%) - Democratic Party (Obama)
2012 Presidential Elections Results (%) - Republican Party (Romney)
2012 Presidential Elections Results (%) - Other
2016 Presidential Elections Results (%) - Democratic Party (Clinton)
2016 Presidential Elections Results (%) - Republican Party (Trump)
2016 Presidential Elections Results (%) - Other
2020 Presidential Elections Results (%) - Democratic Party (Biden)
2020 Presidential Elections Results (%) - Republican Party (Trump)
2020 Presidential Elections Results (%) - Other
Ancestries Reported - Arab (%)
Ancestries Reported - Czech (%)
Ancestries Reported - Danish (%)
Ancestries Reported - Dutch (%)
Ancestries Reported - English (%)
Ancestries Reported - French (%)
Ancestries Reported - French Canadian (%)
Ancestries Reported - German (%)
Ancestries Reported - Greek (%)
Ancestries Reported - Hungarian (%)
Ancestries Reported - Irish (%)
Ancestries Reported - Italian (%)
Ancestries Reported - Lithuanian (%)
Ancestries Reported - Norwegian (%)
Ancestries Reported - Polish (%)
Ancestries Reported - Portuguese (%)
Ancestries Reported - Russian (%)
Ancestries Reported - Scotch-Irish (%)
Ancestries Reported - Scottish (%)
Ancestries Reported - Slovak (%)
Ancestries Reported - Subsaharan African (%)
Ancestries Reported - Swedish (%)
Ancestries Reported - Swiss (%)
Ancestries Reported - Ukrainian (%)
Ancestries Reported - United States (%)
Ancestries Reported - Welsh (%)
Ancestries Reported - West Indian (%)
Ancestries Reported - Other (%)
Educational Attainment - No schooling completed (%)
Educational Attainment - Less than high school (%)
Educational Attainment - High school or equivalent (%)
Educational Attainment - Less than 1 year of college (%)
Educational Attainment - 1 or more years of college (%)
Educational Attainment - Associate degree (%)
Educational Attainment - Bachelor's degree (%)
Educational Attainment - Master's degree (%)
Educational Attainment - Professional school degree (%)
Educational Attainment - Doctorate degree (%)
School Enrollment - Nursery, preschool (%)
School Enrollment - Kindergarten (%)
School Enrollment - Grade 1 to 4 (%)
School Enrollment - Grade 5 to 8 (%)
School Enrollment - Grade 9 to 12 (%)
School Enrollment - College undergrad (%)
School Enrollment - Graduate or professional (%)
School Enrollment - Not enrolled in school (%)
School enrollment - Public schools (%)
School enrollment - Private schools (%)
School enrollment - Not enrolled (%)
Median number of rooms in houses and condos
Median number of rooms in apartments
Housing units lacking complete plumbing facilities (%)
Housing units lacking complete kitchen facilities (%)
Density of houses
Urban houses (%)
Rural houses (%)
Households with people 60 years and over (%)
Households with people 65 years and over (%)
Households with people 75 years and over (%)
Households with one or more nonrelatives (%)
Households with no nonrelatives (%)
Population in households (%)
Family households (%)
Nonfamily households (%)
Population in families (%)
Family households with own children (%)
Median number of bedrooms in owner occupied houses
Mean number of bedrooms in owner occupied houses
Median number of bedrooms in renter occupied houses
Mean number of bedrooms in renter occupied houses
Median number of vehichles in owner occupied houses
Mean number of vehichles in owner occupied houses
Median number of vehichles in renter occupied houses
Mean number of vehichles in renter occupied houses
Mortgage status - with mortgage (%)
Mortgage status - with second mortgage (%)
Mortgage status - with home equity loan (%)
Mortgage status - with both second mortgage and home equity loan (%)
Mortgage status - without a mortgage (%)
Average family size
Average family size - White
Average family size - Black or African American
Average family size - Asian
Average family size - Hispanic or Latino
Average family size - American Indian and Alaska Native
Average family size - Multirace
Average family size - Other Race
Geographical mobility - Same house 1 year ago (%)
Geographical mobility - Moved within same county (%)
Geographical mobility - Moved from different county within same state (%)
Geographical mobility - Moved from different state (%)
Geographical mobility - Moved from abroad (%)
Place of birth - Born in state of residence (%)
Place of birth - Born in other state (%)
Place of birth - Native, outside of US (%)
Place of birth - Foreign born (%)
Housing units in structures - 1, detached (%)
Housing units in structures - 1, attached (%)
Housing units in structures - 2 (%)
Housing units in structures - 3 or 4 (%)
Housing units in structures - 5 to 9 (%)
Housing units in structures - 10 to 19 (%)
Housing units in structures - 20 to 49 (%)
Housing units in structures - 50 or more (%)
Housing units in structures - Mobile home (%)
Housing units in structures - Boat, RV, van, etc. (%)
House/condo owner moved in on average (years ago)
Renter moved in on average (years ago)
Year householder moved into unit - Moved in 1999 to March 2000 (%)
Year householder moved into unit - Moved in 1995 to 1998 (%)
Year householder moved into unit - Moved in 1990 to 1994 (%)
Year householder moved into unit - Moved in 1980 to 1989 (%)
Year householder moved into unit - Moved in 1970 to 1979 (%)
Year householder moved into unit - Moved in 1969 or earlier (%)
Means of transportation to work - Drove car alone (%)
Means of transportation to work - Carpooled (%)
Means of transportation to work - Public transportation (%)
Means of transportation to work - Bus or trolley bus (%)
Means of transportation to work - Streetcar or trolley car (%)
Means of transportation to work - Subway or elevated (%)
Means of transportation to work - Railroad (%)
Means of transportation to work - Ferryboat (%)
Means of transportation to work - Taxicab (%)
Means of transportation to work - Motorcycle (%)
Means of transportation to work - Bicycle (%)
Means of transportation to work - Walked (%)
Means of transportation to work - Other means (%)
Working at home (%)
Industry diversity
Most Common Industries - Agriculture, forestry, fishing and hunting, and mining (%)
Most Common Industries - Agriculture, forestry, fishing and hunting (%)
Most Common Industries - Mining, quarrying, and oil and gas extraction (%)
Most Common Industries - Construction (%)
Most Common Industries - Manufacturing (%)
Most Common Industries - Wholesale trade (%)
Most Common Industries - Retail trade (%)
Most Common Industries - Transportation and warehousing, and utilities (%)
Most Common Industries - Transportation and warehousing (%)
Most Common Industries - Utilities (%)
Most Common Industries - Information (%)
Most Common Industries - Finance and insurance, and real estate and rental and leasing (%)
Most Common Industries - Finance and insurance (%)
Most Common Industries - Real estate and rental and leasing (%)
Most Common Industries - Professional, scientific, and management, and administrative and waste management services (%)
Most Common Industries - Professional, scientific, and technical services (%)
Most Common Industries - Management of companies and enterprises (%)
Most Common Industries - Administrative and support and waste management services (%)
Most Common Industries - Educational services, and health care and social assistance (%)
Most Common Industries - Educational services (%)
Most Common Industries - Health care and social assistance (%)
Most Common Industries - Arts, entertainment, and recreation, and accommodation and food services (%)
Most Common Industries - Arts, entertainment, and recreation (%)
Most Common Industries - Accommodation and food services (%)
Most Common Industries - Other services, except public administration (%)
Most Common Industries - Public administration (%)
Occupation diversity
Most Common Occupations - Management, business, science, and arts occupations (%)
Most Common Occupations - Management, business, and financial occupations (%)
Most Common Occupations - Management occupations (%)
Most Common Occupations - Business and financial operations occupations (%)
Most Common Occupations - Computer, engineering, and science occupations (%)
Most Common Occupations - Computer and mathematical occupations (%)
Most Common Occupations - Architecture and engineering occupations (%)
Most Common Occupations - Life, physical, and social science occupations (%)
Most Common Occupations - Education, legal, community service, arts, and media occupations (%)
Most Common Occupations - Community and social service occupations (%)
Most Common Occupations - Legal occupations (%)
Most Common Occupations - Education, training, and library occupations (%)
Most Common Occupations - Arts, design, entertainment, sports, and media occupations (%)
Most Common Occupations - Healthcare practitioners and technical occupations (%)
Most Common Occupations - Health diagnosing and treating practitioners and other technical occupations (%)
Most Common Occupations - Health technologists and technicians (%)
Most Common Occupations - Service occupations (%)
Most Common Occupations - Healthcare support occupations (%)
Most Common Occupations - Protective service occupations (%)
Most Common Occupations - Fire fighting and prevention, and other protective service workers including supervisors (%)
Most Common Occupations - Law enforcement workers including supervisors (%)
Most Common Occupations - Food preparation and serving related occupations (%)
Most Common Occupations - Building and grounds cleaning and maintenance occupations (%)
Most Common Occupations - Personal care and service occupations (%)
Most Common Occupations - Sales and office occupations (%)
Most Common Occupations - Sales and related occupations (%)
Most Common Occupations - Office and administrative support occupations (%)
Most Common Occupations - Natural resources, construction, and maintenance occupations (%)
Most Common Occupations - Farming, fishing, and forestry occupations (%)
Most Common Occupations - Construction and extraction occupations (%)
Most Common Occupations - Installation, maintenance, and repair occupations (%)
Most Common Occupations - Production, transportation, and material moving occupations (%)
Most Common Occupations - Production occupations (%)
Most Common Occupations - Transportation occupations (%)
Most Common Occupations - Material moving occupations (%)
People in Group quarters - Institutionalized population (%)
People in Group quarters - Correctional institutions (%)
People in Group quarters - Federal prisons and detention centers (%)
People in Group quarters - Halfway houses (%)
People in Group quarters - Local jails and other confinement facilities (including police lockups) (%)
People in Group quarters - Military disciplinary barracks (%)
People in Group quarters - State prisons (%)
People in Group quarters - Other types of correctional institutions (%)
People in Group quarters - Nursing homes (%)
People in Group quarters - Hospitals/wards, hospices, and schools for the handicapped (%)
People in Group quarters - Hospitals/wards and hospices for chronically ill (%)
People in Group quarters - Hospices or homes for chronically ill (%)
People in Group quarters - Military hospitals or wards for chronically ill (%)
People in Group quarters - Other hospitals or wards for chronically ill (%)
People in Group quarters - Hospitals or wards for drug/alcohol abuse (%)
People in Group quarters - Mental (Psychiatric) hospitals or wards (%)
People in Group quarters - Schools, hospitals, or wards for the mentally retarded (%)
People in Group quarters - Schools, hospitals, or wards for the physically handicapped (%)
People in Group quarters - Institutions for the deaf (%)
People in Group quarters - Institutions for the blind (%)
People in Group quarters - Orthopedic wards and institutions for the physically handicapped (%)
People in Group quarters - Wards in general hospitals for patients who have no usual home elsewhere (%)
People in Group quarters - Wards in military hospitals for patients who have no usual home elsewhere (%)
People in Group quarters - Juvenile institutions (%)
People in Group quarters - Long-term care (%)
People in Group quarters - Homes for abused, dependent, and neglected children (%)
People in Group quarters - Residential treatment centers for emotionally disturbed children (%)
People in Group quarters - Training schools for juvenile delinquents (%)
People in Group quarters - Short-term care, detention or diagnostic centers for delinquent children (%)
People in Group quarters - Type of juvenile institution unknown (%)
People in Group quarters - Noninstitutionalized population (%)
People in Group quarters - College dormitories (includes college quarters off campus) (%)
People in Group quarters - Military quarters (%)
People in Group quarters - On base (%)
People in Group quarters - Barracks, unaccompanied personnel housing (UPH), (Enlisted/Officer), ;and similar group living quarters for military personnel (%)
People in Group quarters - Transient quarters for temporary residents (%)
People in Group quarters - Military ships (%)
People in Group quarters - Group homes (%)
People in Group quarters - Homes or halfway houses for drug/alcohol abuse (%)
People in Group quarters - Homes for the mentally ill (%)
People in Group quarters - Homes for the mentally retarded (%)
People in Group quarters - Homes for the physically handicapped (%)
People in Group quarters - Other group homes (%)
People in Group quarters - Religious group quarters (%)
People in Group quarters - Dormitories (%)
People in Group quarters - Agriculture workers' dormitories on farms (%)
People in Group quarters - Job Corps and vocational training facilities (%)
People in Group quarters - Other workers' dormitories (%)
People in Group quarters - Crews of maritime vessels (%)
People in Group quarters - Other nonhousehold living situations (%)
People in Group quarters - Other noninstitutional group quarters (%)
Residents speaking English at home (%)
Residents speaking English at home - Born in the United States (%)
Residents speaking English at home - Native, born elsewhere (%)
Residents speaking English at home - Foreign born (%)
Residents speaking Spanish at home (%)
Residents speaking Spanish at home - Born in the United States (%)
Residents speaking Spanish at home - Native, born elsewhere (%)
Residents speaking Spanish at home - Foreign born (%)
Residents speaking other language at home (%)
Residents speaking other language at home - Born in the United States (%)
Residents speaking other language at home - Native, born elsewhere (%)
Residents speaking other language at home - Foreign born (%)
Class of Workers - Employee of private company (%)
Class of Workers - Self-employed in own incorporated business (%)
Class of Workers - Private not-for-profit wage and salary workers (%)
Class of Workers - Local government workers (%)
Class of Workers - State government workers (%)
Class of Workers - Federal government workers (%)
Class of Workers - Self-employed workers in own not incorporated business and Unpaid family workers (%)
House heating fuel used in houses and condos - Utility gas (%)
House heating fuel used in houses and condos - Bottled, tank, or LP gas (%)
House heating fuel used in houses and condos - Electricity (%)
House heating fuel used in houses and condos - Fuel oil, kerosene, etc. (%)
House heating fuel used in houses and condos - Coal or coke (%)
House heating fuel used in houses and condos - Wood (%)
House heating fuel used in houses and condos - Solar energy (%)
House heating fuel used in houses and condos - Other fuel (%)
House heating fuel used in houses and condos - No fuel used (%)
House heating fuel used in apartments - Utility gas (%)
House heating fuel used in apartments - Bottled, tank, or LP gas (%)
House heating fuel used in apartments - Electricity (%)
House heating fuel used in apartments - Fuel oil, kerosene, etc. (%)
House heating fuel used in apartments - Coal or coke (%)
House heating fuel used in apartments - Wood (%)
House heating fuel used in apartments - Solar energy (%)
House heating fuel used in apartments - Other fuel (%)
House heating fuel used in apartments - No fuel used (%)
Armed forces status - In Armed Forces (%)
Armed forces status - Civilian (%)
Armed forces status - Civilian - Veteran (%)
Armed forces status - Civilian - Nonveteran (%)
Fatal accidents locations in years 2005-2021
Fatal accidents locations in 2005
Fatal accidents locations in 2006
Fatal accidents locations in 2007
Fatal accidents locations in 2008
Fatal accidents locations in 2009
Fatal accidents locations in 2010
Fatal accidents locations in 2011
Fatal accidents locations in 2012
Fatal accidents locations in 2013
Fatal accidents locations in 2014
Fatal accidents locations in 2015
Fatal accidents locations in 2016
Fatal accidents locations in 2017
Fatal accidents locations in 2018
Fatal accidents locations in 2019
Fatal accidents locations in 2020
Fatal accidents locations in 2021
Alcohol use - People drinking some alcohol every month (%)
Alcohol use - People not drinking at all (%)
Alcohol use - Average days/month drinking alcohol
Alcohol use - Average drinks/week
Alcohol use - Average days/year people drink much
Audiometry - Average condition of hearing (%)
Audiometry - People that can hear a whisper from across a quiet room (%)
Audiometry - People that can hear normal voice from across a quiet room (%)
Audiometry - Ears ringing, roaring, buzzing (%)
Audiometry - Had a job exposure to loud noise (%)
Audiometry - Had off-work exposure to loud noise (%)
Blood Pressure & Cholesterol - Has high blood pressure (%)
Blood Pressure & Cholesterol - Checking blood pressure at home (%)
Blood Pressure & Cholesterol - Frequently checking blood cholesterol (%)
Blood Pressure & Cholesterol - Has high cholesterol level (%)
Consumer Behavior - Money monthly spent on food at supermarket/grocery store
Consumer Behavior - Money monthly spent on food at other stores
Consumer Behavior - Money monthly spent on eating out
Consumer Behavior - Money monthly spent on carryout/delivered foods
Consumer Behavior - Income spent on food at supermarket/grocery store (%)
Consumer Behavior - Income spent on food at other stores (%)
Consumer Behavior - Income spent on eating out (%)
Consumer Behavior - Income spent on carryout/delivered foods (%)
Current Health Status - General health condition (%)
Current Health Status - Blood donors (%)
Current Health Status - Has blood ever tested for HIV virus (%)
Current Health Status - Left-handed people (%)
Dermatology - People using sunscreen (%)
Diabetes - Diabetics (%)
Diabetes - Had a blood test for high blood sugar (%)
Diabetes - People taking insulin (%)
Diet Behavior & Nutrition - Diet health (%)
Diet Behavior & Nutrition - Milk product consumption (# of products/month)
Diet Behavior & Nutrition - Meals not home prepared (#/week)
Diet Behavior & Nutrition - Meals from fast food or pizza place (#/week)
Diet Behavior & Nutrition - Ready-to-eat foods (#/month)
Diet Behavior & Nutrition - Frozen meals/pizza (#/month)
Drug Use - People that ever used marijuana or hashish (%)
Drug Use - Ever used hard drugs (%)
Drug Use - Ever used any form of cocaine (%)
Drug Use - Ever used heroin (%)
Drug Use - Ever used methamphetamine (%)
Health Insurance - People covered by health insurance (%)
Kidney Conditions-Urology - Avg. # of times urinating at night
Medical Conditions - People with asthma (%)
Medical Conditions - People with anemia (%)
Medical Conditions - People with psoriasis (%)
Medical Conditions - People with overweight (%)
Medical Conditions - Elderly people having difficulties in thinking or remembering (%)
Medical Conditions - People who ever received blood transfusion (%)
Medical Conditions - People having trouble seeing even with glass/contacts (%)
Medical Conditions - People with arthritis (%)
Medical Conditions - People with gout (%)
Medical Conditions - People with congestive heart failure (%)
Medical Conditions - People with coronary heart disease (%)
Medical Conditions - People with angina pectoris (%)
Medical Conditions - People who ever had heart attack (%)
Medical Conditions - People who ever had stroke (%)
Medical Conditions - People with emphysema (%)
Medical Conditions - People with thyroid problem (%)
Medical Conditions - People with chronic bronchitis (%)
Medical Conditions - People with any liver condition (%)
Medical Conditions - People who ever had cancer or malignancy (%)
Mental Health - People who have little interest in doing things (%)
Mental Health - People feeling down, depressed, or hopeless (%)
Mental Health - People who have trouble sleeping or sleeping too much (%)
Mental Health - People feeling tired or having little energy (%)
Mental Health - People with poor appetite or overeating (%)
Mental Health - People feeling bad about themself (%)
Mental Health - People who have trouble concentrating on things (%)
Mental Health - People moving or speaking slowly or too fast (%)
Mental Health - People having thoughts they would be better off dead (%)
Oral Health - Average years since last visit a dentist
Oral Health - People embarrassed because of mouth (%)
Oral Health - People with gum disease (%)
Oral Health - General health of teeth and gums (%)
Oral Health - Average days a week using dental floss/device
Oral Health - Average days a week using mouthwash for dental problem
Oral Health - Average number of teeth
Pesticide Use - Households using pesticides to control insects (%)
Pesticide Use - Households using pesticides to kill weeds (%)
Physical Activity - People doing vigorous-intensity work activities (%)
Physical Activity - People doing moderate-intensity work activities (%)
Physical Activity - People walking or bicycling (%)
Physical Activity - People doing vigorous-intensity recreational activities (%)
Physical Activity - People doing moderate-intensity recreational activities (%)
Physical Activity - Average hours a day doing sedentary activities
Physical Activity - Average hours a day watching TV or videos
Physical Activity - Average hours a day using computer
Physical Functioning - People having limitations keeping them from working (%)
Physical Functioning - People limited in amount of work they can do (%)
Physical Functioning - People that need special equipment to walk (%)
Physical Functioning - People experiencing confusion/memory problems (%)
Physical Functioning - People requiring special healthcare equipment (%)
Prescription Medications - Average number of prescription medicines taking
Preventive Aspirin Use - Adults 40+ taking low-dose aspirin (%)
Reproductive Health - Vaginal deliveries (%)
Reproductive Health - Cesarean deliveries (%)
Reproductive Health - Deliveries resulted in a live birth (%)
Reproductive Health - Pregnancies resulted in a delivery (%)
Reproductive Health - Women breastfeeding newborns (%)
Reproductive Health - Women that had a hysterectomy (%)
Reproductive Health - Women that had both ovaries removed (%)
Reproductive Health - Women that have ever taken birth control pills (%)
Reproductive Health - Women taking birth control pills (%)
Reproductive Health - Women that have ever used Depo-Provera or injectables (%)
Reproductive Health - Women that have ever used female hormones (%)
Sexual Behavior - People 18+ that ever had sex (vaginal, anal, or oral) (%)
Sexual Behavior - Males 18+ that ever had vaginal sex with a woman (%)
Sexual Behavior - Males 18+ that ever performed oral sex on a woman (%)
Sexual Behavior - Males 18+ that ever had anal sex with a woman (%)
Sexual Behavior - Males 18+ that ever had any sex with a man (%)
Sexual Behavior - Females 18+ that ever had vaginal sex with a man (%)
Sexual Behavior - Females 18+ that ever performed oral sex on a man (%)
Sexual Behavior - Females 18+ that ever had anal sex with a man (%)
Sexual Behavior - Females 18+ that ever had any kind of sex with a woman (%)
Sexual Behavior - Average age people first had sex
Sexual Behavior - Average number of female sex partners in lifetime (males 18+)
Sexual Behavior - Average number of female vaginal sex partners in lifetime (males 18+)
Sexual Behavior - Average age people first performed oral sex on a woman (18+)
Sexual Behavior - Average number of woman performed oral sex on in lifetime (18+)
Sexual Behavior - Average number of male sex partners in lifetime (males 18+)
Sexual Behavior - Average number of male anal sex partners in lifetime (males 18+)
Sexual Behavior - Average age people first performed oral sex on a man (18+)
Sexual Behavior - Average number of male oral sex partners in lifetime (18+)
Sexual Behavior - People using protection when performing oral sex (%)
Sexual Behavior - Average number of times people have vaginal or anal sex a year
Sexual Behavior - People having sex without condom (%)
Sexual Behavior - Average number of male sex partners in lifetime (females 18+)
Sexual Behavior - Average number of male vaginal sex partners in lifetime (females 18+)
Sexual Behavior - Average number of female sex partners in lifetime (females 18+)
Sexual Behavior - Circumcised males 18+ (%)
Sleep Disorders - Average hours sleeping at night
Sleep Disorders - People that has trouble sleeping (%)
Smoking-Cigarette Use - People smoking cigarettes (%)
Taste & Smell - People 40+ having problems with smell (%)
Taste & Smell - People 40+ having problems with taste (%)
Taste & Smell - People 40+ that ever had wisdom teeth removed (%)
Taste & Smell - People 40+ that ever had tonsils teeth removed (%)
Taste & Smell - People 40+ that ever had a loss of consciousness because of a head injury (%)
Taste & Smell - People 40+ that ever had a broken nose or other serious injury to face or skull (%)
Taste & Smell - People 40+ that ever had two or more sinus infections (%)
Weight - Average height (inches)
Weight - Average weight (pounds)
Weight - Average BMI
Weight - People that are obese (%)
Weight - People that ever were obese (%)
Weight - People trying to lose weight (%)
100%
urban population.
Estimated median house/condo value in 2022: $83,733
45406:
$83,733Ohio:
$204,100
Median resident age: This zip code:
38.8 yearsOhio median age:
39.9 years
Average household size: This zip code:
2.2 peopleOhio:
2.4 people
Averages for the 2020 tax year for zip code 45406, filed in 2021:
Average Adjusted Gross Income (AGI) in 2020: $33,008 (Individual Income Tax Returns) Here:
$33,008State:
$67,288
Salary/wage: $28,941 (reported on 84.1% of returns )Here:
$28,941State:
$55,628
(% of AGI for various income ranges: 1097.8% for AGIs below $25k , 3401.1% for AGIs $25k-50k , 6418.5% for AGIs $50k-75k , 9700.0% for AGIs $75k-100k , 16399.4% for AGIs $100k-200k ) Taxable interest for individuals: $354 (reported on 14.5% of returns )This zip code:
$354Ohio:
$1,518
(% of AGI for various income ranges: 2.7% for AGIs below $25k , 4.2% for AGIs $25k-50k , 13.4% for AGIs $50k-75k , 21.7% for AGIs $75k-100k , 87.5% for AGIs $100k-200k ) Ordinary dividends: $1,553 (reported on 3.9% of returns )(% of AGI for various income ranges: 0.6% for AGIs below $25k , 2.7% for AGIs $25k-50k , 19.3% for AGIs $50k-75k , 41.7% for AGIs $75k-100k , 164.4% for AGIs $100k-200k ) Net capital gain/loss in AGI: +$4,006 (reported on 3.4% of returns )Here:
+$4,006State:
+$18,919
(% of AGI for various income ranges: 1.1% for AGIs below $25k , 2.5% for AGIs $25k-50k , 23.1% for AGIs $50k-75k , 73.3% for AGIs $75k-100k , 548.1% for AGIs $100k-200k ) Profit/loss from business: +$4,028 (reported on 12.5% of returns )Here:
+$4,028State:
+$13,744
(% of AGI for various income ranges: 57.3% for AGIs below $25k , 21.1% for AGIs $25k-50k , 135.1% for AGIs $50k-75k , 188.3% for AGIs $75k-100k , 412.5% for AGIs $100k-200k ) Taxable individual retirement arrangement distribution: $12,764 (reported on 3.7% of returns )45406:
$12,764Ohio:
$18,876
(% of AGI for various income ranges: 12.8% for AGIs below $25k , 33.6% for AGIs $25k-50k , 166.6% for AGIs $50k-75k , 275.8% for AGIs $75k-100k , 871.9% for AGIs $100k-200k ) Total itemized deductions: $23,671 (reported on 2.2% of returns )Here:
$23,671State:
$33,869
(% of AGI for various income ranges: 56.2% for AGIs $25k-50k , 197.9% for AGIs $50k-75k , 440.0% for AGIs $75k-100k , 676.9% for AGIs $100k-200k ) Charity contributions: $8,505 (reported on 1.9% of returns )(% of AGI for various income ranges: 15.3% for AGIs $25k-50k , 64.5% for AGIs $50k-75k , 129.2% for AGIs $75k-100k , 289.4% for AGIs $100k-200k ) Taxes paid: $4,552 (reported on 2.2% of returns )(% of AGI for various income ranges: 6.7% for AGIs $25k-50k , 33.4% for AGIs $50k-75k , 87.9% for AGIs $75k-100k , 213.8% for AGIs $100k-200k ) Earned income credit: $2,676 (reported on 34.1% of returns )(% of AGI for various income ranges: 156.2% for AGIs below $25k , 95.2% for AGIs $25k-50k ) Percentage of individuals using paid preparers for their 2020 taxes: 93.6%(% for various income ranges: 94.3% for AGIs below $25k , 93.9% for AGIs $25k-50k , 92.1% for AGIs $50k-75k , 89.7% for AGIs $75k-100k , 90.3% for AGIs $100k-200k , 100.0% for AGIs over 200k )
Averages for the 2012 tax year for zip code 45406, filed in 2013:
Average Adjusted Gross Income (AGI) in 2012: $29,497 (Individual Income Tax Returns) Here:
$29,497State:
$54,926
Salary/wage: $25,952 (reported on 82.6% of returns )Here:
$25,952State:
$45,869
(% of AGI for various income ranges: 75.2% for AGIs below $25k , 75.5% for AGIs $25k-50k , 69.5% for AGIs $50k-75k , 68.7% for AGIs $75k-100k , 69.5% for AGIs $100k-200k ) Taxable interest for individuals: $428 (reported on 15.3% of returns )This zip code:
$428Ohio:
$1,297
(% of AGI for various income ranges: 0.2% for AGIs below $25k , 0.2% for AGIs $25k-50k , 0.2% for AGIs $50k-75k , 0.2% for AGIs $75k-100k , 0.4% for AGIs $100k-200k ) Ordinary dividends: $1,985 (reported on 5.9% of returns )(% of AGI for various income ranges: 0.2% for AGIs below $25k , 0.4% for AGIs $25k-50k , 0.3% for AGIs $50k-75k , 0.4% for AGIs $75k-100k , 0.9% for AGIs $100k-200k ) Net capital gain/loss in AGI: +$1,776 (reported on 3.6% of returns )Here:
+$1,776State:
+$11,232
(% of AGI for various income ranges: 0.1% for AGIs $25k-50k , 0.1% for AGIs $75k-100k , 1.3% for AGIs $100k-200k ) Profit/loss from business: +$5,911 (reported on 13.1% of returns )Here:
+$5,911State:
+$12,773
(% of AGI for various income ranges: 8.5% for AGIs below $25k , 0.9% for AGIs $25k-50k , 0.3% for AGIs $50k-75k , 0.6% for AGIs $75k-100k , 0.4% for AGIs $100k-200k ) Taxable individual retirement arrangement distribution: $9,469 (reported on 5.2% of returns )(% of AGI for various income ranges: 1.0% for AGIs below $25k , 1.4% for AGIs $25k-50k , 1.6% for AGIs $50k-75k , 2.9% for AGIs $75k-100k , 2.3% for AGIs $100k-200k ) Total itemized deductions: $15,408 (25% of AGI, reported on 17.5% of returns )Here:
$15,408State:
$21,278
Here:
24.8% of AGIState:
18.8% of AGI
(% of AGI for various income ranges: 3.6% for AGIs below $25k , 8.4% for AGIs $25k-50k , 12.1% for AGIs $50k-75k , 11.9% for AGIs $75k-100k , 14.6% for AGIs $100k-200k ) Charity contributions: $4,457 (reported on 14.7% of returns )(% of AGI for various income ranges: 0.6% for AGIs below $25k , 1.8% for AGIs $25k-50k , 3.3% for AGIs $50k-75k , 3.2% for AGIs $75k-100k , 4.0% for AGIs $100k-200k ) Taxes paid: $4,874 (reported on 17.2% of returns )(% of AGI for various income ranges: 0.6% for AGIs below $25k , 2.2% for AGIs $25k-50k , 3.9% for AGIs $50k-75k , 4.2% for AGIs $75k-100k , 5.7% for AGIs $100k-200k ) Earned income credit: $2,728 (reported on 38.5% of returns )(% of AGI for various income ranges: 12.3% for AGIs below $25k , 1.4% for AGIs $25k-50k ) Percentage of individuals using paid preparers for their 2012 taxes: 38.4%(% for various income ranges: 35.1% for AGIs below $25k , 40.2% for AGIs $25k-50k , 45.7% for AGIs $50k-75k , 48.6% for AGIs $75k-100k , 51.7% for AGIs $100k-200k )
Averages for the 2004 tax year for zip code 45406, filed in 2005:
Average Adjusted Gross Income (AGI) in 2004: $29,966 (Individual Income Tax Returns) Here:
$29,966State:
$44,480
Salary/wage: $26,437 (reported on 89.4% of returns )Here:
$26,437State:
$39,198
(% of AGI for various income ranges: 87.6% for AGIs below $10k , 80.9% for AGIs $10k-25k , 82.4% for AGIs $25k-50k , 84.0% for AGIs $50k-75k , 82.5% for AGIs $75k-100k , 55.4% for AGIs over 100k ) Taxable interest for individuals: $683 (reported on 20.4% of returns )This zip code:
$683Ohio:
$1,532
(% of AGI for various income ranges: 1.0% for AGIs below $10k , 0.6% for AGIs $10k-25k , 0.4% for AGIs $25k-50k , 0.4% for AGIs $50k-75k , 0.3% for AGIs $75k-100k , 0.5% for AGIs over 100k ) Taxable dividends: $1,215 (reported on 8.4% of returns )(% of AGI for various income ranges: 0.6% for AGIs below $10k , 0.3% for AGIs $10k-25k , 0.2% for AGIs $25k-50k , 0.3% for AGIs $50k-75k , 0.6% for AGIs $75k-100k , 0.5% for AGIs over 100k ) Net capital gain/loss: +$1,520 (reported on 4.8% of returns )Here:
+$1,520State:
+$8,582
(% of AGI for various income ranges: -0.2% for AGIs below $10k , 0.0% for AGIs $10k-25k , 0.2% for AGIs $25k-50k , 0.2% for AGIs $50k-75k , 0.3% for AGIs $75k-100k , 0.8% for AGIs over 100k ) Profit/loss from business: +$3,713 (reported on 8.7% of returns )Here:
+$3,713State:
+$10,813
(% of AGI for various income ranges: 5.2% for AGIs below $10k , 2.3% for AGIs $10k-25k , 0.4% for AGIs $25k-50k , 0.7% for AGIs $50k-75k , 0.3% for AGIs $75k-100k , 1.0% for AGIs over 100k ) IRA payment deduction: $2,052 (reported on 1.1% of returns )(% of AGI for various income ranges: 0.1% for AGIs $10k-25k , 0.1% for AGIs $25k-50k , 0.1% for AGIs $50k-75k , 0.1% for AGIs $75k-100k ) Total itemized deductions: $14,299 (25% of AGI, reported on 26.6% of returns )Here:
$14,299State:
$17,503
Here:
24.6% of AGIState:
20.8% of AGI
(% of AGI for various income ranges: 3.3% for AGIs below $10k , 6.4% for AGIs $10k-25k , 13.3% for AGIs $25k-50k , 16.1% for AGIs $50k-75k , 17.0% for AGIs $75k-100k , 14.1% for AGIs over 100k ) Charity contributions deductions: $3,359 (6% of AGI, reported on 23.2% of returns )Here:
5.6% of AGIState:
3.4% of AGI
(% of AGI for various income ranges: 0.6% for AGIs below $10k , 1.1% for AGIs $10k-25k , 2.5% for AGIs $25k-50k , 3.7% for AGIs $50k-75k , 4.0% for AGIs $75k-100k , 3.0% for AGIs over 100k ) Total tax: $3,498 (reported on 63.2% of returns )(% of AGI for various income ranges: 1.5% for AGIs below $10k , 3.1% for AGIs $10k-25k , 6.6% for AGIs $25k-50k , 9.3% for AGIs $50k-75k , 10.8% for AGIs $75k-100k , 11.3% for AGIs over 100k ) Earned income credit: $1,999 (reported on 33.2% of returns )Percentage of individuals using paid preparers for their 2004 taxes: 55.7%(% for various income ranges: 51.3% for AGIs below $10k , 58.7% for AGIs $10k-25k , 55.4% for AGIs $25k-50k , 56.9% for AGIs $50k-75k , 55.2% for AGIs $75k-100k , 55.1% for AGIs over 100k )
Estimated median household income in 2022: This zip code:
$36,917Ohio:
$65,720
Nearest zip codes: 45405 ,
45416 ,
45402 ,
45428 ,
45415 ,
45417 .
Trotwood Zip Code Map
Percentage of family households: This zip code:
38.2%Ohio:
43.3%
Percentage of households with unmarried partners: This zip code:
5.8%Ohio:
44.6%
Likely homosexual households (counted as self-reported same-sex unmarried-partner households)
Lesbian couples: 0.0% of all households Gay men: 0.3% of all households
Household received Food Stamps/SNAP in the past 12 months: 2,450Household did not receive Food Stamps/SNAP in the past 12 months: 6,616
Women who had a birth in the past 12 months: 214 (98 now married , 113 unmarried) Women who did not have a birth in the past 12 months: 4,450 (1,210 now married , 3,242 unmarried)
Housing units in zip code 45406 with a mortgage: 2,211 (116
second mortgage , 47
both second mortgage and home equity loan )
Houses without a mortgage: 151
Median monthly owner costs for units with a mortgage: $998
Median monthly owner costs for units without a mortgage: $453
Residents with income below the poverty level in 2022:
This zip code:
25.3%Whole state:
13.4%
Residents with income below 50% of the poverty level in 2022:
This zip code:
10.0%Whole state:
7.0%
Median number of rooms in houses and condos: Median number of rooms in apartments: Notable locations in this zip code not listed on our city pages
Click to draw/clear zip code borders Notable locations in zip code 45406: (A) , Dayton View Branch Library (B) , Dayton Fire Department Company 16 (C) . Display/hide their locations on the map
Shopping Centers: (1) , Miracle Lane Shopping Center (2) . Display/hide their locations on the map
Churches in zip code 45406 include: (A) , True Vine Holiness Church of God (B) , Saint Timothy Missionary Baptist Church (C) , Saint Matthew Missionary Baptist Church (D) , Metropolitan Missionary Baptist Church (E) , Love Chapel Church of God in Christ (F) , Congregation for Reconciliation (G) , College Hill United Presbyterian Church (H) , Hillcrest Christian Church (I) . Display/hide their locations on the map
Cemetery: (1) . Display/hide its location on the map
Parks in zip code 45406 include: (1) , College Hill Park (2) , Salem Heights Playground (3) , Princeton Park (4) , Fairview Park (5) , Hickorydale Park (6) , Wesleyan Park (7) . Display/hide their locations on the map
Year house built (houses)
13 2020 or later113 2010 to 2019185 2000 to 2009117 1990 to 1999514 1980 to 1989824 1970 to 19791,519 1960 to 19692,786 1950 to 19591,830 1940 to 19492,748 1939 or earlier
Zip code 45406 household income distribution in 2022 1,075 Less than $10,000854 $10,000 to $14,999585 $15,000 to $19,999493 $20,000 to $24,999523 $25,000 to $29,999699 $30,000 to $34,999681 $35,000 to $39,999422 $40,000 to $44,999228 $45,000 to $49,999593 $50,000 to $59,999804 $60,000 to $74,999866 $75,000 to $99,999427 $100,000 to $124,999247 $125,000 to $149,999344 $150,000 to $199,999254 $200,000 or moreEstimate of home value of owner-occupied houses/condos in 2022 in zip code 45406 66 Less than $10,00033 $10,000 to $14,99939 $20,000 to $24,99927 $25,000 to $29,999182 $30,000 to $34,999128 $35,000 to $39,999331 $40,000 to $49,999466 $50,000 to $59,999476 $60,000 to $69,999374 $70,000 to $79,999521 $80,000 to $89,999104 $90,000 to $99,999398 $100,000 to $124,999189 $125,000 to $149,999248 $150,000 to $174,999157 $175,000 to $199,99985 $200,000 to $249,99916 $250,000 to $299,99945 $300,000 to $399,9997 $400,000 to $499,99925 $500,000 to $749,999Rent paid by renters in 2022 in zip code 45406 129 Less than $10047 $100 to $14962 $150 to $19985 $200 to $24957 $250 to $29934 $300 to $34948 $350 to $399235 $400 to $449295 $450 to $499528 $500 to $549277 $550 to $599515 $600 to $649525 $650 to $699358 $700 to $749248 $750 to $799305 $800 to $899279 $900 to $999251 $1,000 to $1,24932 $1,250 to $1,49952 $1,500 to $1,999205 No cash rent
Median gross rent in 2022: $851.
Median price asked for vacant for-sale houses and condos in 2022: $100,004.
Estimated median house (or condo) value in 2022 for: White Non-Hispanic householders: $89,180Black or African American householders: $82,086Asian householders: $174,180Some other race householders: $174,180Two or more races householders: $115,782Hispanic or Latino householders: $70,432Estimated median house or condo value in 2022: $83,733
45406:
$83,733Ohio:
$204,100
Lower value quartile - upper value quartile: $57,895 - $123,342
Mean price in 2022: Detached houses: $106,200Here:
$106,200State:
$254,366
Townhouses or other attached units: $82,063Here:
$82,063State:
$225,733
In 2-unit structures: $296,788Here:
$296,788State:
$144,384
In 3-to-4-unit structures: $95,239Here:
$95,239State:
$203,002
In 5-or-more-unit structures: $128,014Here:
$128,014State:
$211,593
Mobile homes: $16,824Here:
$16,824State:
$62,719
Housing units in structures:
One, detached: 7,587One, attached: 404Two: 2003 or 4: 7635 to 9: 60510 to 19: 33820 to 49: 36650 or more: 623Unemployment : 9.5%
Means of transportation to work in zip code 45406 61.0% 5,165 Drove a car alone13.9% 1,177 Carpooled7.7% 656 Bus or trolley bus0.7% 58 Taxi3.6% 309 Walked1.1% 91 Other means10.9% 923 Worked at homeTravel time to work (commute) in zip code 45406 170 Less than 5 minutes702 5 to 9 minutes1,764 10 to 14 minutes1,593 15 to 19 minutes1,238 20 to 24 minutes601 25 to 29 minutes578 30 to 34 minutes27 35 to 39 minutes48 40 to 44 minutes265 45 to 59 minutes419 60 to 89 minutes85 90 or more minutes
Neighborhoods in zip code 45406: Percentage of zip code residents living and working in this county: 87.0%
Household type by relationship:
Households: 19,922
Male householders: 3,091 (1,764 living alone ), Female householders: 5,958 (2,030 living alone )2,085 spouses (2,072 opposite-sex spouses ), 596 unmarried partners , (489 opposite-sex unmarried partners ), 5,582 children (5,188 natural , 110 adopted , 281 stepchildren ), 865 grandchildren , 323 brothers or sisters , 199 parents , 153 foster children , 386 other relatives , 420 non-relatives In group quarters: 257 (-1 institutionalized population )
Size of family households: 2,308 2-persons , 1,214 3-persons , 616 4-persons , 395 5-persons , 79 6-persons , 105 7-or-more-persons
Size of nonfamily households: 3,793 1-person , 462 2-persons , 26 3-persons , 11 4-persons , 42 6-persons
1,286 married couples with children. single-parent households (383 men , 2,195 women ).
96.3% of residents of 45406 zip code speak English at home. of residents speak Spanish at home (78% very well, 12% well, 10% not at all ).of residents speak other Indo-European language at home (66% very well, 34% well ).of residents speak Asian or Pacific Island language at home (100% not well ).of residents speak other language at home (100% very well ).
Foreign born population: 492 (2.5%)
(61.9%
of them are naturalized citizens )
This zip code:
2.5%Whole state:
5.0%
26% Liberia 13% Chile 13% Uganda 11% Zimbabwe 9% Nigeria 8% Ethiopia 8% Honduras 5% American 4% African 2% English 2% German 1% Irish 1% European 0% Jamaican
Year of entry for the foreign-born population
265 2010 or later 0 2000 to 2009 129 1990 to 1999 155 Before 1990
There are
250 Medical Specialists in Zip Code 45406 .
Facilities with environmental interests located in this zip code:
BP OIL CO (3898 SALEM AVE in DAYTON, OH)
CRITERIA AND HAZARDOUS AIR POLLUTANT INVENTORY (Inventory of air pollution sources) STATE MASTER (Ohio general info) - RCRA-OHD987014040, HAZARDOUS WASTE PROGRAM, AIR MAJOR, -57-5541-659-28, EPCRA Conditionally Exempt Small Quantity Generators, less than 100 kg/month of hazardous waste (Resource Conservation and Recovery Act (tracking hazardous waste)) - notification Business SIC classification: GASOLINE SERVICE STATIONSOrganizations: BP OIL COMPANY (CONTACT/OWNER)
Alternative names: BP AMOCO 09780
BP OIL NO 09649 (2011 SALEM AVE in DAYTON, OH)
STATE MASTER (Ohio general info) - AIR MAJOR, -57-5541-659-22, EPCRA (Resource Conservation and Recovery Act (tracking hazardous waste)) Organizations: BP OIL COMPANY (CONTACT/OWNER)
Alternative names: BP OIL CO
ADT 82 (131 SALEM AVENUE in DAYTON, OH)
(Integrated Compliance Information System) - ICIS-HQ-2002-6000, FORMAL ENFORCEMENT ACTION
Housing units lacking complete plumbing facilities: 9.1%
Housing units lacking complete kitchen facilities: 5.8%
71.6% Utility gas 25.3% Electricity 1.8% No fuel used 1.0% Bottled, tank, or LP gas
Population in 1990: 31,024.
Place of birth for U.S.-born residents:
This state: 14,745Northeast: 566Midwest: 1,086South: 2,596West: 327
59% of the 45406 zip code residents lived in the same house 5 years ago.
Out of people who lived in different houses, 84% lived in this county.
Out of people who lived in different counties, 50% lived in Ohio.
89% of the 45406 zip code residents lived in the same house 1 year ago.
Out of people who lived in different houses, 66% moved from this county.
Out of people who lived in different houses, 14% moved from different county within same state.
Out of people who lived in different houses, 13% moved from different state.
Out of people who lived in different houses, 4% moved from abroad.
Private vs. public school enrollment:
Students in private schools in grades 1 to 8 (elementary and middle school): 237
Students in private schools in grades 9 to 12 (high school): 89
Students in private undergraduate colleges: 150
Occupation by median earnings in the past 12 months ($)
128,312 Architecture and engineering occupations 87,079 Management occupations 83,407 Computer and mathematical occupations 76,275 Law enforcement workers including supervisors 69,528 Health diagnosing and treating practitioners and other technical occupations 54,910 Construction and extraction occupations
Companies with federal contracts located in this zip code (DAYTON, OH):
BASSEL HOLOWINKO MARSHA LYNN (1735 EMERSON AVE; small business) in 6 contracts from 2001 to 2005
Contracts for Other Management Support Services by Air ForceSigned by year: 2000: $0; 2001: $102,846; 2002: $110,000; 2003: $5,343; 2004: $144,178; 2005: -$7,776; 2006: $0.
Biggest contracts: with Air Force for Other Management Support Services. Signed on 2004-12-06. Completion date: 2006-12-31.
, same as above. Signed on 2002-12-30. Completion date: 2004-12-31.
, same as above. Signed on 2001-01-12. Completion date: 2004-01-01.
, same as above. Signed on 2003-07-11. Completion date: 2004-12-31.
GOOD SAMARITAN HOSPITAL (2222 PHILADELPHIA DRIVE; small business)
$191,002 with Air Force for Laundry and DryCleaning Services. Signed on 2001-08-16. Completion date: 2002-08-31.
THE UNITED METHODIST PUBG HSE (1810 HARVARD BLVD; small business) in 8 contracts from 2002 to 2004
Contracts for Logistics Support Services by U.S. Army Corps of Engineers - civil program financing only, ArmySigned by year: 2000: $0; 2001: $0; 2002: $31,680; 2003: $1,020; 2004: -$1,822; 2005: $0; 2006: $0.
Biggest contracts: with U.S. Army Corps of Engineers - civil program financing only for Logistics Support Services. Taking place in TN. Signed on 2002-10-15. Completion date: 2002-09-30.
, same as above. Signed on 2003-09-24. Completion date: 2002-09-30.
with Army for Logistics Support Services. Taking place in TN. Signed on 2003-10-08. Completion date: 2004-09-30.
with U.S. Army Corps of Engineers - civil program financing only for Logistics Support Services. Taking place in TN. Signed on 2003-11-17. Completion date: 2004-09-30.
BUTLER, ROBERT W INC (2200 N GETTYSBURG AVE; small business) in 4 contracts from 2002 to 2006
$6,039 with Army for Laundry and DryCleaning Services. Signed on 2002-11-25. Completion date: 2003-09-30.
, same as above. Signed on 2004-10-25. Completion date: 2005-09-30.
, same as above. Signed on 2006-03-09. Completion date: 2006-09-30.
, same as above. Signed on 2003-05-14. Completion date: 2003-09-30.
FAMILY SERVICE ASSOCIATION (184 SALEM AVE RM 190) in 2 contracts from 2004 to 2005
$2,870 with Internal Revenue Service for Translation and Interpreting Services(Including Sign Language). Signed on 2004-09-22. Completion date: 2004-09-22.
with Department of Defense for Other Social Services. Signed on 2005-04-20. Completion date: 2005-05-06.
Top industries in this zip code by the number of employees in 2005:
Health Care and Social Assistance: General Medical and Surgical Hospitals (over 1000 employees: 1 establishment)Health Care and Social Assistance: Nursing Care Facilities (100-249: 3, 10-19: 1)Real Estate and Rental and Leasing: Offices of Real Estate Appraisers (250-499: 1)Accommodation and Food Services: Limited-Service Restaurants (20-49: 8, 10-19: 3, 5-9: 4, 1-4: 2)Administrative and Support and Waste Management and Remediation Services: Temporary Help Services (100-249: 1, 50-99: 1, 1-4: 1)Health Care and Social Assistance: Offices of Physicians (except Mental Health Specialists) (20-49: 2, 10-19: 4, 5-9: 7, 1-4: 11)Educational Services: Colleges, Universities, and Professional Schools (100-249: 1, 1-4: 1)Other Services (except Public Administration): Religious Organizations (10-19: 4, 5-9: 4, 1-4: 11)
People in group quarters in 2010:
191 people in nursing facilities/skilled-nursing facilities
33 people in group homes intended for adults
9 people in group homes for juveniles (non-correctional)
5 people in workers' group living quarters and job corps centers
People in group quarters in 2000:
185 people in nursing homes
63 people in other noninstitutional group quarters
58 people in homes for the mentally retarded
53 people in homes for the mentally ill
40 people in college dormitories (includes college quarters off campus)
8 people in halfway houses
Fatal accident statistics in 2014:
Fatal accident count: 2Vehicles involved in fatal accidents: 2Fatal accidents caused by drunken drivers: 2Fatalities: 2Persons involved in fatal accidents: 2Pedestrians involved in fatal accidents: 0
Fatal accident statistics in 2012:
Fatal accident count: 1Vehicles involved in fatal accidents: 2Fatal accidents caused by drunken drivers: 0Fatalities: 1Persons involved in fatal accidents: 2Pedestrians involved in fatal accidents: 0
Home Mortgage Disclosure Act Aggregated Statistics For Year 2009(Based on 5 full and 16 partial tracts) A) FHA, FSA/RHS & VA B) Conventional C) Refinancings D) Home Improvement Loans E) Loans on Dwellings For 5+ Families F) Non-occupant Loans on Number Average Value Number Average Value Number Average Value Number Average Value Number Average Value Number Average Value
LOANS ORIGINATED 71 $62,456 30 $61,062 136 $77,880 35 $15,337 1 $125,440 21 $63,144 APPLICATIONS APPROVED, NOT ACCEPTED 13 $53,431 1 $24,920 48 $74,404 10 $21,158 0 $0 11 $44,145 APPLICATIONS DENIED 30 $53,545 16 $47,497 244 $65,529 76 $23,777 0 $0 49 $44,092 APPLICATIONS WITHDRAWN 12 $64,012 5 $32,974 80 $88,779 6 $42,423 0 $0 9 $44,478 FILES CLOSED FOR INCOMPLETENESS 4 $43,362 3 $41,093 16 $71,267 3 $55,550 0 $0 4 $48,468
Aggregated Statistics For Year 2008(Based on 5 full and 16 partial tracts) A) FHA, FSA/RHS & VA B) Conventional C) Refinancings D) Home Improvement Loans E) Loans on Dwellings For 5+ Families F) Non-occupant Loans on G) Loans On Manufactured Number Average Value Number Average Value Number Average Value Number Average Value Number Average Value Number Average Value Number Average Value
LOANS ORIGINATED 86 $74,224 47 $50,805 244 $70,119 79 $25,922 6 $1,142,192 78 $50,329 2 $14,795 APPLICATIONS APPROVED, NOT ACCEPTED 9 $76,131 13 $36,345 67 $78,258 15 $39,009 0 $0 17 $54,181 0 $0 APPLICATIONS DENIED 38 $78,212 62 $84,170 540 $73,259 108 $33,888 0 $0 128 $65,219 0 $0 APPLICATIONS WITHDRAWN 7 $79,189 12 $33,358 158 $83,244 14 $67,389 0 $0 24 $48,388 0 $0 FILES CLOSED FOR INCOMPLETENESS 5 $102,582 8 $42,738 38 $73,993 5 $50,746 0 $0 13 $44,227 0 $0
Aggregated Statistics For Year 2007(Based on 5 full and 16 partial tracts) A) FHA, FSA/RHS & VA B) Conventional C) Refinancings D) Home Improvement Loans E) Loans on Dwellings For 5+ Families F) Non-occupant Loans on G) Loans On Manufactured Number Average Value Number Average Value Number Average Value Number Average Value Number Average Value Number Average Value Number Average Value
LOANS ORIGINATED 51 $78,789 272 $62,546 534 $66,952 125 $29,023 8 $374,661 292 $52,656 0 $0 APPLICATIONS APPROVED, NOT ACCEPTED 4 $106,225 76 $66,384 183 $79,252 36 $30,996 0 $0 60 $53,559 0 $0 APPLICATIONS DENIED 32 $79,313 188 $73,413 1,064 $75,364 251 $32,697 2 $71,940 274 $65,245 1 $52,830 APPLICATIONS WITHDRAWN 18 $79,074 57 $78,506 268 $77,413 49 $50,490 1 $313,520 59 $68,219 2 $20,790 FILES CLOSED FOR INCOMPLETENESS 1 $74,160 24 $65,238 113 $81,426 17 $75,858 1 $232,580 55 $75,126 0 $0
Aggregated Statistics For Year 2006(Based on 5 full and 16 partial tracts) A) FHA, FSA/RHS & VA B) Conventional C) Refinancings D) Home Improvement Loans E) Loans on Dwellings For 5+ Families F) Non-occupant Loans on G) Loans On Manufactured Number Average Value Number Average Value Number Average Value Number Average Value Number Average Value Number Average Value Number Average Value
LOANS ORIGINATED 63 $84,885 534 $61,937 765 $72,069 114 $37,061 3 $619,957 507 $55,459 0 $0 APPLICATIONS APPROVED, NOT ACCEPTED 13 $82,658 156 $66,377 267 $74,850 35 $33,379 0 $0 115 $59,721 0 $0 APPLICATIONS DENIED 33 $84,076 386 $65,574 1,195 $80,585 249 $39,604 2 $5,419,660 405 $58,891 2 $40,965 APPLICATIONS WITHDRAWN 4 $107,715 124 $69,169 470 $77,940 60 $58,581 0 $0 137 $62,453 2 $22,190 FILES CLOSED FOR INCOMPLETENESS 4 $96,982 26 $69,688 141 $88,166 2 $31,975 1 $1,240,000 27 $57,589 2 $27,980
Aggregated Statistics For Year 2005(Based on 5 full and 16 partial tracts) A) FHA, FSA/RHS & VA B) Conventional C) Refinancings D) Home Improvement Loans E) Loans on Dwellings For 5+ Families F) Non-occupant Loans on G) Loans On Manufactured Number Average Value Number Average Value Number Average Value Number Average Value Number Average Value Number Average Value Number Average Value
LOANS ORIGINATED 72 $80,570 651 $67,366 915 $71,537 124 $38,088 5 $2,213,396 508 $59,273 3 $19,513 APPLICATIONS APPROVED, NOT ACCEPTED 6 $71,473 186 $67,373 319 $69,817 38 $32,002 2 $195,545 86 $61,767 0 $0 APPLICATIONS DENIED 34 $71,179 416 $68,054 1,257 $78,490 195 $29,746 3 $230,683 241 $67,998 3 $113,467 APPLICATIONS WITHDRAWN 6 $90,275 157 $81,693 633 $87,303 74 $111,536 1 $65,070 111 $73,676 5 $77,946 FILES CLOSED FOR INCOMPLETENESS 6 $93,018 35 $60,165 100 $84,548 3 $46,387 0 $0 22 $67,060 0 $0
Aggregated Statistics For Year 2004(Based on 5 full and 16 partial tracts) A) FHA, FSA/RHS & VA B) Conventional C) Refinancings D) Home Improvement Loans E) Loans on Dwellings For 5+ Families F) Non-occupant Loans on G) Loans On Manufactured Number Average Value Number Average Value Number Average Value Number Average Value Number Average Value Number Average Value Number Average Value
LOANS ORIGINATED 117 $77,050 587 $66,065 1,118 $71,751 138 $35,766 8 $800,496 480 $57,603 4 $9,402 APPLICATIONS APPROVED, NOT ACCEPTED 12 $78,670 239 $62,765 443 $72,219 39 $35,688 0 $0 119 $63,387 0 $0 APPLICATIONS DENIED 42 $74,000 310 $64,963 1,396 $74,458 259 $25,661 0 $0 212 $54,849 3 $70,903 APPLICATIONS WITHDRAWN 9 $105,724 114 $67,217 771 $83,050 25 $35,594 2 $477,000 85 $64,862 4 $159,872 FILES CLOSED FOR INCOMPLETENESS 7 $66,953 28 $60,473 97 $87,278 8 $22,732 0 $0 26 $58,485 0 $0
Aggregated Statistics For Year 2003(Based on 5 full and 16 partial tracts) A) FHA, FSA/RHS & VA B) Conventional C) Refinancings D) Home Improvement Loans E) Loans on Dwellings For 5+ Families F) Non-occupant Loans on Number Average Value Number Average Value Number Average Value Number Average Value Number Average Value Number Average Value
LOANS ORIGINATED 107 $80,993 472 $68,683 1,463 $70,773 111 $18,420 5 $917,882 454 $54,880 APPLICATIONS APPROVED, NOT ACCEPTED 16 $81,007 145 $66,006 472 $73,626 29 $17,969 0 $0 126 $60,366 APPLICATIONS DENIED 30 $80,543 269 $61,312 1,399 $71,359 233 $15,092 0 $0 232 $53,757 APPLICATIONS WITHDRAWN 14 $72,389 65 $82,718 785 $78,977 35 $24,525 0 $0 79 $60,016 FILES CLOSED FOR INCOMPLETENESS 7 $71,677 49 $66,198 179 $78,118 8 $21,506 0 $0 36 $58,085
Aggregated Statistics For Year 2002(Based on 5 full and 12 partial tracts) A) FHA, FSA/RHS & VA B) Conventional C) Refinancings D) Home Improvement Loans E) Loans on Dwellings For 5+ Families F) Non-occupant Loans on Number Average Value Number Average Value Number Average Value Number Average Value Number Average Value Number Average Value
LOANS ORIGINATED 117 $73,121 414 $65,402 1,000 $68,400 99 $11,446 5 $165,304 296 $52,592 APPLICATIONS APPROVED, NOT ACCEPTED 10 $88,350 108 $65,411 402 $71,572 51 $20,260 1 $143,000 72 $51,151 APPLICATIONS DENIED 28 $74,551 201 $60,129 1,172 $71,365 210 $15,579 5 $538,490 152 $53,319 APPLICATIONS WITHDRAWN 14 $66,809 68 $74,371 745 $73,490 25 $15,864 0 $0 53 $50,776 FILES CLOSED FOR INCOMPLETENESS 1 $85,020 57 $59,076 136 $75,408 2 $11,750 2 $211,830 30 $51,166
Aggregated Statistics For Year 2001(Based on 5 full and 12 partial tracts) A) FHA, FSA/RHS & VA B) Conventional C) Refinancings D) Home Improvement Loans E) Loans on Dwellings For 5+ Families F) Non-occupant Loans on Number Average Value Number Average Value Number Average Value Number Average Value Number Average Value Number Average Value
LOANS ORIGINATED 123 $76,410 362 $59,018 1,182 $66,819 185 $12,352 3 $113,400 255 $49,072 APPLICATIONS APPROVED, NOT ACCEPTED 9 $74,804 92 $59,366 416 $65,316 63 $13,222 0 $0 42 $53,169 APPLICATIONS DENIED 29 $71,234 272 $59,153 1,440 $69,616 376 $12,698 2 $5,352,500 142 $49,357 APPLICATIONS WITHDRAWN 13 $62,648 90 $64,954 771 $66,933 36 $22,636 0 $0 72 $49,801 FILES CLOSED FOR INCOMPLETENESS 6 $63,212 23 $57,463 100 $64,335 2 $93,925 0 $0 12 $55,492
Aggregated Statistics For Year 2000(Based on 5 full and 12 partial tracts) A) FHA, FSA/RHS & VA B) Conventional C) Refinancings D) Home Improvement Loans E) Loans on Dwellings For 5+ Families F) Non-occupant Loans on Number Average Value Number Average Value Number Average Value Number Average Value Number Average Value Number Average Value
LOANS ORIGINATED 140 $69,440 556 $63,387 934 $60,988 238 $15,365 5 $885,800 185 $49,122 APPLICATIONS APPROVED, NOT ACCEPTED 16 $70,679 117 $64,585 425 $61,743 158 $14,748 0 $0 60 $48,844 APPLICATIONS DENIED 17 $57,821 350 $50,760 1,352 $61,105 532 $12,624 2 $114,220 180 $53,604 APPLICATIONS WITHDRAWN 17 $77,742 95 $62,257 440 $59,389 24 $16,223 1 $274,090 38 $50,158 FILES CLOSED FOR INCOMPLETENESS 4 $64,290 35 $68,397 188 $63,846 3 $19,233 0 $0 13 $58,010
Aggregated Statistics For Year 1999(Based on 4 full and 6 partial tracts) A) FHA, FSA/RHS & VA B) Conventional C) Refinancings D) Home Improvement Loans E) Loans on Dwellings For 5+ Families F) Non-occupant Loans on Number Average Value Number Average Value Number Average Value Number Average Value Number Average Value Number Average Value
LOANS ORIGINATED 83 $70,836 296 $88,240 709 $54,247 170 $11,925 1 $550,490 170 $45,373 APPLICATIONS APPROVED, NOT ACCEPTED 5 $57,830 65 $66,066 382 $56,571 90 $11,552 0 $0 48 $40,823 APPLICATIONS DENIED 11 $65,659 130 $52,517 738 $59,540 316 $10,390 2 $164,630 85 $80,913 APPLICATIONS WITHDRAWN 7 $59,119 67 $60,287 445 $59,822 19 $13,971 1 $161,910 45 $50,638 FILES CLOSED FOR INCOMPLETENESS 2 $65,340 16 $65,989 150 $57,057 3 $15,633 0 $0 6 $49,520
Private Mortgage Insurance Companies Aggregated Statistics For Year 2009(Based on 2 full and 10 partial tracts) A) Conventional B) Refinancings Number Average Value Number Average Value
LOANS ORIGINATED 0 $0 1 $76,390 APPLICATIONS APPROVED, NOT ACCEPTED 5 $60,236 7 $81,347 APPLICATIONS DENIED 2 $24,760 0 $0 APPLICATIONS WITHDRAWN 0 $0 0 $0 FILES CLOSED FOR INCOMPLETENESS 0 $0 0 $0
Aggregated Statistics For Year 2008(Based on 5 full and 16 partial tracts) A) Conventional B) Refinancings C) Non-occupant Loans on Number Average Value Number Average Value Number Average Value
LOANS ORIGINATED 28 $84,782 18 $80,104 9 $54,821 APPLICATIONS APPROVED, NOT ACCEPTED 23 $55,831 22 $90,030 13 $62,038 APPLICATIONS DENIED 5 $55,114 2 $81,085 2 $67,120 APPLICATIONS WITHDRAWN 1 $77,560 3 $106,507 1 $81,710 FILES CLOSED FOR INCOMPLETENESS 2 $75,490 1 $139,780 2 $83,945
Aggregated Statistics For Year 2007(Based on 5 full and 16 partial tracts) A) Conventional B) Refinancings C) Non-occupant Loans on Number Average Value Number Average Value Number Average Value
LOANS ORIGINATED 142 $66,465 56 $87,588 44 $55,658 APPLICATIONS APPROVED, NOT ACCEPTED 25 $86,710 36 $93,525 20 $71,360 APPLICATIONS DENIED 15 $59,725 3 $92,353 7 $45,929 APPLICATIONS WITHDRAWN 7 $83,073 7 $80,120 3 $59,850 FILES CLOSED FOR INCOMPLETENESS 2 $29,660 2 $100,920 2 $29,660
Aggregated Statistics For Year 2006(Based on 5 full and 16 partial tracts) A) Conventional B) Refinancings C) Non-occupant Loans on Number Average Value Number Average Value Number Average Value
LOANS ORIGINATED 105 $67,624 64 $85,347 52 $48,808 APPLICATIONS APPROVED, NOT ACCEPTED 20 $68,434 22 $97,087 10 $62,079 APPLICATIONS DENIED 2 $29,660 3 $65,730 4 $34,710 APPLICATIONS WITHDRAWN 6 $80,995 12 $99,365 1 $22,150 FILES CLOSED FOR INCOMPLETENESS 0 $0 4 $112,602 0 $0
Aggregated Statistics For Year 2005(Based on 5 full and 14 partial tracts) A) Conventional B) Refinancings C) Non-occupant Loans on Number Average Value Number Average Value Number Average Value
LOANS ORIGINATED 107 $66,345 68 $85,857 57 $49,962 APPLICATIONS APPROVED, NOT ACCEPTED 25 $73,332 27 $89,075 15 $56,551 APPLICATIONS DENIED 1 $43,540 0 $0 1 $39,840 APPLICATIONS WITHDRAWN 6 $110,257 9 $81,070 2 $52,990 FILES CLOSED FOR INCOMPLETENESS 0 $0 1 $87,220 0 $0
Aggregated Statistics For Year 2004(Based on 5 full and 16 partial tracts) A) Conventional B) Refinancings C) Non-occupant Loans on Number Average Value Number Average Value Number Average Value
LOANS ORIGINATED 112 $60,734 77 $82,854 62 $50,403 APPLICATIONS APPROVED, NOT ACCEPTED 21 $69,382 72 $89,566 22 $57,239 APPLICATIONS DENIED 0 $0 2 $141,045 1 $191,960 APPLICATIONS WITHDRAWN 5 $53,158 17 $103,718 6 $53,843 FILES CLOSED FOR INCOMPLETENESS 0 $0 0 $0 0 $0
Aggregated Statistics For Year 2003(Based on 5 full and 16 partial tracts) A) Conventional B) Refinancings C) Non-occupant Loans on Number Average Value Number Average Value Number Average Value
LOANS ORIGINATED 123 $66,871 155 $80,917 59 $58,214 APPLICATIONS APPROVED, NOT ACCEPTED 38 $71,947 67 $94,851 14 $57,109 APPLICATIONS DENIED 1 $45,390 7 $86,313 1 $108,000 APPLICATIONS WITHDRAWN 12 $95,697 22 $85,446 4 $64,575 FILES CLOSED FOR INCOMPLETENESS 1 $52,000 2 $67,680 3 $56,783
Aggregated Statistics For Year 2002(Based on 5 full and 12 partial tracts) A) Conventional B) Refinancings C) Non-occupant Loans on Number Average Value Number Average Value Number Average Value
LOANS ORIGINATED 141 $66,442 129 $83,335 70 $57,552 APPLICATIONS APPROVED, NOT ACCEPTED 42 $57,323 78 $90,064 23 $53,943 APPLICATIONS DENIED 11 $60,821 4 $96,510 11 $53,002 APPLICATIONS WITHDRAWN 8 $62,776 24 $81,731 6 $58,767 FILES CLOSED FOR INCOMPLETENESS 2 $28,975 2 $88,615 1 $88,200
Aggregated Statistics For Year 2001(Based on 5 full and 12 partial tracts) A) Conventional B) Refinancings C) Non-occupant Loans on Number Average Value Number Average Value Number Average Value
LOANS ORIGINATED 91 $60,638 138 $81,381 61 $50,165 APPLICATIONS APPROVED, NOT ACCEPTED 29 $55,881 57 $86,086 19 $58,113 APPLICATIONS DENIED 6 $46,660 15 $111,489 7 $52,479 APPLICATIONS WITHDRAWN 5 $72,878 8 $78,146 2 $60,605 FILES CLOSED FOR INCOMPLETENESS 0 $0 3 $59,517 0 $0
Aggregated Statistics For Year 2000(Based on 5 full and 12 partial tracts) A) Conventional B) Refinancings C) Non-occupant Loans on Number Average Value Number Average Value Number Average Value
LOANS ORIGINATED 58 $60,295 67 $64,611 26 $44,186 APPLICATIONS APPROVED, NOT ACCEPTED 17 $66,791 14 $63,127 4 $73,382 APPLICATIONS DENIED 8 $43,138 7 $77,594 8 $40,628 APPLICATIONS WITHDRAWN 6 $50,115 1 $153,280 1 $27,240 FILES CLOSED FOR INCOMPLETENESS 0 $0 0 $0 0 $0
Aggregated Statistics For Year 1999(Based on 4 full and 6 partial tracts) A) Conventional B) Refinancings C) Non-occupant Loans on Number Average Value Number Average Value Number Average Value
LOANS ORIGINATED 35 $64,660 49 $62,086 9 $43,743 APPLICATIONS APPROVED, NOT ACCEPTED 4 $39,188 6 $79,075 1 $45,000 APPLICATIONS DENIED 1 $25,900 3 $96,060 0 $0 APPLICATIONS WITHDRAWN 0 $0 0 $0 0 $0 FILES CLOSED FOR INCOMPLETENESS 0 $0 1 $69,490 0 $0
2002 - 2018 National Fire Incident Reporting System (NFIRS) incidents See full 2006 National Fire Incident Reporting System statistics for zip code 45406, Ohio
Most common first names in zip code 45406 among deceased individuals Name Count Lived (average)
Mary 230 76.1 years John 213 73.2 years William 189 71.3 years James 185 70.6 years Robert 179 67.8 years Charles 154 74.0 years George 112 72.6 years Helen 91 77.7 years Margaret 82 78.0 years Ruth 77 78.4 years
Most common last names in zip code 45406 among deceased individuals Last name Count Lived (average)
Smith 140 71.9 years Jones 86 69.6 years Williams 79 69.6 years Johnson 78 72.2 years Miller 73 79.3 years Davis 68 73.6 years Brown 66 70.7 years Jackson 49 71.0 years Taylor 48 76.4 years Harris 43 69.5 years
Businesses in zip code 45406
Name Count Name Count
Advance Auto Parts 1 Nike 2 Arby's 1 RadioShack 1 Church's Chicken 1 Rite Aid 1 Cricket Wireless 3 T-Mobile 1 Domino's Pizza 1 Taco Bell 1 H&R Block 2 U-Haul 2 KFC 1 Walgreens 1 Kroger 1 Wendy's 1 Long John Silver's 1
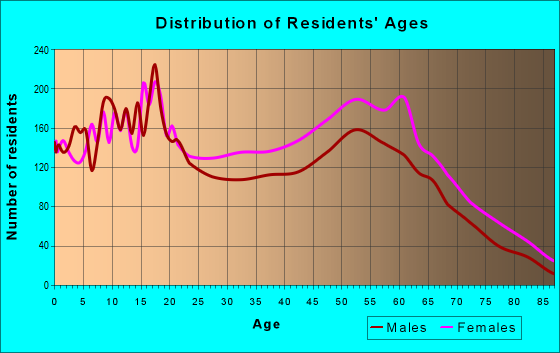
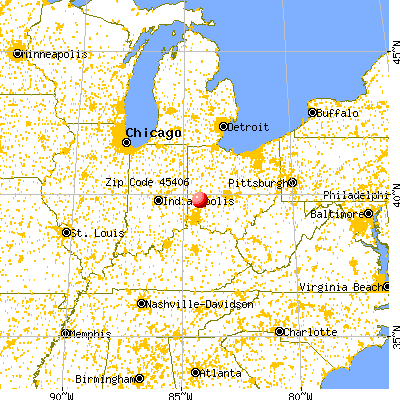

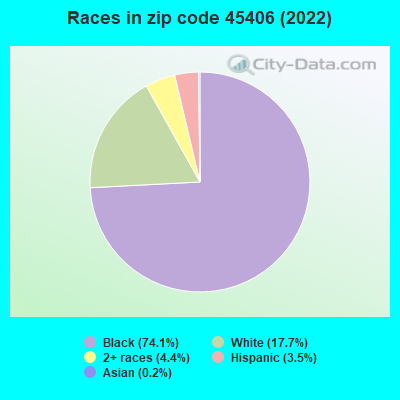


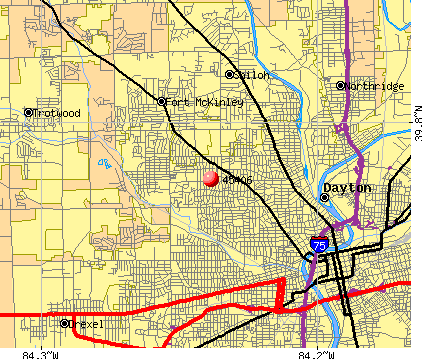 Nearest zip codes: 45405, 45416, 45402, 45428, 45415, 45417.
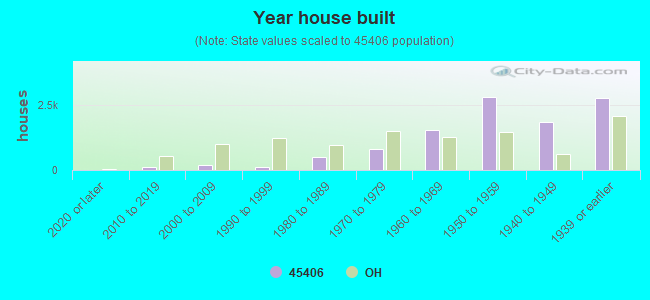

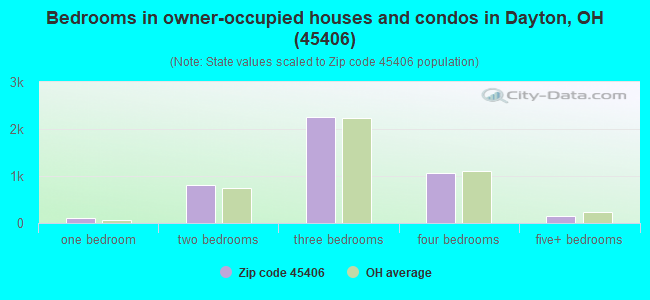
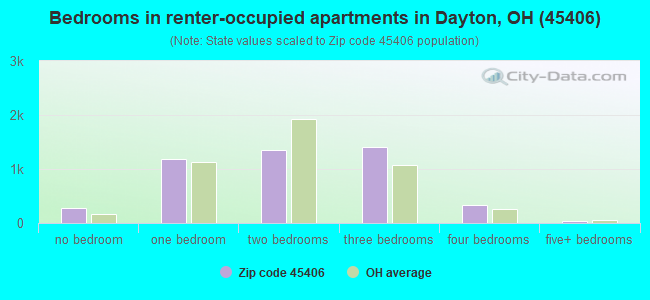
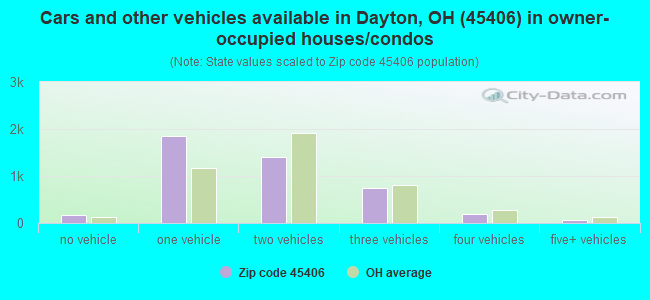
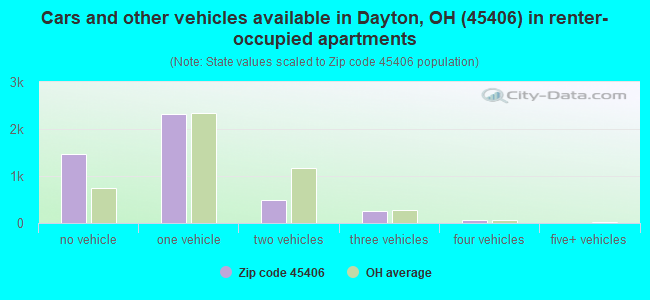


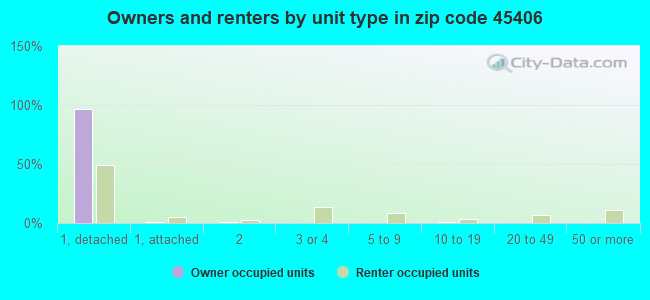
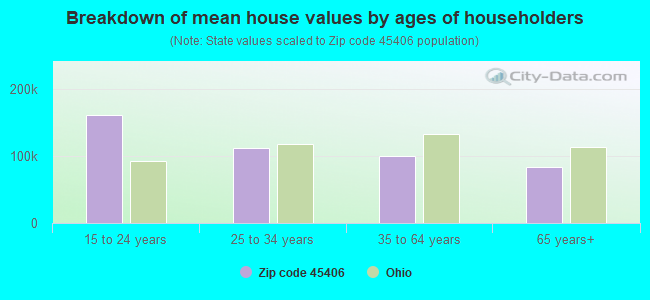


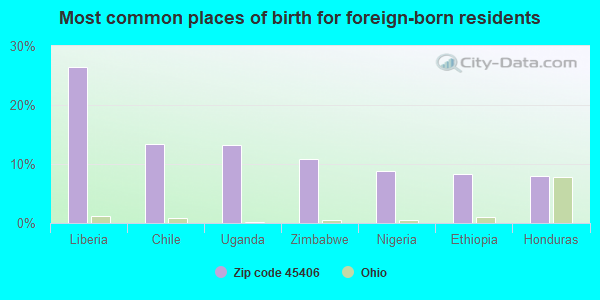
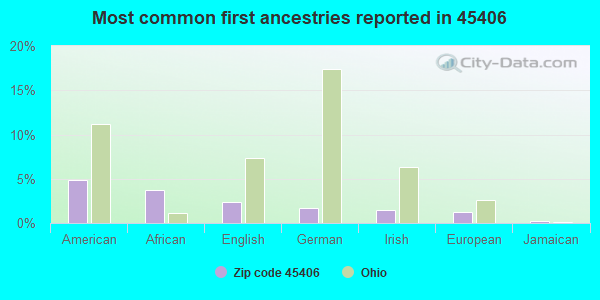
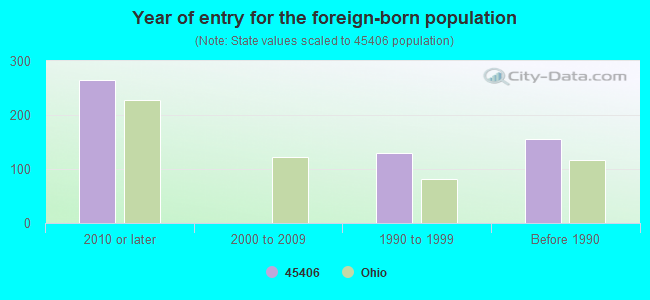
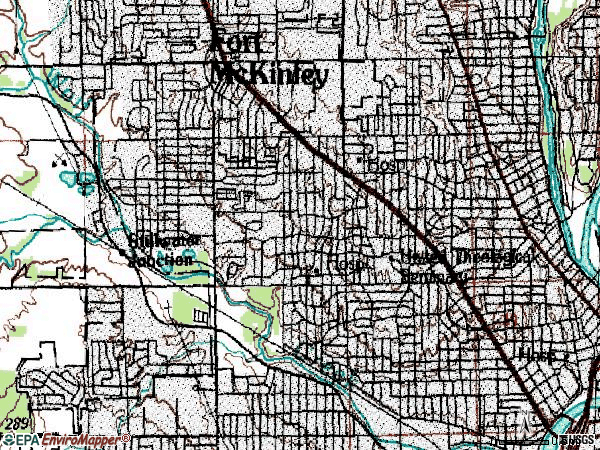


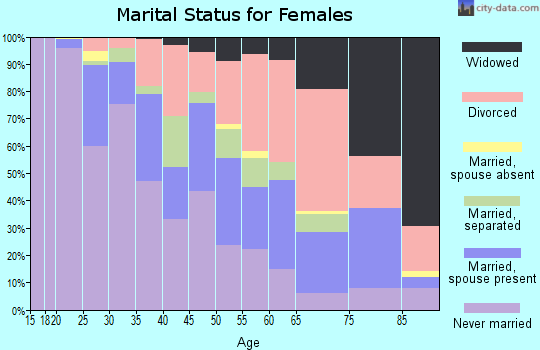
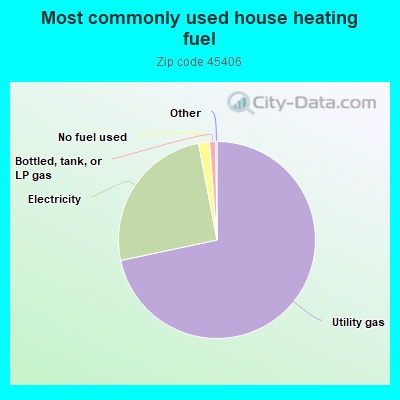
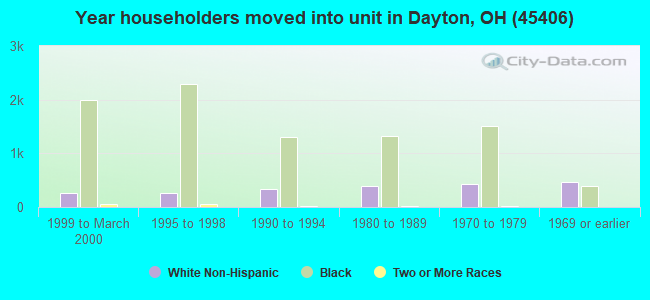
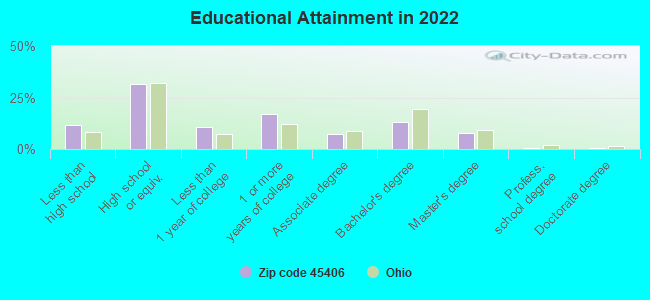
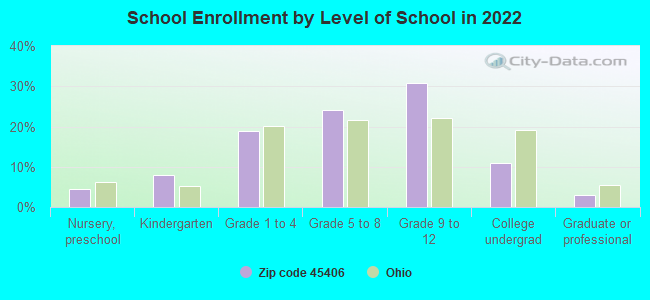
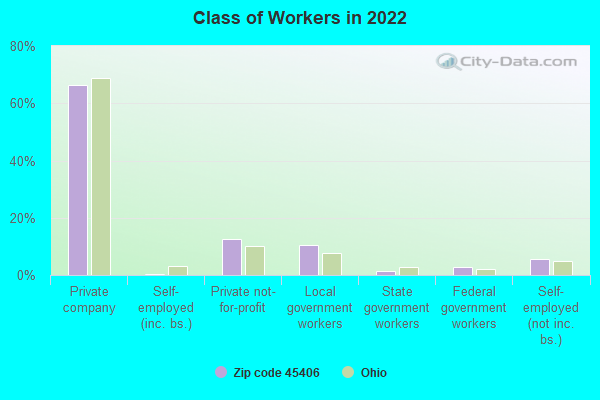
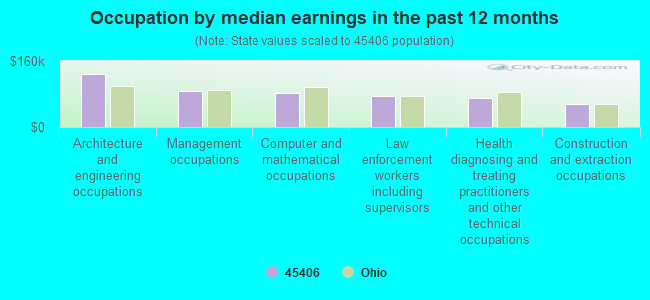
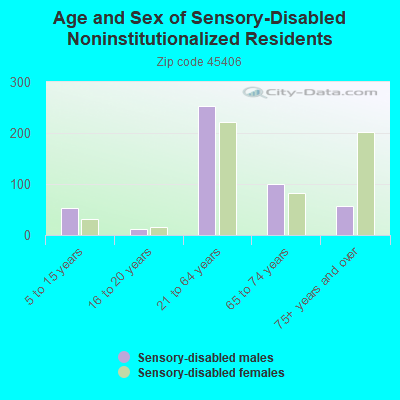

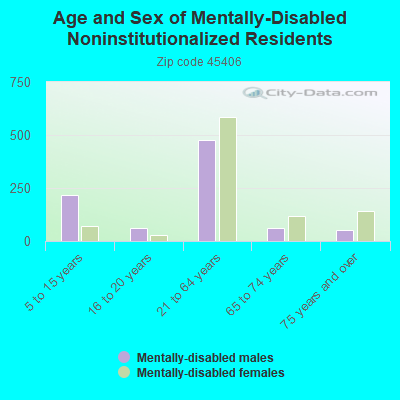
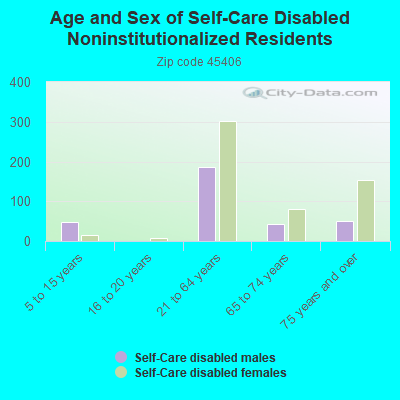
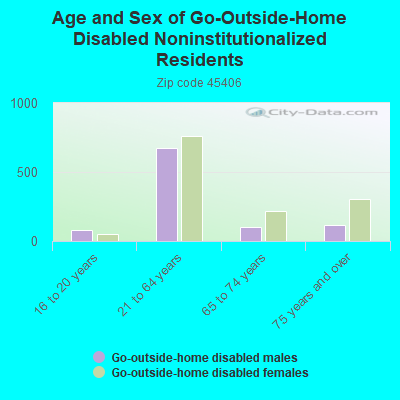
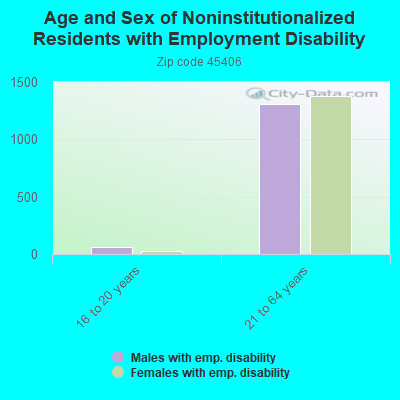
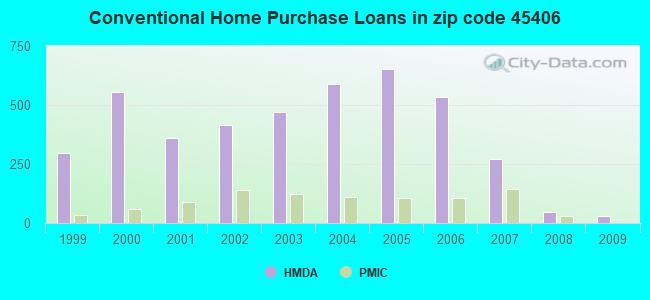

 According to the data from the years 2002 - 2018 the average number of fires per year is 103. The highest number of reported fire incidents - 192 took place in 2003, and the least - 9 in 2002. The data has a rising trend.
 When looking into fire subcategories, the most reports belonged to: Structure Fires (29.0%), and Outside Fires (28.3%).