Estimated zip code population in 2022: 5,247 Zip code population in 2010: 5,169 Zip code population in 2000: 5,541
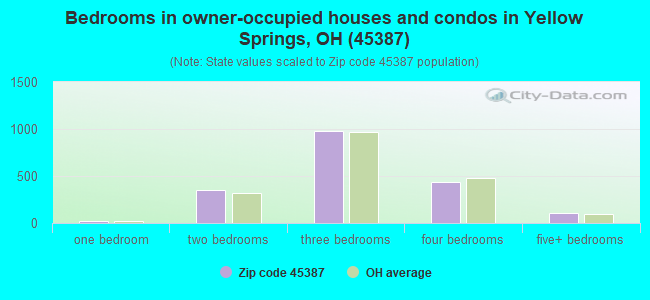
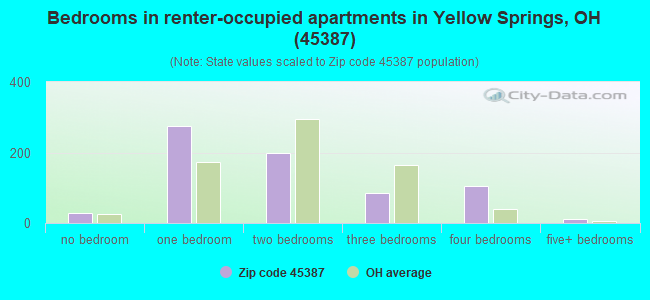
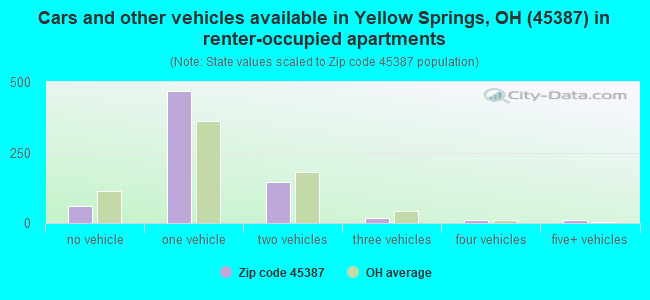
Houses and condos: 2,737 Renter-occupied apartments: 705
% of renters here:
27%
State:
33%
March 2022 cost of living index in zip code 45387: 94.7 (less than average, U.S. average is 100)
Land area: 27.6 sq. mi. Water area: 0.2 sq. mi.
Population density: 190 people per square mile
(very low).
OSM Map
General Map
Google Map
MSN Map
OSM Map
General Map
Google Map
MSN Map
OSM Map
General Map
Google Map
MSN Map
OSM Map
General Map
Google Map
MSN Map
Please wait while loading the map...
Real estate property taxes paid for housing units in 2022:
This zip code:
1.4% ($4,249)
Ohio:
1.3% ($2,639)
Median real estate property taxes paid for housing units with mortgages in 2022: $4,277 (1.3%) Median real estate property taxes paid for housing units with no mortgage in 2022: $4,246 (1.5%)
Business Search- 14 Million verified businesses
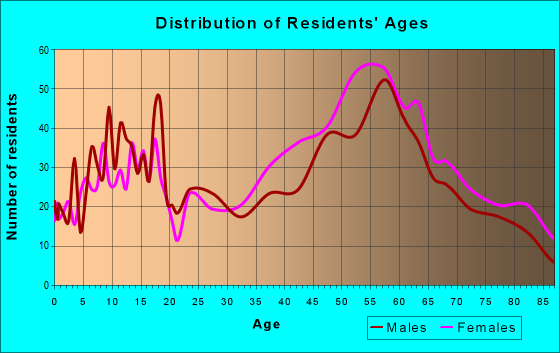
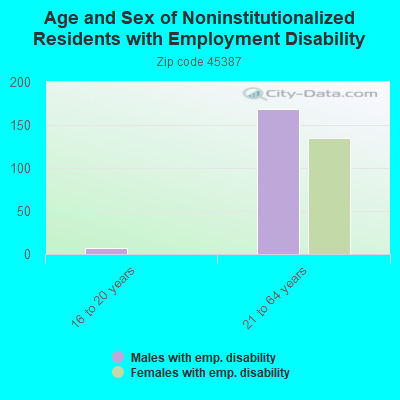
Males: 2,499
(47.6%)
Females: 2,748
(52.4%)
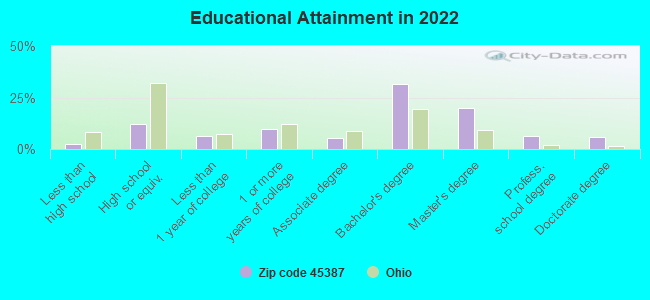
For population 25 years and over in 45387:
High school or higher: 100.1%
Bachelor's degree or higher: 65.4%
Graduate or professional degree: 33.0%
Unemployed: 3.2%
Mean travel time to work (commute): 21.1 minutes
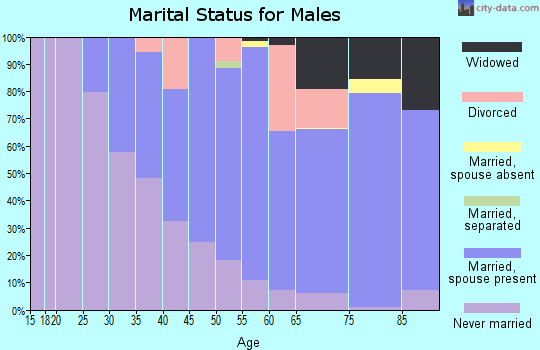
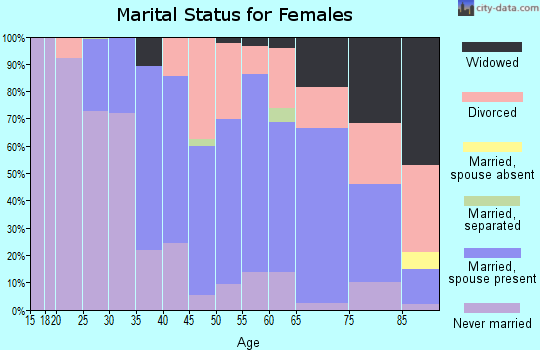
For population 15 years and over in 45387:
Never married: 23.2%
Now married: 50.8%
Separated: 1.3%
Widowed: 9.4%
Divorced: 15.2%
Zip code 45387 compared to state average:
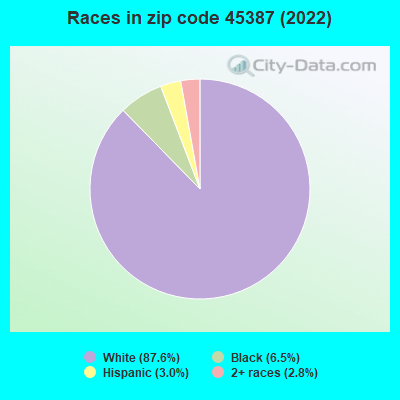
Black race population percentage below state average.
Median age significantly above state average.
Foreign-born population percentage significantly below state average.
Length of stay since moving in above state average.
Percentage of population with a bachelor's degree or higher significantly above state average.
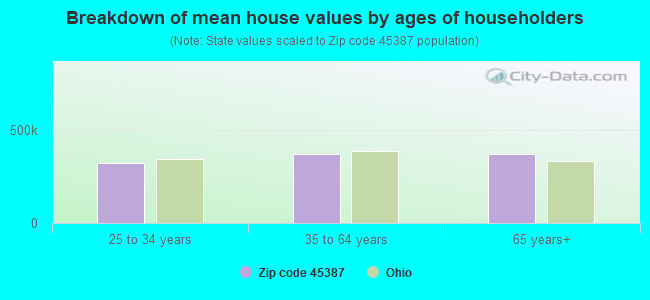
Estimated median house/condo value in 2022: $304,758
45387:
$304,758
Ohio:
$204,100
Median resident age:
This zip code:
54.5 years
Ohio median age:
39.9 years
Average household size:
This zip code:
2.0 people
Ohio:
2.4 people
Averages for the 2020 tax year for zip code 45387, filed in 2021:
Average Adjusted Gross Income (AGI) in 2020: $78,739 (Individual Income Tax Returns)
Here:
$78,739
State:
$67,288
Salary/wage: $60,595 (reported on 70.2% of returns)
Here:
$60,595
State:
$55,628
(% of AGI for various income ranges: 1135.9% for AGIs below $25k, 3118.7% for AGIs $25k-50k, 5656.2% for AGIs $50k-75k, 8036.1% for AGIs $75k-100k, 17297.3% for AGIs $100k-200k, 41441.4% for AGIs over 200k)
Taxable interest for individuals: $1,496 (reported on 45.4% of returns)
This zip code:
$1,496
Ohio:
$1,518
(% of AGI for various income ranges: 15.7% for AGIs below $25k, 45.1% for AGIs $25k-50k, 112.1% for AGIs $50k-75k, 146.7% for AGIs $75k-100k, 207.3% for AGIs $100k-200k, 838.6% for AGIs over 200k)
Ordinary dividends: $7,518 (reported on 30.9% of returns)
Here:
$7,518
State:
$7,167
(% of AGI for various income ranges: 47.1% for AGIs below $25k, 107.2% for AGIs $25k-50k, 310.0% for AGIs $50k-75k, 536.1% for AGIs $75k-100k, 706.5% for AGIs $100k-200k, 3338.6% for AGIs over 200k)
Net capital gain/loss in AGI: +$18,868 (reported on 28.0% of returns)
Here:
+$18,868
State:
+$18,919
(% of AGI for various income ranges: 38.4% for AGIs below $25k, 130.8% for AGIs $25k-50k, 159.2% for AGIs $50k-75k, 434.4% for AGIs $75k-100k, 899.2% for AGIs $100k-200k, 15282.9% for AGIs over 200k)
Profit/loss from business: +$16,468 (reported on 20.9% of returns)
Here:
+$16,468
State:
+$13,744
(% of AGI for various income ranges: 161.8% for AGIs below $25k, 290.3% for AGIs $25k-50k, 470.0% for AGIs $50k-75k, 580.0% for AGIs $75k-100k, 848.5% for AGIs $100k-200k, 4830.0% for AGIs over 200k)
Taxable individual retirement arrangement distribution: $24,105 (reported on 15.6% of returns)
45387:
$24,105
Ohio:
$18,876
(% of AGI for various income ranges: 76.9% for AGIs below $25k, 199.0% for AGIs $25k-50k, 340.4% for AGIs $50k-75k, 537.8% for AGIs $75k-100k, 1586.5% for AGIs $100k-200k, 5040.0% for AGIs over 200k)
Self-employed (Keogh) retirement plans: $21,250 (reported on 0.7% of returns)
45387:
$21,250
Ohio:
$24,898
(% of AGI for various income ranges: 236.1% for AGIs $75k-100k)
Total itemized deductions: $34,300 (reported on 9.6% of returns)
Here:
$34,300
State:
$33,869
(% of AGI for various income ranges: 234.4% for AGIs $25k-50k, 431.7% for AGIs $50k-75k, 694.4% for AGIs $75k-100k, 1038.8% for AGIs $100k-200k, 4800.0% for AGIs over 200k)
Charity contributions: $15,148 (reported on 8.2% of returns)
Here:
$15,148
State:
$14,577
(% of AGI for various income ranges: 33.1% for AGIs $25k-50k, 83.8% for AGIs $50k-75k, 181.1% for AGIs $75k-100k, 332.7% for AGIs $100k-200k, 2804.3% for AGIs over 200k)
Taxes paid: $8,088 (reported on 9.2% of returns)
45387:
$8,088
State:
$7,681
(% of AGI for various income ranges: 49.2% for AGIs $25k-50k, 118.3% for AGIs $50k-75k, 183.3% for AGIs $75k-100k, 271.2% for AGIs $100k-200k, 845.7% for AGIs over 200k)
Earned income credit: $1,579 (reported on 10.3% of returns)
Here:
$1,579
State:
$2,304
(% of AGI for various income ranges: 54.9% for AGIs below $25k, 45.6% for AGIs $25k-50k)
Percentage of individuals using paid preparers for their 2020 taxes: 91.5%
Here:
91%
State:
94%
(% for various income ranges: 89.9% for AGIs below $25k, 92.9% for AGIs $25k-50k, 92.7% for AGIs $50k-75k, 90.6% for AGIs $75k-100k, 90.9% for AGIs $100k-200k, 94.7% for AGIs over 200k)
Averages for the 2012 tax year for zip code 45387, filed in 2013:
Average Adjusted Gross Income (AGI) in 2012: $65,674 (Individual Income Tax Returns)
Here:
$65,674
State:
$54,926
Salary/wage: $50,903 (reported on 73.2% of returns)
Here:
$50,903
State:
$45,869
(% of AGI for various income ranges: 65.2% for AGIs below $25k, 69.2% for AGIs $25k-50k, 58.8% for AGIs $50k-75k, 63.2% for AGIs $75k-100k, 62.4% for AGIs $100k-200k, 35.9% for AGIs over 200k)
Taxable interest for individuals: $1,023 (reported on 46.8% of returns)
This zip code:
$1,023
Ohio:
$1,297
(% of AGI for various income ranges: 1.0% for AGIs below $25k, 0.7% for AGIs $25k-50k, 0.8% for AGIs $50k-75k, 0.6% for AGIs $75k-100k, 0.7% for AGIs $100k-200k, 0.6% for AGIs over 200k)
Ordinary dividends: $5,757 (reported on 31.0% of returns)
Here:
$5,757
State:
$5,821
(% of AGI for various income ranges: 2.5% for AGIs below $25k, 1.9% for AGIs $25k-50k, 2.4% for AGIs $50k-75k, 2.4% for AGIs $75k-100k, 3.2% for AGIs $100k-200k, 3.0% for AGIs over 200k)
Net capital gain/loss in AGI: +$12,828 (reported on 24.3% of returns)
Here:
+$12,828
State:
+$11,232
(% of AGI for various income ranges: 0.3% for AGIs below $25k, 1.0% for AGIs $50k-75k, 1.2% for AGIs $75k-100k, 2.2% for AGIs $100k-200k, 15.9% for AGIs over 200k)
Profit/loss from business: +$13,718 (reported on 21.5% of returns)
Here:
+$13,718
State:
+$12,773
(% of AGI for various income ranges: 12.3% for AGIs below $25k, 5.6% for AGIs $25k-50k, 3.7% for AGIs $50k-75k, 3.8% for AGIs $75k-100k, 3.6% for AGIs $100k-200k, 4.0% for AGIs over 200k)
Taxable individual retirement arrangement distribution: $19,858 (reported on 15.1% of returns)
45387:
$19,858
Ohio:
$14,511
(% of AGI for various income ranges: 3.9% for AGIs below $25k, 4.0% for AGIs $25k-50k, 3.2% for AGIs $50k-75k, 3.9% for AGIs $75k-100k, 5.1% for AGIs $100k-200k, 5.7% for AGIs over 200k)
Self-employment retirement plans: $22,167 (reported on 1.1% of returns)
45387:
$22,167
Ohio:
$20,257
(% of AGI for various income ranges: 2.6% for AGIs $75k-100k)
Total itemized deductions: $21,824 (19% of AGI, reported on 41.9% of returns)
Here:
$21,824
State:
$21,278
Here:
19.3% of AGI
State:
18.8% of AGI
(% of AGI for various income ranges: 10.8% for AGIs below $25k, 10.6% for AGIs $25k-50k, 14.3% for AGIs $50k-75k, 14.5% for AGIs $75k-100k, 15.4% for AGIs $100k-200k, 13.8% for AGIs over 200k)
Charity contributions: $3,939 (reported on 34.5% of returns)
Here:
$3,939
State:
$3,943
(% of AGI for various income ranges: 0.8% for AGIs below $25k, 1.2% for AGIs $25k-50k, 2.0% for AGIs $50k-75k, 2.1% for AGIs $75k-100k, 2.4% for AGIs $100k-200k, 2.4% for AGIs over 200k)
Taxes paid: $10,385 (reported on 41.9% of returns)
45387:
$10,385
State:
$9,568
(% of AGI for various income ranges: 2.8% for AGIs below $25k, 3.7% for AGIs $25k-50k, 5.5% for AGIs $50k-75k, 6.2% for AGIs $75k-100k, 8.4% for AGIs $100k-200k, 7.7% for AGIs over 200k)
Earned income credit: $1,719 (reported on 12.7% of returns)
Here:
$1,719
State:
$2,285
(% of AGI for various income ranges: 4.5% for AGIs below $25k, 0.5% for AGIs $25k-50k)
Percentage of individuals using paid preparers for their 2012 taxes: 45.4%
Here:
45%
State:
51%
(% for various income ranges: 34.7% for AGIs below $25k, 42.4% for AGIs $25k-50k, 53.5% for AGIs $50k-75k, 53.3% for AGIs $75k-100k, 53.5% for AGIs $100k-200k, 72.7% for AGIs over 200k)
Averages for the 2004 tax year for zip code 45387, filed in 2005:
Average Adjusted Gross Income (AGI) in 2004: $52,938 (Individual Income Tax Returns)
Here:
$52,938
State:
$44,480
Salary/wage: $41,883 (reported on 76.1% of returns)
Here:
$41,883
State:
$39,198
(% of AGI for various income ranges: 139.4% for AGIs below $10k, 62.3% for AGIs $10k-25k, 68.3% for AGIs $25k-50k, 66.9% for AGIs $50k-75k, 69.2% for AGIs $75k-100k, 48.6% for AGIs over 100k)
Taxable interest for individuals: $1,499 (reported on 52.4% of returns)
This zip code:
$1,499
Ohio:
$1,532
(% of AGI for various income ranges: 3.9% for AGIs below $10k, 2.5% for AGIs $10k-25k, 2.0% for AGIs $25k-50k, 1.6% for AGIs $50k-75k, 1.5% for AGIs $75k-100k, 1.0% for AGIs over 100k)
Taxable dividends: $4,557 (reported on 35.0% of returns)
Here:
$4,557
State:
$3,496
(% of AGI for various income ranges: 7.1% for AGIs below $10k, 2.3% for AGIs $10k-25k, 2.0% for AGIs $25k-50k, 1.6% for AGIs $50k-75k, 3.0% for AGIs $75k-100k, 4.0% for AGIs over 100k)
Net capital gain/loss: +$7,209 (reported on 27.1% of returns)
Here:
+$7,209
State:
+$8,582
(% of AGI for various income ranges: -2.8% for AGIs below $10k, 0.1% for AGIs $10k-25k, 0.8% for AGIs $25k-50k, 1.8% for AGIs $50k-75k, 1.5% for AGIs $75k-100k, 7.2% for AGIs over 100k)
Profit/loss from business: +$10,833 (reported on 20.8% of returns)
Here:
+$10,833
State:
+$10,813
(% of AGI for various income ranges: 7.8% for AGIs below $10k, 9.7% for AGIs $10k-25k, 4.9% for AGIs $25k-50k, 2.8% for AGIs $50k-75k, 3.2% for AGIs $75k-100k, 4.1% for AGIs over 100k)
IRA payment deduction: $3,048 (reported on 3.0% of returns)
45387:
$3,048
Ohio:
$2,794
(% of AGI for various income ranges: 0.6% for AGIs $10k-25k, 0.3% for AGIs $25k-50k, 0.2% for AGIs $50k-75k, 0.3% for AGIs $75k-100k)
Self-employed pension: $11,957 (reported on 1.6% of returns)
Here:
$11,957
Ohio:
$13,981
Total itemized deductions: $18,889 (21% of AGI, reported on 43.3% of returns)
Here:
$18,889
State:
$17,503
Here:
21.5% of AGI
State:
20.8% of AGI
(% of AGI for various income ranges: 15.7% for AGIs below $10k, 14.9% for AGIs $10k-25k, 15.8% for AGIs $25k-50k, 16.1% for AGIs $50k-75k, 17.4% for AGIs $75k-100k, 14.4% for AGIs over 100k)
Charity contributions deductions: $3,500 (4% of AGI, reported on 37.0% of returns)
Here:
$3,500
State:
$3,087
Here:
3.6% of AGI
State:
3.4% of AGI
(% of AGI for various income ranges: 1.0% for AGIs below $10k, 1.3% for AGIs $10k-25k, 1.8% for AGIs $25k-50k, 2.0% for AGIs $50k-75k, 2.3% for AGIs $75k-100k, 3.2% for AGIs over 100k)
Total tax: $8,619 (reported on 79.1% of returns)
45387:
$8,619
State:
$6,781
(% of AGI for various income ranges: 4.0% for AGIs below $10k, 5.4% for AGIs $10k-25k, 8.4% for AGIs $25k-50k, 9.8% for AGIs $50k-75k, 11.4% for AGIs $75k-100k, 17.8% for AGIs over 100k)
Earned income credit: $1,341 (reported on 9.2% of returns)
Here:
$1,341
State:
$1,696
Percentage of individuals using paid preparers for their 2004 taxes: 48.5%
Here:
49%
State:
55%
(% for various income ranges: 37.8% for AGIs below $10k, 49.5% for AGIs $10k-25k, 52.8% for AGIs $25k-50k, 51.5% for AGIs $50k-75k, 45.8% for AGIs $75k-100k, 55.2% for AGIs over 100k)
Likely homosexual households (counted as self-reported same-sex unmarried-partner households)
Lesbian couples: 0.5% of all households
Gay men: 0.0% of all households
Household received Food Stamps/SNAP in the past 12 months: 151 Household did not receive Food Stamps/SNAP in the past 12 months: 2,441
Women who had a birth in the past 12 months: 35 (36 now married, 0 unmarried) Women who did not have a birth in the past 12 months: 747 (360 now married, 386 unmarried)
Housing units in zip code 45387 with a mortgage: 921 (165 second mortgage, 137 both second mortgage and home equity loan) Houses without a mortgage: 71
Median monthly owner costs for units with a mortgage: $1,603 Median monthly owner costs for units without a mortgage: $696
Residents with income below the poverty level in 2022:
This zip code:
6.4%
Whole state:
13.4%
Residents with income below 50% of the poverty level in 2022:
This zip code:
3.6%
Whole state:
7.0%
Median number of rooms in houses and condos:
Here:
6.5
State:
6.7
Median number of rooms in apartments:
Here:
4.3
State:
4.4
Notable locations in this zip code not listed on our city pages
Notable locations in zip code 45387: Camp Cooper (A), Lower Picnic Area (B), Orton Picnic Area (C), Wingo Picnic Area (D), Peifer Orchards (E), Camp Birch (F), Camp Clifton (G), Camp Greene (H), Youngs Jersey Dairy (I), Miami Township Fire and Rescue (J). Display/hide their locations on the map
Churches in zip code 45387 include: First Baptist Church (A), First Presbyterian Church (B), Saint Pauls Church (C), Yellow Springs United Methodist Church (D), Pleasant Grove Church (E), Clifton United Presbyterian Church (F). Display/hide their locations on the map
Cemeteries: Pleasant Grove Cemetery (1), Glen Forest Cemetery (2), Saint Pauls Catholic Cemetery (3), Clifton Cemetery (4), McClellan Cemetery (5). Display/hide their locations on the map
Parks in zip code 45387 include: Orton Memorial Monument (1), John Bryan State Park (2), Grinnell Mill Historic District (3), Horace Mann Memorial Monument (4), Gaunt Park (5), Glen Helen Nature Preserve (6), Ellis Park (7), Clifton Gorge State Nature Preserve (8), Yellow Springs Historic District (9). Display/hide their locations on the map
In group quarters: 120 (-1 institutionalized population)
Size of family households: 758 2-persons, 278 3-persons, 217 4-persons, 55 5-persons, 25 6-persons, 15 7-or-more-persons
Size of nonfamily households: 1,091 1-person, 163 2-persons
517 married couples with children.
110 single-parent households (7 men, 103 women).
97.8% of residents of 45387 zip code speak English at home.
1.6% of residents speak Spanish at home (76% very well, 5% well, 19% not well).
0.8% of residents speak other Indo-European language at home (100% very well).
0.3% of residents speak other language at home (100% very well).
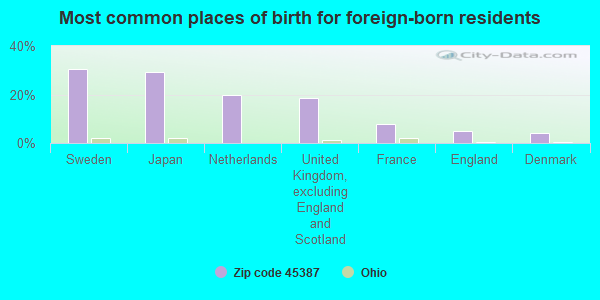
Foreign born population: 103 (2.0%) (93.1% of them are naturalized citizens)
This zip code:
2.0%
Whole state:
5.0%
30%Sweden
29%Japan
20%Netherlands
19%United Kingdom, excluding England and Scotland
8%France
5%England
4%Denmark
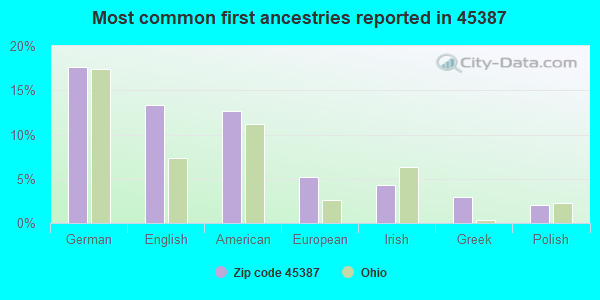
18%German
13%English
13%American
5%European
4%Irish
3%Greek
2%Polish
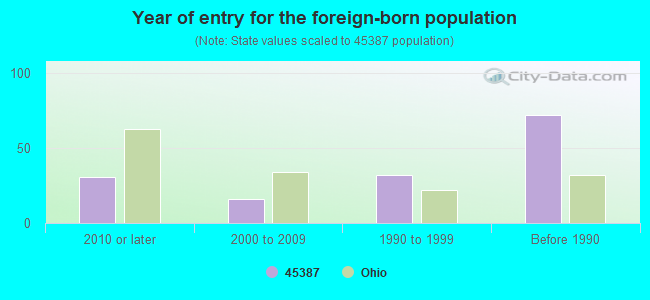
Year of entry for the foreign-born population
312010 or later
162000 to 2009
321990 to 1999
72Before 1990
Facilities with environmental interests located in this zip code:
CF KETTERING RES LAB * (150 E SOUTH COLLEGE ST in YELLOW SPRINGS, OH)
AIR MINOR (AIRS/AFS) AIR MONITORING SITE (Airborne pollution emission tracking) STATE MASTER (Ohio general info) - AIR MAJOR Business SIC classification: COLLEGES, UNIVERSITIES, AND PROFESSIONAL SCHOOLS Alternative names: ANTIOCH COLLEGE, ANTIOCH COLLEGE (STUDENT UNION BLDG)
ANTIOCH PUBLISHING CO (888 DAYTON STREET in YELLOW SPRINGS, OH)
AIR MINOR (AIRS/AFS) STATE MASTER (Ohio general info) - AIR MAJOR, RCRA-OHD004247961, HAZARDOUS WASTE PROGRAM Conditionally Exempt Small Quantity Generators, less than 100 kg/month of hazardous waste (Resource Conservation and Recovery Act (tracking hazardous waste)) - notification Business SIC classification: COMMERCIAL PRINTING, LITHOGRAPHIC; COMMERCIAL PRINTING Organizations: MORGAN LEE (CONTACT/OWNER)
BP OIL CO (4 XENIA AVENUE in YELLOW SPRINGS, OH)
AIR MINOR (AIRS/AFS) CRITERIA AND HAZARDOUS AIR POLLUTANT INVENTORY (Inventory of air pollution sources) STATE MASTER (Ohio general info) - RCRA-OHD987015922, HAZARDOUS WASTE PROGRAM, AIR MAJOR, -29*5541-659-6, EPCRA Conditionally Exempt Small Quantity Generators, less than 100 kg/month of hazardous waste (Resource Conservation and Recovery Act (tracking hazardous waste)) - notification Business SIC classification: GASOLINE SERVICE STATIONS Organizations: BP OIL COMPANY (CONTACT/OWNER)
Alternative names: BP - PETTIT ENTERPRISES INC., BP PROFIT
ANTIOCH COLLEGE (795 LIVERMORE ST in YELLOW SPRINGS, OH)
(Geographic Names Information System) (Integrated Compliance Information System) - ICIS-05-1991-0154, FORMAL ENFORCEMENT ACTION, ICIS-05-1998-0056, COMPLIANCE ACTIVITY (Tracking inspections of insecticide, fungicide, and rodenticide, and toxic substances) Conditionally Exempt Small Quantity Generators, less than 100 kg/month of hazardous waste (Resource Conservation and Recovery Act (tracking hazardous waste)) - notification Business SIC classification: COLLEGES, UNIVERSITIES, AND PROFESSIONAL SCHOOLS Organizations: ANTIOCH UNIVERSITY (CONTACT/OWNER)
Alternative names: ANTIOCH UNIV
ABBOTT OIL CO (3690 US ROUTE 68 NORTH in YELLOW SPRINGS, OH)
CRITERIA AND HAZARDOUS AIR POLLUTANT INVENTORY (Inventory of air pollution sources) STATE MASTER (Ohio general info) - AIR MAJOR, EPCRA Business SIC classification: PETROLEUM BULK STATIONS AND TERMINALS
ANTIOCH UNIV (75 LIVERMORE STREET in YELLOW SPRINGS, OH)
COMPLIANCE ACTIVITY (Tracking inspections of insecticide, fungicide, and rodenticide, and toxic substances)
ANTIOCH UNIVERSITY (1110 LIVERMORE STREET in YELLOW SPRINGS, OH)
COMPLIANCE ACTIVITY (Tracking inspections of insecticide, fungicide, and rodenticide, and toxic substances)
Housing units lacking complete plumbing facilities: 0.7% Housing units lacking complete kitchen facilities: 2.8%
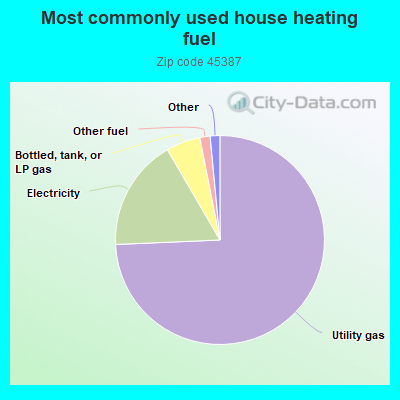
74.4%Utility gas
17.3%Electricity
5.3%Bottled, tank, or LP gas
1.6%Other fuel
0.9%Fuel oil, kerosene, etc.
0.6%Wood
Population in 1990: 5,743.
Place of birth for U.S.-born residents:
This state: 3,107
Northeast: 468
Midwest: 744
South: 490
West: 275
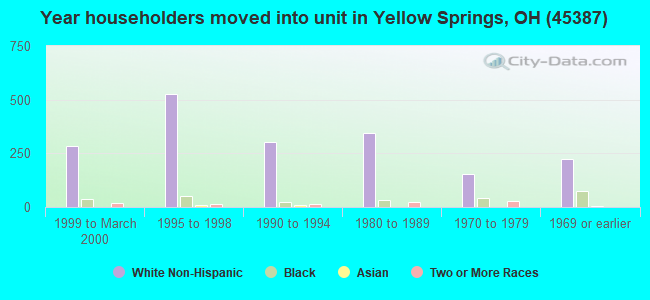
57% of the 45387 zip code residents lived in the same house 5 years ago. Out of people who lived in different houses, 43% lived in this county. Out of people who lived in different counties, 50% lived in Ohio.
90% of the 45387 zip code residents lived in the same house 1 year ago. Out of people who lived in different houses, 44% moved from this county. Out of people who lived in different houses, 23% moved from different county within same state. Out of people who lived in different houses, 33% moved from different state.
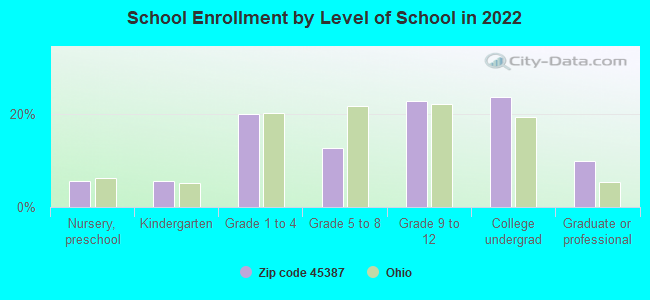
Private vs. public school enrollment:
Students in private schools in grades 1 to 8 (elementary and middle school): 61
Here:
20.2%
Ohio:
16.0%
Students in private schools in grades 9 to 12 (high school): 10
Here:
4.8%
Ohio:
13.1%
Students in private undergraduate colleges: 71
Here:
32.7%
Ohio:
22.3%
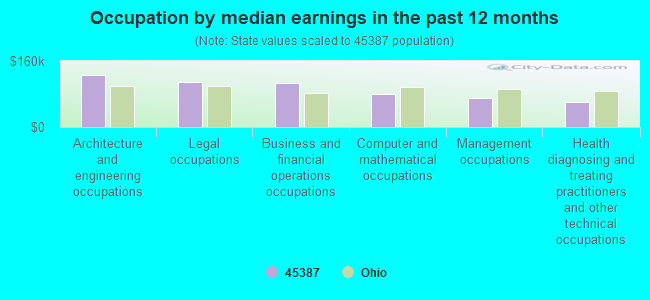
Occupation by median earnings in the past 12 months ($)
127,261Architecture and engineering occupations
110,059Legal occupations
106,991Business and financial operations occupations
80,002Computer and mathematical occupations
71,460Management occupations
61,297Health diagnosing and treating practitioners and other technical occupations
Companies with federal contracts located in this zip code (YELLOW SPRINGS, OH):
ANTHROTECH (503 XENIA AVE; small business) : $1,466,599 in 21 contractsfrom 2000 to 2006
Contracts for Health Services -- Applied Research and Exploratory Development (R&D), Life Sciences -- Basic Research (R&D), Other Sciences Not Elsewhere Classified -- Basic Research (R&D), Other Professional Services, and moreby Centers for Disease Control and Prevention, Army, Department of Defense Signed by year:2000: $195,845; 2001: $358,000; 2002: $105,000; 2003: $327,207; 2004: $74,266; 2005: $110,101; 2006: $296,180.
Biggest contracts:
$358,000 with Centers for Disease Control and Prevention for Health Services -- Applied Research and Exploratory Development (R&D). Signed on 2001-08-15. Completion date: 2003-02-15.
$260,479 with Army for Life Sciences -- Basic Research (R&D). Signed on 2003-02-18. Completion date: 2004-09-30.
$175,115 with Army for Other Sciences Not Elsewhere Classified -- Basic Research (R&D). Signed on 2006-05-01. Completion date: 2007-03-13.
$137,000 with Centers for Disease Control and Prevention for Health Services -- Applied Research and Exploratory Development (R&D). Signed on 2000-06-15. Completion date: 2002-04-15.
DEAL CORP (131 N WALNUT ST; small business) : $474,999 in 3 contractsfrom 2005 to 2006
$250,000 with Air Force for Other Research and Development -- Basic Research (R&D). Signed on 2006-04-12. Completion date: 2008-04-07.
$125,000, same as above.Signed on 2006-06-23. Completion date: 2008-04-07.
$99,999, same as above.Signed on 2005-04-23. Completion date: 2006-01-31.
G & W SERVICES (472 YELLOW SPRINGS FAIRFIE; small business) : $57,890 in 2 contractsin 2005
$39,200 with Air Force for Landscaping/Groundskeeping Services. Signed on 2005-07-28. Completion date: 2005-11-30.
$18,690, same as above.Signed on 2005-09-29. Completion date: 2005-11-30.
ROBERTS, TODD A (598 WOODHAVEN TR; small business) : $44,443 in 5 contractsfrom 2004 to 2005
Contracts for Non-Food Items For Resale, Food Items For Resale by Defense Commissary Agency Signed by year:2000: $0; 2001: $0; 2002: $0; 2003: $0; 2004: $14,260; 2005: $30,183; 2006: $0.
Biggest contracts:
$14,988 with Defense Commissary Agency for Non-Food Items For Resale. Signed on 2005-10-01. Completion date: 2005-12-31.
$14,260 with Defense Commissary Agency for Food Items For Resale. Signed on 2004-10-01. Completion date: 2005-02-28.
$8,513, same as above.Signed on 2005-04-01. Completion date: 2005-08-31.
$4,826, same as above.Signed on 2005-01-01. Completion date: 2005-03-31.
CURTIS MANAGEMENT RESOURCES, L (4913 CORNERSTONE TRAIL; small business) : $23,960 in 3 contractsfrom 2003 to 2004
$20,000 with Air Force for Other ADP and Telecommunications Services (includes data storage on tapes, compact disks, etc.). Signed on 2003-01-17. Completion date: 2004-09-30.
$2,970, same as above.Signed on 2004-08-04. Completion date: 2004-09-30.
$990, same as above.Signed on 2004-09-27. Completion date: 2004-09-30.
SCHUERMEYER CONSULTING LLC (1759 SOUTHVIEW; small business)
$17,000 with Air Force for Education Services. Signed on 2004-07-08. Completion date: 2005-06-11.
Top industries in this zip code by the number of employees in 2005:
Educational Services: Colleges, Universities, and Professional Schools (500-999 employees: 1 establishment, 100-249 employees: 1 establishment, 20-49 employees: 1 establishment)
Accommodation and Food Services: Limited-Service Restaurants (100-249: 1, 10-19: 2)
Health Care and Social Assistance: Nursing Care Facilities (100-249: 1)
2002 - 2018 National Fire Incident Reporting System (NFIRS) incidents
According to the data from the years 2002 - 2018 the average number of fires per year is 23. The highest number of reported fire incidents - 35 took place in 2018, and the least - 14 in 2012. The data has a rising trend.
When looking into fire subcategories, the most reports belonged to: Structure Fires (51.4%), and Outside Fires (34.6%).
Fire incident types reported to NFIRS in Zip Code 45387
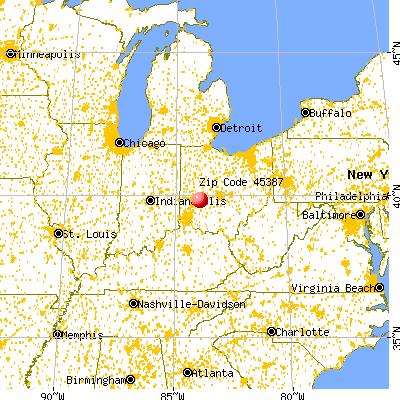


 Nearest zip codes: 45316, 45323, 45384, 45324, 45314, 45506.


 According to the data from the years 2002 - 2018 the average number of fires per year is 23. The highest number of reported fire incidents - 35 took place in 2018, and the least - 14 in 2012. The data has a rising trend.
 When looking into fire subcategories, the most reports belonged to: Structure Fires (51.4%), and Outside Fires (34.6%).