Estimated zip code population in 2022: 7,093 Zip code population in 2010: 7,402 Zip code population in 2000: 7,082
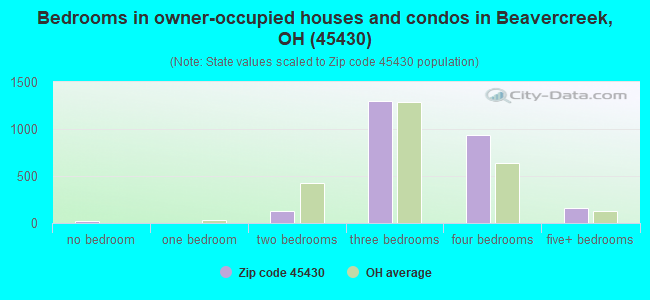
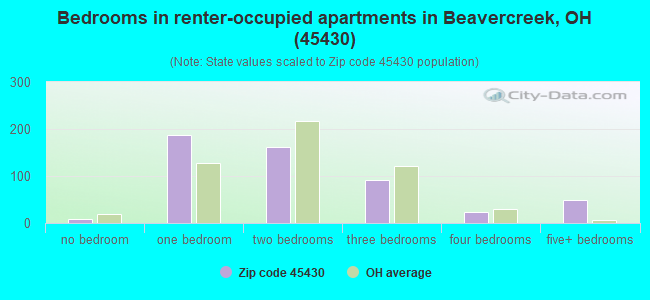
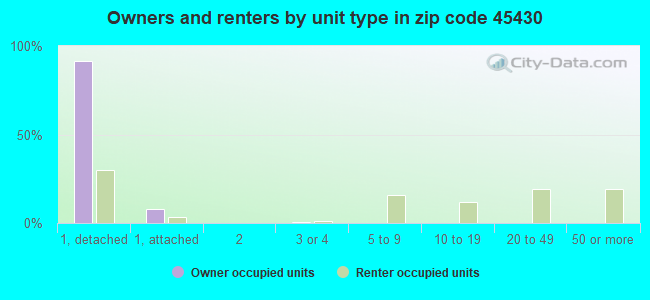
Houses and condos: 3,166 Renter-occupied apartments: 524
% of renters here:
17%
State:
33%
March 2022 cost of living index in zip code 45430: 94.8 (less than average, U.S. average is 100)
Land area: 5.0 sq. mi. Water area: 0.0 sq. mi.
Population density: 1,411 people per square mile
(low).
OSM Map
General Map
Google Map
MSN Map
OSM Map
General Map
Google Map
MSN Map
OSM Map
General Map
Google Map
MSN Map
OSM Map
General Map
Google Map
MSN Map
Please wait while loading the map...
Real estate property taxes paid for housing units in 2022:
This zip code:
1.9% ($4,838)
Ohio:
1.3% ($2,639)
Median real estate property taxes paid for housing units with mortgages in 2022: $4,769 (1.8%) Median real estate property taxes paid for housing units with no mortgage in 2022: $5,041 (2.0%)
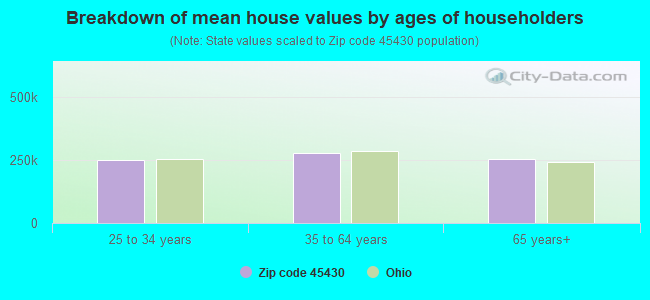
Estimated median house/condo value in 2022: $259,996
45430:
$259,996
Ohio:
$204,100
According to our research of Ohio and other state lists, there were 3 registered sex offenders living in 45430 zip code as of April 27, 2024. The ratio of all residents to sex offenders in zip code 45430 is 2,405 to 1. The ratio of registered sex offenders to all residents in this zip code is much lower than the state average.
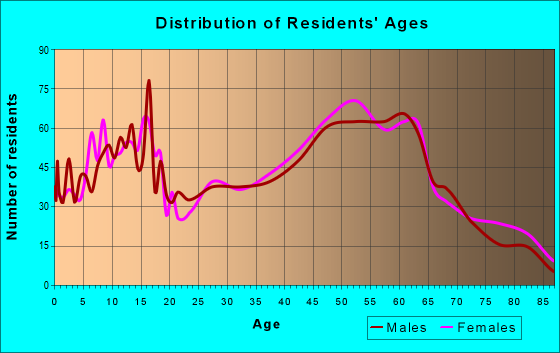
Median resident age:
This zip code:
47.6 years
Ohio median age:
39.9 years
Average household size:
This zip code:
2.3 people
Ohio:
2.4 people
Averages for the 2020 tax year for zip code 45430, filed in 2021:
Average Adjusted Gross Income (AGI) in 2020: $82,478 (Individual Income Tax Returns)
Here:
$82,478
State:
$67,288
Salary/wage: $70,517 (reported on 77.9% of returns)
Here:
$70,517
State:
$55,628
(% of AGI for various income ranges: 1083.4% for AGIs below $25k, 2993.3% for AGIs $25k-50k, 6497.7% for AGIs $50k-75k, 8861.4% for AGIs $75k-100k, 16626.7% for AGIs $100k-200k, 59115.7% for AGIs over 200k)
Taxable interest for individuals: $1,402 (reported on 52.8% of returns)
This zip code:
$1,402
Ohio:
$1,518
(% of AGI for various income ranges: 22.3% for AGIs below $25k, 43.8% for AGIs $25k-50k, 51.6% for AGIs $50k-75k, 103.8% for AGIs $75k-100k, 186.2% for AGIs $100k-200k, 1307.1% for AGIs over 200k)
Ordinary dividends: $4,109 (reported on 32.7% of returns)
Here:
$4,109
State:
$7,167
(% of AGI for various income ranges: 49.4% for AGIs below $25k, 84.8% for AGIs $25k-50k, 131.1% for AGIs $50k-75k, 166.5% for AGIs $75k-100k, 343.6% for AGIs $100k-200k, 2101.4% for AGIs over 200k)
Net capital gain/loss in AGI: +$8,190 (reported on 28.4% of returns)
Here:
+$8,190
State:
+$18,919
(% of AGI for various income ranges: 31.9% for AGIs below $25k, 46.5% for AGIs $25k-50k, 132.3% for AGIs $50k-75k, 142.2% for AGIs $75k-100k, 604.2% for AGIs $100k-200k, 6145.7% for AGIs over 200k)
Profit/loss from business: +$19,469 (reported on 14.0% of returns)
Here:
+$19,469
State:
+$13,744
(% of AGI for various income ranges: 99.5% for AGIs below $25k, 148.3% for AGIs $25k-50k, 229.3% for AGIs $50k-75k, 204.3% for AGIs $75k-100k, 516.0% for AGIs $100k-200k, 6738.6% for AGIs over 200k)
Taxable individual retirement arrangement distribution: $18,654 (reported on 14.5% of returns)
45430:
$18,654
Ohio:
$18,876
(% of AGI for various income ranges: 91.9% for AGIs below $25k, 222.7% for AGIs $25k-50k, 312.5% for AGIs $50k-75k, 395.7% for AGIs $75k-100k, 795.3% for AGIs $100k-200k, 2417.1% for AGIs over 200k)
Total itemized deductions: $30,084 (reported on 8.1% of returns)
Here:
$30,084
State:
$33,869
(% of AGI for various income ranges: 225.0% for AGIs $25k-50k, 229.8% for AGIs $50k-75k, 318.6% for AGIs $75k-100k, 602.4% for AGIs $100k-200k, 4220.0% for AGIs over 200k)
Charity contributions: $12,465 (reported on 6.6% of returns)
Here:
$12,465
State:
$14,577
(% of AGI for various income ranges: 19.0% for AGIs below $25k, 62.0% for AGIs $50k-75k, 63.5% for AGIs $75k-100k, 220.2% for AGIs $100k-200k, 2005.7% for AGIs over 200k)
Taxes paid: $7,469 (reported on 8.1% of returns)
45430:
$7,469
State:
$7,681
(% of AGI for various income ranges: 36.2% for AGIs $25k-50k, 60.0% for AGIs $50k-75k, 88.6% for AGIs $75k-100k, 184.5% for AGIs $100k-200k, 850.0% for AGIs over 200k)
Earned income credit: $1,672 (reported on 6.3% of returns)
Here:
$1,672
State:
$2,304
(% of AGI for various income ranges: 38.4% for AGIs below $25k, 34.6% for AGIs $25k-50k)
Percentage of individuals using paid preparers for their 2020 taxes: 92.6%
Here:
93%
State:
94%
(% for various income ranges: 92.1% for AGIs below $25k, 94.0% for AGIs $25k-50k, 92.3% for AGIs $50k-75k, 92.7% for AGIs $75k-100k, 92.7% for AGIs $100k-200k, 90.9% for AGIs over 200k)
Averages for the 2012 tax year for zip code 45430, filed in 2013:
Average Adjusted Gross Income (AGI) in 2012: $70,570 (Individual Income Tax Returns)
Here:
$70,570
State:
$54,926
Salary/wage: $61,138 (reported on 82.6% of returns)
Here:
$61,138
State:
$45,869
(% of AGI for various income ranges: 70.1% for AGIs below $25k, 68.0% for AGIs $25k-50k, 73.0% for AGIs $50k-75k, 74.9% for AGIs $75k-100k, 75.7% for AGIs $100k-200k, 61.5% for AGIs over 200k)
Taxable interest for individuals: $890 (reported on 53.5% of returns)
This zip code:
$890
Ohio:
$1,297
(% of AGI for various income ranges: 1.5% for AGIs below $25k, 0.9% for AGIs $25k-50k, 0.7% for AGIs $50k-75k, 0.7% for AGIs $75k-100k, 0.5% for AGIs $100k-200k, 0.6% for AGIs over 200k)
Ordinary dividends: $3,291 (reported on 32.1% of returns)
Here:
$3,291
State:
$5,821
(% of AGI for various income ranges: 2.2% for AGIs below $25k, 1.5% for AGIs $25k-50k, 1.4% for AGIs $50k-75k, 1.4% for AGIs $75k-100k, 1.3% for AGIs $100k-200k, 1.8% for AGIs over 200k)
Net capital gain/loss in AGI: +$4,348 (reported on 25.0% of returns)
Here:
+$4,348
State:
+$11,232
(% of AGI for various income ranges: 0.2% for AGIs $25k-50k, 0.8% for AGIs $50k-75k, 0.8% for AGIs $75k-100k, 0.9% for AGIs $100k-200k, 5.2% for AGIs over 200k)
Profit/loss from business: +$15,483 (reported on 12.5% of returns)
Here:
+$15,483
State:
+$12,773
(% of AGI for various income ranges: 5.1% for AGIs below $25k, 3.2% for AGIs $25k-50k, 2.9% for AGIs $50k-75k, 1.8% for AGIs $75k-100k, 1.9% for AGIs $100k-200k, 4.3% for AGIs over 200k)
Taxable individual retirement arrangement distribution: $13,742 (reported on 13.0% of returns)
45430:
$13,742
Ohio:
$14,511
(% of AGI for various income ranges: 5.3% for AGIs below $25k, 3.6% for AGIs $25k-50k, 2.3% for AGIs $50k-75k, 2.1% for AGIs $75k-100k, 2.7% for AGIs $100k-200k, 1.7% for AGIs over 200k)
Self-employment retirement plans: $20,800 (reported on 0.5% of returns)
45430:
$20,800
Ohio:
$20,257
(% of AGI for various income ranges: 1.0% for AGIs $50k-75k)
Total itemized deductions: $19,350 (18% of AGI, reported on 47.3% of returns)
Here:
$19,350
State:
$21,278
Here:
18.0% of AGI
State:
18.8% of AGI
(% of AGI for various income ranges: 11.4% for AGIs below $25k, 11.4% for AGIs $25k-50k, 12.3% for AGIs $50k-75k, 14.0% for AGIs $75k-100k, 13.9% for AGIs $100k-200k, 11.9% for AGIs over 200k)
Charity contributions: $3,750 (reported on 39.4% of returns)
Here:
$3,750
State:
$3,943
(% of AGI for various income ranges: 1.0% for AGIs below $25k, 1.3% for AGIs $25k-50k, 1.8% for AGIs $50k-75k, 2.2% for AGIs $75k-100k, 2.3% for AGIs $100k-200k, 2.4% for AGIs over 200k)
Taxes paid: $8,597 (reported on 47.0% of returns)
45430:
$8,597
State:
$9,568
(% of AGI for various income ranges: 2.5% for AGIs below $25k, 3.6% for AGIs $25k-50k, 4.5% for AGIs $50k-75k, 5.6% for AGIs $75k-100k, 6.7% for AGIs $100k-200k, 6.9% for AGIs over 200k)
Earned income credit: $1,660 (reported on 6.8% of returns)
Here:
$1,660
State:
$2,285
(% of AGI for various income ranges: 2.5% for AGIs below $25k, 0.5% for AGIs $25k-50k)
Percentage of individuals using paid preparers for their 2012 taxes: 38.6%
Here:
39%
State:
51%
(% for various income ranges: 31.4% for AGIs below $25k, 43.3% for AGIs $25k-50k, 43.3% for AGIs $50k-75k, 37.5% for AGIs $75k-100k, 37.1% for AGIs $100k-200k, 57.1% for AGIs over 200k)
Averages for the 2004 tax year for zip code 45430, filed in 2005:
Average Adjusted Gross Income (AGI) in 2004: $58,143 (Individual Income Tax Returns)
Here:
$58,143
State:
$44,480
Salary/wage: $53,627 (reported on 86.5% of returns)
Here:
$53,627
State:
$39,198
(% of AGI for various income ranges: 123.9% for AGIs below $10k, 68.9% for AGIs $10k-25k, 72.5% for AGIs $25k-50k, 80.1% for AGIs $50k-75k, 86.9% for AGIs $75k-100k, 79.1% for AGIs over 100k)
Taxable interest for individuals: $1,232 (reported on 61.9% of returns)
This zip code:
$1,232
Ohio:
$1,532
(% of AGI for various income ranges: 7.2% for AGIs below $10k, 3.1% for AGIs $10k-25k, 1.4% for AGIs $25k-50k, 1.1% for AGIs $50k-75k, 0.8% for AGIs $75k-100k, 1.3% for AGIs over 100k)
Taxable dividends: $1,822 (reported on 37.4% of returns)
Here:
$1,822
State:
$3,496
(% of AGI for various income ranges: 5.3% for AGIs below $10k, 1.9% for AGIs $10k-25k, 0.9% for AGIs $25k-50k, 1.0% for AGIs $50k-75k, 1.3% for AGIs $75k-100k, 1.1% for AGIs over 100k)
Net capital gain/loss: +$2,475 (reported on 28.8% of returns)
Here:
+$2,475
State:
+$8,582
(% of AGI for various income ranges: -1.3% for AGIs below $10k, -0.7% for AGIs $10k-25k, 0.0% for AGIs $25k-50k, 0.7% for AGIs $50k-75k, 0.5% for AGIs $75k-100k, 2.5% for AGIs over 100k)
Profit/loss from business: +$10,383 (reported on 12.4% of returns)
Here:
+$10,383
State:
+$10,813
(% of AGI for various income ranges: -3.3% for AGIs below $10k, 2.6% for AGIs $10k-25k, 3.7% for AGIs $25k-50k, 1.5% for AGIs $50k-75k, 1.1% for AGIs $75k-100k, 2.6% for AGIs over 100k)
IRA payment deduction: $3,079 (reported on 2.5% of returns)
45430:
$3,079
Ohio:
$2,794
(% of AGI for various income ranges: 0.3% for AGIs $10k-25k, 0.2% for AGIs $25k-50k, 0.2% for AGIs $50k-75k, 0.1% for AGIs $75k-100k, 0.1% for AGIs over 100k)
Self-employed pension: $11,500 (reported on 0.8% of returns)
Here:
$11,500
Ohio:
$13,981
Total itemized deductions: $16,970 (19% of AGI, reported on 51.7% of returns)
Here:
$16,970
State:
$17,503
Here:
19.5% of AGI
State:
20.8% of AGI
(% of AGI for various income ranges: 14.4% for AGIs below $10k, 13.2% for AGIs $10k-25k, 14.5% for AGIs $25k-50k, 15.0% for AGIs $50k-75k, 17.0% for AGIs $75k-100k, 14.7% for AGIs over 100k)
Charity contributions deductions: $2,938 (3% of AGI, reported on 45.0% of returns)
Here:
$2,938
State:
$3,087
Here:
3.2% of AGI
State:
3.4% of AGI
(% of AGI for various income ranges: 1.1% for AGIs below $10k, 1.2% for AGIs $10k-25k, 1.8% for AGIs $25k-50k, 2.0% for AGIs $50k-75k, 2.5% for AGIs $75k-100k, 2.6% for AGIs over 100k)
Total tax: $8,357 (reported on 84.8% of returns)
45430:
$8,357
State:
$6,781
(% of AGI for various income ranges: 2.8% for AGIs below $10k, 5.0% for AGIs $10k-25k, 7.7% for AGIs $25k-50k, 9.5% for AGIs $50k-75k, 10.2% for AGIs $75k-100k, 16.7% for AGIs over 100k)
Earned income credit: $1,305 (reported on 4.6% of returns)
Here:
$1,305
State:
$1,696
Percentage of individuals using paid preparers for their 2004 taxes: 41.7%
Here:
42%
State:
55%
(% for various income ranges: 30.7% for AGIs below $10k, 44.6% for AGIs $10k-25k, 50.7% for AGIs $25k-50k, 45.0% for AGIs $50k-75k, 36.2% for AGIs $75k-100k, 38.3% for AGIs over 100k)
Likely homosexual households (counted as self-reported same-sex unmarried-partner households)
Lesbian couples: 0.0% of all households
Gay men: 0.7% of all households
Household received Food Stamps/SNAP in the past 12 months: 142 Household did not receive Food Stamps/SNAP in the past 12 months: 2,898
Women who had a birth in the past 12 months: 112 (99 now married, 15 unmarried) Women who did not have a birth in the past 12 months: 1,017 (470 now married, 546 unmarried)
Housing units in zip code 45430 with a mortgage: 1,576 (210 second mortgage, 189 both second mortgage and home equity loan) Houses without a mortgage: 118
Median monthly owner costs for units with a mortgage: $1,601 Median monthly owner costs for units without a mortgage: $825
Residents with income below the poverty level in 2022:
This zip code:
7.1%
Whole state:
13.4%
Residents with income below 50% of the poverty level in 2022:
This zip code:
4.1%
Whole state:
7.0%
Median number of rooms in houses and condos:
Here:
7.4
State:
6.7
Median number of rooms in apartments:
Here:
4.0
State:
4.4
Notable locations in this zip code not listed on our city pages
In group quarters: 96 (-1 institutionalized population)
Size of family households: 1,211 2-persons, 447 3-persons, 245 4-persons, 199 5-persons, 97 6-persons
Size of nonfamily households: 716 1-person, 108 2-persons, 19 3-persons
1,014 married couples with children.
357 single-parent households (156 men, 201 women).
95.9% of residents of 45430 zip code speak English at home.
1.4% of residents speak other Indo-European language at home (72% very well, 9% well, 19% not at all).
1.9% of residents speak Asian or Pacific Island language at home (61% very well, 37% well, 2% not well).
0.7% of residents speak other language at home (80% very well, 20% well).
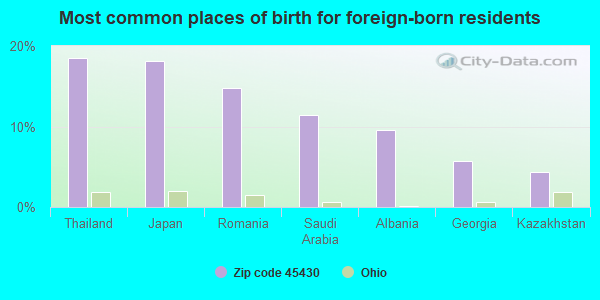
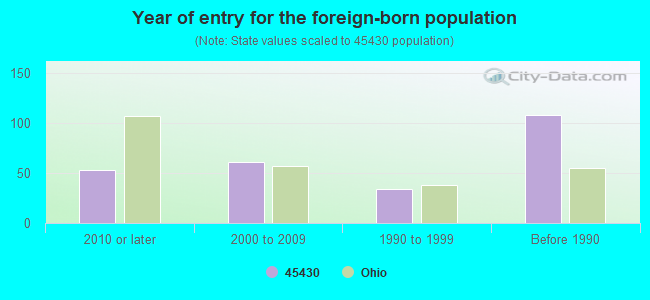
Foreign born population: 211 (3.0%) (72.2% of them are naturalized citizens)
Facilities with environmental interests located in this zip code:
BP OIL CO (3166 SEA JAY DR in DAYTON, OH)
CRITERIA AND HAZARDOUS AIR POLLUTANT INVENTORY (Inventory of air pollution sources) STATE MASTER (Ohio general info) - RCRA-OHD987014172, HAZARDOUS WASTE PROGRAM, AIR MAJOR, -29-5541-1038-3, EPCRA Conditionally Exempt Small Quantity Generators, less than 100 kg/month of hazardous waste (Resource Conservation and Recovery Act (tracking hazardous waste)) - notification Business SIC classification: GASOLINE SERVICE STATIONS Organizations: BP OIL COMPANY (CONTACT/OWNER)
Alternative names: BP AMOCO 09648
BAR-SPLICE (1300 GRANGHALL RD. in BEAVERCREEK, OH)
STATE MASTER (Ohio general info) - RCRA-OHR000011866, HAZARDOUS WASTE PROGRAM Small Quantity Generators, between 100 kg and 1000 kg of hazardous waste/month (Resource Conservation and Recovery Act (tracking hazardous waste)) - notification
ATK SPACE SYSTEMS INC (1400 GRANGE HALL RD in DAYTON, OH)
Small Quantity Generators, between 100 kg and 1000 kg of hazardous waste/month (Resource Conservation and Recovery Act (tracking hazardous waste)) Organizations: BOB PUSKAR (CONTACT/OPERATOR)
, DENNIS WALSTRUM (CONTACT/OPERATOR)
, RICHARD HARDING (CONTACT/OWNER)
Alternative names: ATK MISSION RESEARCH
Housing units lacking complete plumbing facilities: 0.7% Housing units lacking complete kitchen facilities: 1.5%
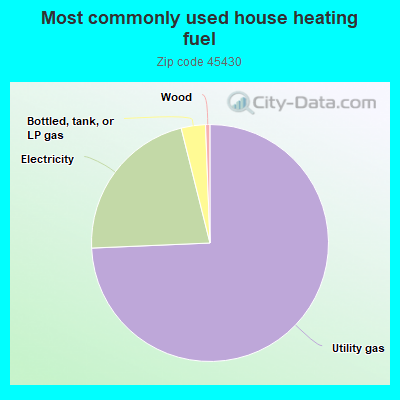
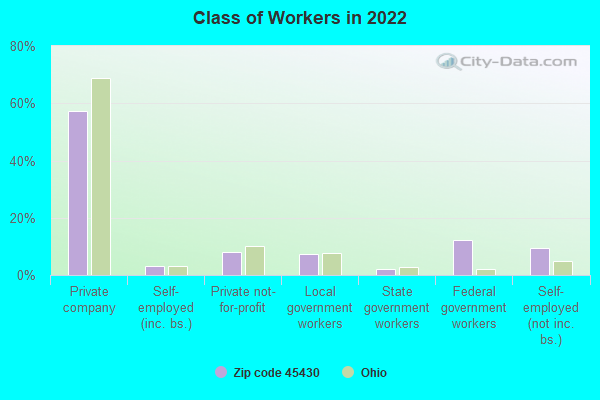
74.1%Utility gas
21.7%Electricity
3.3%Bottled, tank, or LP gas
0.6%Wood
Population in 1990: 6,511. Population change in the 1990s: +571 (+8.8%).
Place of birth for U.S.-born residents:
This state: 4,600
Northeast: 517
Midwest: 485
South: 844
West: 372
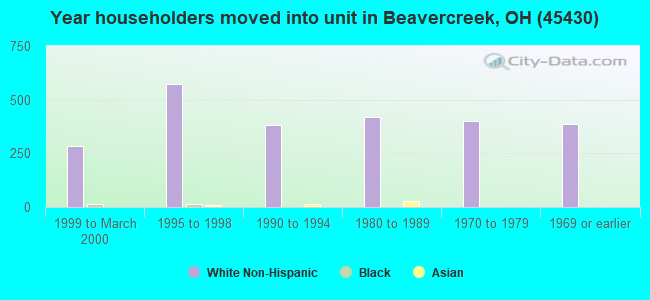
63% of the 45430 zip code residents lived in the same house 5 years ago. Out of people who lived in different houses, 30% lived in this county. Out of people who lived in different counties, 50% lived in Ohio.
92% of the 45430 zip code residents lived in the same house 1 year ago. Out of people who lived in different houses, 42% moved from this county. Out of people who lived in different houses, 21% moved from different county within same state. Out of people who lived in different houses, 38% moved from different state. Out of people who lived in different houses, 3% moved from abroad.
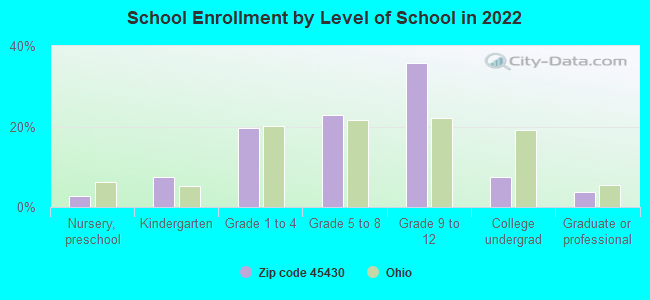
Private vs. public school enrollment:
Students in private schools in grades 1 to 8 (elementary and middle school): 114
Here:
17.4%
Ohio:
16.0%
Students in private schools in grades 9 to 12 (high school): 119
Here:
21.5%
Ohio:
13.1%
Students in private undergraduate colleges: 33
Here:
28.5%
Ohio:
22.3%
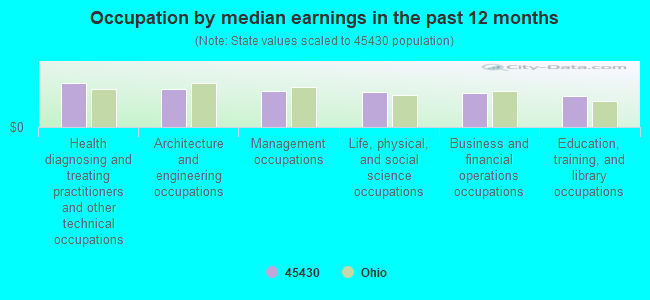
Occupation by median earnings in the past 12 months ($)
110,352Health diagnosing and treating practitioners and other technical occupations
95,837Architecture and engineering occupations
89,547Management occupations
89,101Life, physical, and social science occupations
85,810Business and financial operations occupations
77,177Education, training, and library occupations
Companies with biggest federal contracts located in this zip code:
SIMULATION TECHNOLOGIES INCORP (4027 EXECUTIVE DRIVE in BEAVERCREEK, OH; small business) : $84,923,178 in 227 contractsfrom 1999 to 2006
Contracts for Other Research and Development -- Basic Research (R&D), Mathematical and Computer Sciences -- Basic Research (R&D), Other Professional Services, Other Research and Development -- Management and Support (R&D), and moreby Air Force, Army, Federal Technology Service Signed by year:2000: $14,368,379; 2001: $9,743,295; 2002: $11,414,544; 2003: $12,677,311; 2004: $9,973,565; 2005: $19,157,881; 2006: $6,990,212.
Biggest contracts:
$3,915,920 with Air Force for Other Research and Development -- Basic Research (R&D). Signed on 2005-06-10. Completion date: 2007-09-03.
$3,339,494, same as above.Signed on 2006-07-07. Completion date: 2006-09-30.
$3,052,142, same as above.Signed on 2005-09-13. Completion date: 2007-09-03.
$3,001,543 with Army for Mathematical and Computer Sciences -- Basic Research (R&D). Taking place in VA. Signed on 2005-06-22. Completion date: 2005-10-28.
ALEKTRONICS INC (4095 EXECUTIVE DR in DAYTON, OH; small business) : $11,461,594 in 275 contractsfrom 1999 to 2006
Contracts for Electrical and Electronic assemblies, Boards, Cards, and Associated Hardware, Antennas, Waveguides, and Related Equipment, Fire Control Radar Equipment, except Airborne, Miscellaneous Electrical and Electronic Components, and moreby Defense Logistics Agency, Army Signed by year:2000: $1,958,501; 2001: $1,931,417; 2002: $2,155,025; 2003: $601,588; 2004: $1,803,215; 2005: $1,705,838; 2006: $730,655.
Biggest contracts:
$465,060 with Defense Logistics Agency for Electrical and Electronic assemblies, Boards, Cards, and Associated Hardware. Signed on 2000-09-25. Completion date: 2001-10-20.
$438,750, same as above.Signed on 1999-10-25. Completion date: 2000-11-09.
$379,000 with Defense Logistics Agency for Antennas, Waveguides, and Related Equipment. Signed on 2000-01-26. Completion date: 2000-11-21.
$259,050 with Defense Logistics Agency for Electrical and Electronic assemblies, Boards, Cards, and Associated Hardware. Signed on 2001-10-01. Completion date: 2002-08-11.
WRIGHT MATERIALS RESEARCH CO (1187 RICHFIELD CTR in BEAVERCREEK, OH; small business) : $4,066,041 in 25 contractsfrom 2000 to 2006
Contracts for Defense Aircraft -- Management and Support (R&D), Other Defense -- Applied Research and Exploratory Development (R&D), Other Defense -- Management and Support (R&D), Aeronautics and Space Technology -- Advanced Development (R&D), and moreby Air Force, NASA, Missile Defense Agency, Navy, and others Signed by year:2000: $349,998; 2001: $70,000; 2002: $199,999; 2003: $1,039,251; 2004: $820,000; 2005: $1,216,995; 2006: $369,798.
Biggest contracts:
$867,000 with Air Force for Defense Aircraft -- Management and Support (R&D). Signed on 2005-08-26. Completion date: 2007-03-26.
$450,000 with Air Force for Other Defense -- Applied Research and Exploratory Development (R&D). Signed on 2003-05-27. Completion date: 2004-05-31.
$375,000 with Air Force for Defense Aircraft -- Management and Support (R&D). Signed on 2004-10-28. Completion date: 2006-10-31.
$375,000, same as above.Signed on 2004-04-27. Completion date: 2006-10-31.
ALEK INDUSTRIES, INC (4095 EXECUTIVE DR in DAYTON, OH; small business) : $3,987,718 in 179 contractsfrom 1999 to 2006
Contracts for Engine Cooling System Components, Nonaircraft, Airframe Structural Components, Aircraft Gunnery Fire Control Components, Aircraft Bombing Fire Control Components, and moreby Defense Logistics Agency, Navy, Air Force, Army, and others Signed by year:2000: $458,045; 2001: $336,751; 2002: $489,228; 2003: $269,423; 2004: $800,960; 2005: $1,186,776; 2006: $411,535.
Biggest contracts:
$341,270 with Defense Logistics Agency for Engine Cooling System Components, Nonaircraft. Signed on 2004-02-09. Completion date: 2004-07-11.
$178,357 with Defense Logistics Agency for Airframe Structural Components. Signed on 2005-01-18. Completion date: 2005-05-16.
$144,750 with Defense Logistics Agency for Aircraft Gunnery Fire Control Components. Signed on 2005-09-14. Completion date: 2006-04-22.
$134,550, same as above.Signed on 2002-04-19. Completion date: 2003-01-14.
TAITECH INC (1430 OAK CT STE 301 in DAYTON, OH; small business) : $1,402,011 in 10 contractsin 2000
Contracts for Defense Aircraft -- Applied Research and Exploratory Development (R&D) by Air Force Signed by year:2000: $1,402,011; 2001: $0; 2002: $0; 2003: $0; 2004: $0; 2005: $0; 2006: $0.
Biggest contracts:
$250,000 with Air Force for Defense Aircraft -- Applied Research and Exploratory Development (R&D). Signed on 2000-04-13. Completion date: 2003-06-18.
$250,000, same as above.Signed on 2000-04-13. Completion date: 2003-06-18.
$241,000, same as above.Signed on 2000-04-13. Completion date: 2003-06-18.
$200,000, same as above.Signed on 2000-12-05. Completion date: 2003-06-18.
DIGITAL CONCEPTS INCORPORATED (4080 EXECUTIVE DR STE 201 in DAYTON, OH; small business) : $1,366,647 in 18 contractsfrom 2000 to 2005
Contracts for ADP Systems Analysis Services, Other ADP and Telecommunications Services (includes data storage on tapes, compact disks, etc.) by Defense Logistics Agency, Air Force, Navy Signed by year:2000: $432,935; 2001: $440,927; 2002: $182,052; 2003: $159,819; 2004: $106,882; 2005: $44,032; 2006: $0.
Biggest contracts:
$187,391 with Defense Logistics Agency for ADP Systems Analysis Services. Taking place in VA. Signed on 2001-05-08. Completion date: 2001-12-31.
$130,144 with Air Force for ADP Systems Analysis Services. Signed on 2004-03-31. Completion date: 2005-03-31.
$122,574 with Navy for ADP Systems Analysis Services. Signed on 2000-09-29. Completion date: 2000-10-30.
$120,700 with Air Force for ADP Systems Analysis Services. Signed on 2003-03-31. Completion date: 2004-03-31.
PLANNING RESEARCH CORP (4020 EXECUTIVE DR in DAYTON, OH) : $1,162,464 in 3 contractsfrom 1999 to 2000
$901,847 with Air Force for Other Defense -- Operational Systems Development (R&D). Taking place in NY. Signed on 2000-01-19. Completion date: 2000-02-29.
$233,117, same as above.Signed on 1999-11-19. Completion date: 2000-02-29.
$27,500 with Air Force for Other Defense -- Operational Systems Development (R&D). Signed on 2000-02-29. Completion date: 2000-02-29.
MAINLINE ROAD & BRIDGE CONSTRU (4080 INDUSTRIAL LANE in BEAVERCREEK, OH; small business) : $494,718 in 4 contractsfrom 2000 to 2001
$469,812 with Air Force for Maintenance, Repair or Alteration of Real Property -- Parking Facilities Conservation. Signed on 2000-12-12. Completion date: 2001-06-30.
$13,125, same as above.Signed on 2001-09-21. Completion date: 2001-09-07.
$11,250, same as above.Signed on 2001-03-30. Completion date: 2001-07-27.
$531, same as above.Signed on 2001-07-03. Completion date: 2001-07-13.
FAI ELECTRONICS CORP (1430 OAK CT STE 203 in DAYTON, OH; small business) : $299,765 in 40 contractsfrom 2003 to 2006
Contracts for Microcircuits, Electronic, Semiconductor Devices and Associated Hardware, Switches, Capacitors, and moreby Defense Logistics Agency Signed by year:2000: $0; 2001: $0; 2002: $0; 2003: $57,900; 2004: $129,907; 2005: $105,829; 2006: $6,129.
Biggest contracts:
$57,900 with Defense Logistics Agency for Microcircuits, Electronic. Signed on 2003-11-10. Completion date: 2004-05-28.
$42,386, same as above.Signed on 2004-06-11. Completion date: 2004-12-28.
$26,537, same as above.Signed on 2004-04-20. Completion date: 2004-08-18.
$10,534 with Defense Logistics Agency for Semiconductor Devices and Associated Hardware. Signed on 2004-11-03. Completion date: 2005-05-09.
INTERNATIONAL COMPUTER AND ENG (4060 EXECUTIVE DRIVE in BEAVERCREEK, OH; small business)
$107,003 with Air Force for Automated News Services, Data Services, or Other Information Services. Buying data, the electronic equivalent of books, periodicals, newspapers, etc.. Taking place in AL. Signed on 2000-09-25. Completion date: 2001-09-24.
Top industries in this zip code by the number of employees in 2005:
Professional, Scientific, and Technical Services: Research and Development in the Physical, Engineering, and Life Sciences (100-249: 1, 20-49: 1, 5-9: 1)
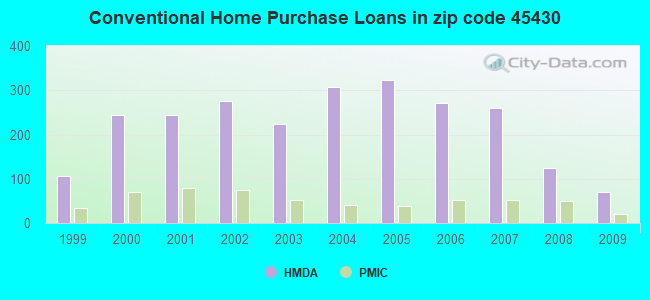
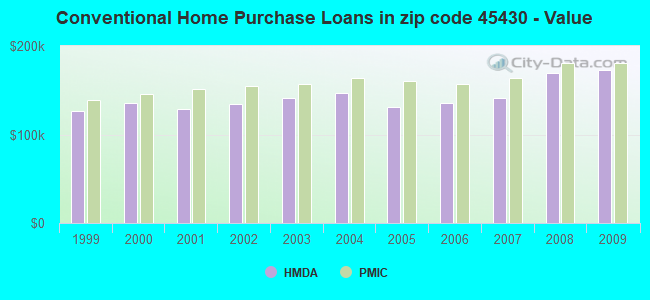
Detailed PMIC statistics for the following Tracts:2103.00
, 2104.00
2002 - 2018 National Fire Incident Reporting System (NFIRS) incidents
According to the data from the years 2002 - 2018 the average number of fires per year is 10. The highest number of reported fire incidents - 20 took place in 2003, and the least - 2 in 2005. The data has a declining trend.
When looking into fire subcategories, the most reports belonged to: Structure Fires (43.7%), and Outside Fires (30.5%).
Fire incident types reported to NFIRS in Zip Code 45430
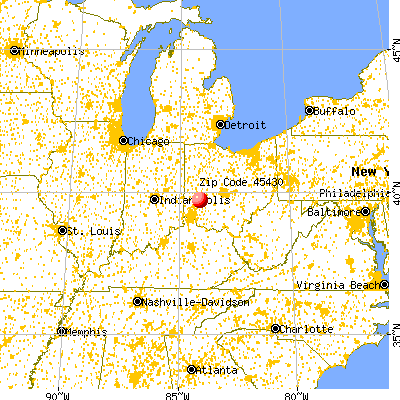


 Nearest zip codes: 45432, 45440, 45420, 45431, 45434, 45301.
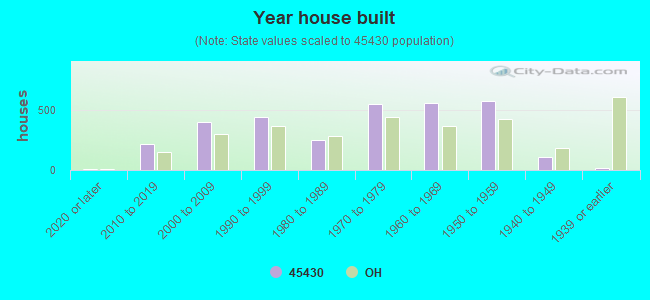


 According to the data from the years 2002 - 2018 the average number of fires per year is 10. The highest number of reported fire incidents - 20 took place in 2003, and the least - 2 in 2005. The data has a declining trend.
 When looking into fire subcategories, the most reports belonged to: Structure Fires (43.7%), and Outside Fires (30.5%).