Estimated zip code population in 2022: 23,562 Zip code population in 2010: 25,438 Zip code population in 2000: 26,448
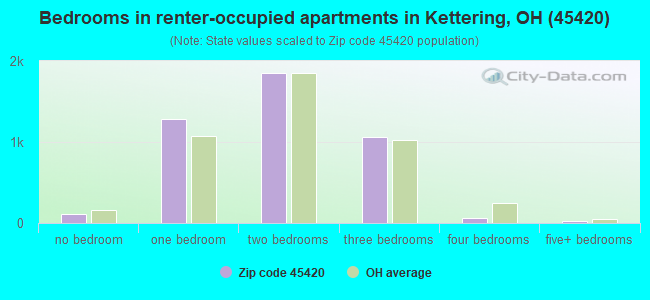
Houses and condos: 12,415 Renter-occupied apartments: 4,396
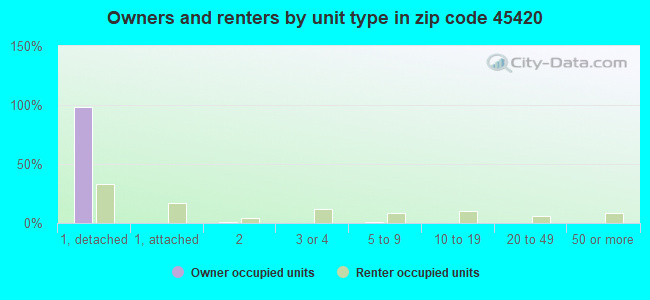
% of renters here:
37%
State:
33%
March 2022 cost of living index in zip code 45420: 93.5 (less than average, U.S. average is 100)
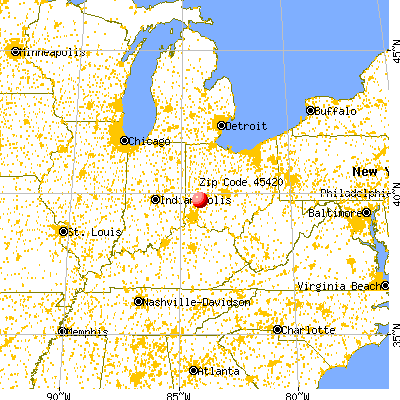
Land area: 6.2 sq. mi. Water area: 0.0 sq. mi.
Population density: 3,807 people per square mile
(average).
OSM Map
General Map
Google Map
MSN Map
OSM Map
General Map
Google Map
MSN Map
OSM Map
General Map
Google Map
MSN Map
OSM Map
General Map
Google Map
MSN Map
Please wait while loading the map...
Real estate property taxes paid for housing units in 2022:
This zip code:
1.9% ($2,221)
Ohio:
1.3% ($2,639)
Median real estate property taxes paid for housing units with mortgages in 2022: $2,358 (1.8%) Median real estate property taxes paid for housing units with no mortgage in 2022: $1,902 (1.8%)
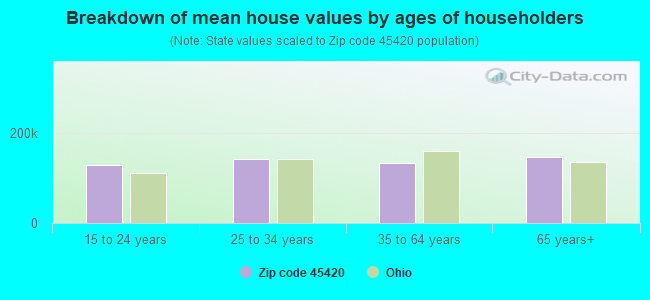
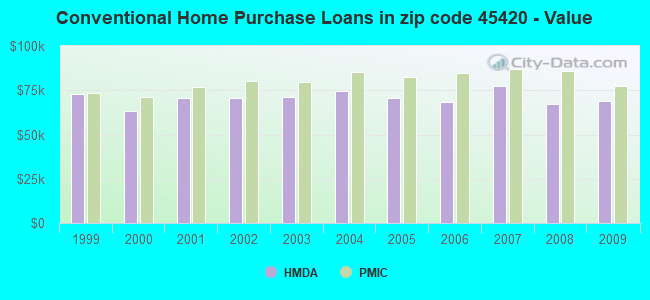
Estimated median house/condo value in 2022: $119,699
45420:
$119,699
Ohio:
$204,100
According to our research of Ohio and other state lists, there were 40 registered sex offenders living in 45420 zip code as of April 26, 2024. The ratio of all residents to sex offenders in zip code 45420 is 633 to 1. The ratio of registered sex offenders to all residents in this zip code is near the state average.
Median resident age:
This zip code:
40.1 years
Ohio median age:
39.9 years
Average household size:
This zip code:
2.0 people
Ohio:
2.4 people
Averages for the 2020 tax year for zip code 45420, filed in 2021:
Average Adjusted Gross Income (AGI) in 2020: $43,175 (Individual Income Tax Returns)
Here:
$43,175
State:
$67,288
Salary/wage: $40,215 (reported on 84.1% of returns)
Here:
$40,215
State:
$55,628
(% of AGI for various income ranges: 1141.4% for AGIs below $25k, 3667.2% for AGIs $25k-50k, 6557.1% for AGIs $50k-75k, 9834.0% for AGIs $75k-100k, 15827.8% for AGIs $100k-200k)
Taxable interest for individuals: $561 (reported on 27.1% of returns)
This zip code:
$561
Ohio:
$1,518
(% of AGI for various income ranges: 8.8% for AGIs below $25k, 11.8% for AGIs $25k-50k, 22.9% for AGIs $50k-75k, 48.3% for AGIs $75k-100k, 81.4% for AGIs $100k-200k)
Ordinary dividends: $2,598 (reported on 11.5% of returns)
Here:
$2,598
State:
$7,167
(% of AGI for various income ranges: 15.6% for AGIs below $25k, 14.5% for AGIs $25k-50k, 39.6% for AGIs $50k-75k, 113.9% for AGIs $75k-100k, 187.6% for AGIs $100k-200k)
Net capital gain/loss in AGI: +$3,593 (reported on 9.7% of returns)
Here:
+$3,593
State:
+$18,919
(% of AGI for various income ranges: 3.7% for AGIs below $25k, 12.7% for AGIs $25k-50k, 41.1% for AGIs $50k-75k, 124.1% for AGIs $75k-100k, 353.4% for AGIs $100k-200k)
Profit/loss from business: +$8,973 (reported on 11.4% of returns)
Here:
+$8,973
State:
+$13,744
(% of AGI for various income ranges: 111.2% for AGIs below $25k, 104.8% for AGIs $25k-50k, 129.9% for AGIs $50k-75k, 225.1% for AGIs $75k-100k, 375.6% for AGIs $100k-200k)
Taxable individual retirement arrangement distribution: $10,210 (reported on 6.5% of returns)
45420:
$10,210
Ohio:
$18,876
(% of AGI for various income ranges: 48.9% for AGIs below $25k, 49.9% for AGIs $25k-50k, 124.9% for AGIs $50k-75k, 147.7% for AGIs $75k-100k, 397.0% for AGIs $100k-200k)
Total itemized deductions: $26,600 (reported on 2.0% of returns)
Here:
$26,600
State:
$33,869
(% of AGI for various income ranges: 21.3% for AGIs below $25k, 41.4% for AGIs $25k-50k, 75.6% for AGIs $50k-75k, 209.9% for AGIs $75k-100k, 394.4% for AGIs $100k-200k)
Charity contributions: $6,116 (reported on 1.5% of returns)
Here:
$6,116
State:
$14,577
(% of AGI for various income ranges: 5.4% for AGIs $25k-50k, 13.7% for AGIs $50k-75k, 29.5% for AGIs $75k-100k, 106.0% for AGIs $100k-200k)
Taxes paid: $6,081 (reported on 2.0% of returns)
45420:
$6,081
State:
$7,681
(% of AGI for various income ranges: 5.7% for AGIs $25k-50k, 17.8% for AGIs $50k-75k, 62.7% for AGIs $75k-100k, 124.8% for AGIs $100k-200k)
Earned income credit: $2,147 (reported on 17.4% of returns)
Here:
$2,147
State:
$2,304
(% of AGI for various income ranges: 88.6% for AGIs below $25k, 51.4% for AGIs $25k-50k, 0.7% for AGIs $50k-75k)
Percentage of individuals using paid preparers for their 2020 taxes: 94.0%
Here:
94%
State:
94%
(% for various income ranges: 92.7% for AGIs below $25k, 94.9% for AGIs $25k-50k, 94.4% for AGIs $50k-75k, 94.4% for AGIs $75k-100k, 93.8% for AGIs $100k-200k, 100.0% for AGIs over 200k)
Averages for the 2012 tax year for zip code 45420, filed in 2013:
Average Adjusted Gross Income (AGI) in 2012: $36,629 (Individual Income Tax Returns)
Here:
$36,629
State:
$54,926
Salary/wage: $34,190 (reported on 84.1% of returns)
Here:
$34,190
State:
$45,869
(% of AGI for various income ranges: 73.5% for AGIs below $25k, 81.0% for AGIs $25k-50k, 81.5% for AGIs $50k-75k, 81.0% for AGIs $75k-100k, 78.4% for AGIs $100k-200k)
Taxable interest for individuals: $629 (reported on 27.8% of returns)
This zip code:
$629
Ohio:
$1,297
(% of AGI for various income ranges: 0.7% for AGIs below $25k, 0.4% for AGIs $25k-50k, 0.4% for AGIs $50k-75k, 0.4% for AGIs $75k-100k, 0.6% for AGIs $100k-200k)
Ordinary dividends: $2,062 (reported on 13.0% of returns)
Here:
$2,062
State:
$5,821
(% of AGI for various income ranges: 0.9% for AGIs below $25k, 0.6% for AGIs $25k-50k, 0.5% for AGIs $50k-75k, 0.8% for AGIs $75k-100k, 1.4% for AGIs $100k-200k)
Net capital gain/loss in AGI: +$2,385 (reported on 8.4% of returns)
Here:
+$2,385
State:
+$11,232
(% of AGI for various income ranges: 0.1% for AGIs $25k-50k, 0.2% for AGIs $50k-75k, 0.6% for AGIs $75k-100k, 3.1% for AGIs $100k-200k)
Profit/loss from business: +$8,974 (reported on 10.7% of returns)
Here:
+$8,974
State:
+$12,773
(% of AGI for various income ranges: 6.4% for AGIs below $25k, 2.2% for AGIs $25k-50k, 1.6% for AGIs $50k-75k, 2.1% for AGIs $75k-100k, 2.0% for AGIs $100k-200k)
Taxable individual retirement arrangement distribution: $9,686 (reported on 8.3% of returns)
45420:
$9,686
Ohio:
$14,511
(% of AGI for various income ranges: 2.9% for AGIs below $25k, 1.6% for AGIs $25k-50k, 1.8% for AGIs $50k-75k, 2.0% for AGIs $75k-100k, 4.1% for AGIs $100k-200k)
Total itemized deductions: $13,462 (22% of AGI, reported on 21.2% of returns)
Here:
$13,462
State:
$21,278
Here:
21.9% of AGI
State:
18.8% of AGI
(% of AGI for various income ranges: 4.8% for AGIs below $25k, 6.5% for AGIs $25k-50k, 8.7% for AGIs $50k-75k, 8.8% for AGIs $75k-100k, 12.6% for AGIs $100k-200k)
Charity contributions: $2,292 (reported on 14.7% of returns)
Here:
$2,292
State:
$3,943
(% of AGI for various income ranges: 0.4% for AGIs below $25k, 0.6% for AGIs $25k-50k, 1.0% for AGIs $50k-75k, 1.3% for AGIs $75k-100k, 2.0% for AGIs $100k-200k)
Taxes paid: $5,197 (reported on 20.9% of returns)
45420:
$5,197
State:
$9,568
(% of AGI for various income ranges: 1.0% for AGIs below $25k, 2.2% for AGIs $25k-50k, 3.6% for AGIs $50k-75k, 3.7% for AGIs $75k-100k, 5.8% for AGIs $100k-200k)
Earned income credit: $2,008 (reported on 19.7% of returns)
Here:
$2,008
State:
$2,285
(% of AGI for various income ranges: 5.3% for AGIs below $25k, 0.8% for AGIs $25k-50k)
Percentage of individuals using paid preparers for their 2012 taxes: 39.4%
Here:
39%
State:
51%
(% for various income ranges: 36.7% for AGIs below $25k, 39.7% for AGIs $25k-50k, 43.6% for AGIs $50k-75k, 43.2% for AGIs $75k-100k, 47.7% for AGIs $100k-200k, 0.0% for AGIs over 200k)
Averages for the 2004 tax year for zip code 45420, filed in 2005:
Average Adjusted Gross Income (AGI) in 2004: $33,287 (Individual Income Tax Returns)
Here:
$33,287
State:
$44,480
Salary/wage: $31,728 (reported on 86.4% of returns)
Here:
$31,728
State:
$39,198
(% of AGI for various income ranges: 128.9% for AGIs below $10k, 74.0% for AGIs $10k-25k, 83.3% for AGIs $25k-50k, 86.2% for AGIs $50k-75k, 85.5% for AGIs $75k-100k, 67.5% for AGIs over 100k)
Taxable interest for individuals: $1,087 (reported on 37.6% of returns)
This zip code:
$1,087
Ohio:
$1,532
(% of AGI for various income ranges: 5.6% for AGIs below $10k, 2.2% for AGIs $10k-25k, 1.1% for AGIs $25k-50k, 0.9% for AGIs $50k-75k, 0.5% for AGIs $75k-100k, 1.6% for AGIs over 100k)
Taxable dividends: $1,419 (reported on 18.0% of returns)
Here:
$1,419
State:
$3,496
(% of AGI for various income ranges: 2.8% for AGIs below $10k, 0.9% for AGIs $10k-25k, 0.6% for AGIs $25k-50k, 0.6% for AGIs $50k-75k, 0.6% for AGIs $75k-100k, 1.6% for AGIs over 100k)
Net capital gain/loss: +$2,232 (reported on 12.2% of returns)
Here:
+$2,232
State:
+$8,582
(% of AGI for various income ranges: -2.8% for AGIs below $10k, 0.2% for AGIs $10k-25k, 0.3% for AGIs $25k-50k, 0.4% for AGIs $50k-75k, 1.1% for AGIs $75k-100k, 5.8% for AGIs over 100k)
Profit/loss from business: +$8,003 (reported on 9.1% of returns)
Here:
+$8,003
State:
+$10,813
(% of AGI for various income ranges: 1.3% for AGIs below $10k, 3.7% for AGIs $10k-25k, 1.7% for AGIs $25k-50k, 1.2% for AGIs $50k-75k, 1.6% for AGIs $75k-100k, 5.8% for AGIs over 100k)
IRA payment deduction: $2,246 (reported on 1.6% of returns)
45420:
$2,246
Ohio:
$2,794
(% of AGI for various income ranges: 0.2% for AGIs $10k-25k, 0.1% for AGIs $25k-50k, 0.1% for AGIs $50k-75k, 0.1% for AGIs $75k-100k)
Self-employed pension: $7,969 (reported on 0.2% of returns)
Here:
$7,969
Ohio:
$13,981
Total itemized deductions: $11,733 (22% of AGI, reported on 30.2% of returns)
Here:
$11,733
State:
$17,503
Here:
22.4% of AGI
State:
20.8% of AGI
(% of AGI for various income ranges: 13.0% for AGIs below $10k, 6.2% for AGIs $10k-25k, 10.2% for AGIs $25k-50k, 11.6% for AGIs $50k-75k, 12.8% for AGIs $75k-100k, 13.4% for AGIs over 100k)
Charity contributions deductions: $1,723 (3% of AGI, reported on 23.1% of returns)
Here:
$1,723
State:
$3,087
Here:
3.1% of AGI
State:
3.4% of AGI
(% of AGI for various income ranges: 0.8% for AGIs below $10k, 0.6% for AGIs $10k-25k, 1.0% for AGIs $25k-50k, 1.3% for AGIs $50k-75k, 1.6% for AGIs $75k-100k, 2.3% for AGIs over 100k)
Total tax: $3,658 (reported on 79.8% of returns)
45420:
$3,658
State:
$6,781
(% of AGI for various income ranges: 3.0% for AGIs below $10k, 4.7% for AGIs $10k-25k, 7.8% for AGIs $25k-50k, 9.5% for AGIs $50k-75k, 10.9% for AGIs $75k-100k, 16.1% for AGIs over 100k)
Earned income credit: $1,455 (reported on 12.4% of returns)
Here:
$1,455
State:
$1,696
Percentage of individuals using paid preparers for their 2004 taxes: 45.2%
Here:
45%
State:
55%
(% for various income ranges: 37.3% for AGIs below $10k, 48.3% for AGIs $10k-25k, 46.4% for AGIs $25k-50k, 44.8% for AGIs $50k-75k, 44.4% for AGIs $75k-100k, 51.9% for AGIs over 100k)
Likely homosexual households (counted as self-reported same-sex unmarried-partner households)
Lesbian couples: 0.0% of all households
Gay men: 0.0% of all households
Household received Food Stamps/SNAP in the past 12 months: 1,342 Household did not receive Food Stamps/SNAP in the past 12 months: 10,442
Women who had a birth in the past 12 months: 424 (208 now married, 212 unmarried) Women who did not have a birth in the past 12 months: 4,738 (1,896 now married, 2,842 unmarried)
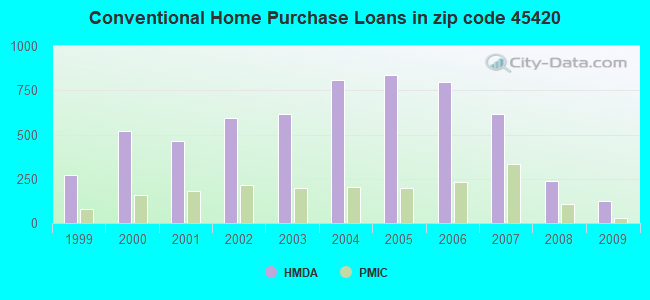
Housing units in zip code 45420 with a mortgage: 4,756 (434 second mortgage, 395 both second mortgage and home equity loan) Houses without a mortgage: 114
Median monthly owner costs for units with a mortgage: $1,024 Median monthly owner costs for units without a mortgage: $428
Residents with income below the poverty level in 2022:
This zip code:
12.8%
Whole state:
13.4%
Residents with income below 50% of the poverty level in 2022:
This zip code:
6.4%
Whole state:
7.0%
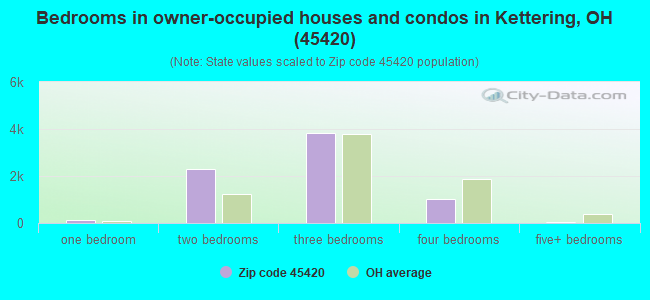
Median number of rooms in houses and condos:
Here:
5.9
State:
6.7
Median number of rooms in apartments:
Here:
4.3
State:
4.4
Notable locations in this zip code not listed on our city pages
Notable locations in zip code 45420: Birchwood Club (A), Dayton State Hospital Farm (B), Belmont Branch Library (C), Dayton Fire Department Company 15 (D), Kettering Fire Department Station 34 (E), Twin Valley Behavioral Healthcare Dayton Campus (F). Display/hide their locations on the map
Shopping Centers: Woodlane Plaza Shopping Center (1), Van Buren Shopping Center (2), Belmont Shopping Center (3), Breitenstrater Square Shopping Center (4), Village Square Shopping Center (5). Display/hide their locations on the map
Churches in zip code 45420 include: Belmont Community Church (A), Belmont United Methodist Church (B), Bible Baptist Church (C), Nordale Avenue Community Church (D), Korean Full Gospel Church of Dayton (E), Wesleyan Evangelistic Church (F), Faith Evangelical Lutheran Church (G), Ohmer Park Church (H), Our Lady of the Immaculate Conception Catholic Church (I). Display/hide their locations on the map
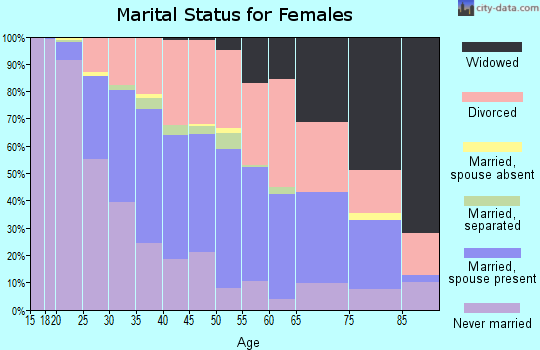
2,239 married couples with children.
1,810 single-parent households (449 men, 1,361 women).
92.5% of residents of 45420 zip code speak English at home.
1.3% of residents speak Spanish at home (53% very well, 22% well, 25% not well).
2.8% of residents speak other Indo-European language at home (66% very well, 32% well, 2% not well).
1.0% of residents speak Asian or Pacific Island language at home (80% very well, 4% well, 16% not well).
2.3% of residents speak other language at home (30% very well, 65% well, 5% not well).
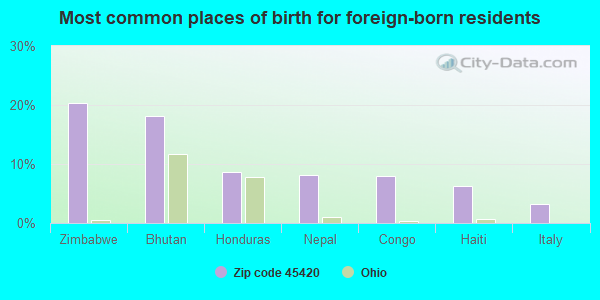
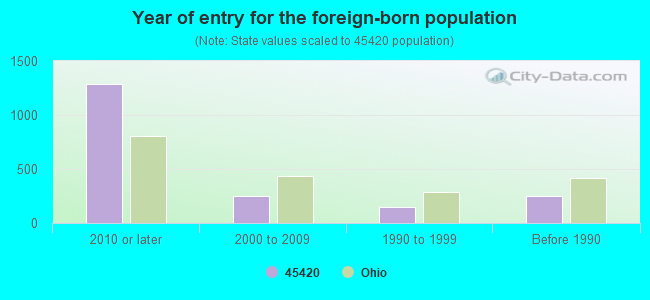
Foreign born population: 1,561 (6.6%) (30.9% of them are naturalized citizens)
Facilities with environmental interests located in this zip code:
BELMONT HIGH SCHOOL (2323 MAPLEVIEW AVE in DAYTON, OH)
(Geographic Names Information System) (National Center for Education Statistics) - STATE ID-002303 STATE MASTER (Ohio general info) - AIR MAJOR Organizations: DAYTON CITY SD (SCHOOL DISTRICT)
BP OIL CO (SMITH AND WILLIAM in DAYTON, OH)
STATE MASTER (Ohio general info) - RCRA-OHD987014149, HAZARDOUS WASTE PROGRAM Conditionally Exempt Small Quantity Generators, less than 100 kg/month of hazardous waste (Resource Conservation and Recovery Act (tracking hazardous waste)) - notification Organizations: BP OIL COMPANY (CONTACT/OWNER)
ASTRONAUT VILLAGE (3063 WOODMAN DR in DAYTON, OH)
(Resource Conservation and Recovery Act (tracking hazardous waste)) Organizations: GIRTON KEVIN (CONTACT/OWNER)
BP OIL CO (3921 WAYNE AVE in DAYTON, OH)
(Resource Conservation and Recovery Act (tracking hazardous waste)) Organizations: BP OIL COMPANY (CONTACT/OWNER)
BP FACILITY #22772 (2361 SMITHVILLE S in DAYTON, OH)
Small Quantity Generators, between 100 kg and 1000 kg of hazardous waste/month (Resource Conservation and Recovery Act (tracking hazardous waste)) Organizations: BP PRODUCTS NORTH AMERICA INC (CONTACT/OPERATOR)
BP AMOCO 09415 (2351 S SMITHVILLE ROAD in DAYTON, OH)
CRITERIA AND HAZARDOUS AIR POLLUTANT INVENTORY (Inventory of air pollution sources) Business SIC classification: GASOLINE SERVICE STATIONS
Housing units lacking complete plumbing facilities: 1.9% Housing units lacking complete kitchen facilities: 2.1%
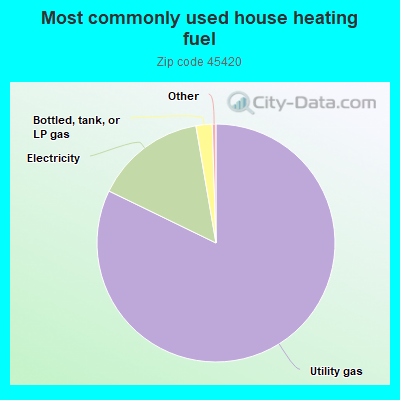
82.2%Utility gas
15.1%Electricity
2.2%Bottled, tank, or LP gas
Population in 1990: 26,955.
Place of birth for U.S.-born residents:
This state: 17,815
Northeast: 860
Midwest: 821
South: 1,552
West: 695
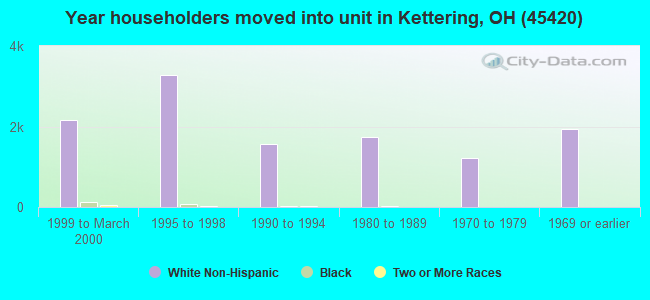
58% of the 45420 zip code residents lived in the same house 5 years ago. Out of people who lived in different houses, 68% lived in this county. Out of people who lived in different counties, 50% lived in Ohio.
88% of the 45420 zip code residents lived in the same house 1 year ago. Out of people who lived in different houses, 64% moved from this county. Out of people who lived in different houses, 15% moved from different county within same state. Out of people who lived in different houses, 14% moved from different state. Out of people who lived in different houses, 5% moved from abroad.
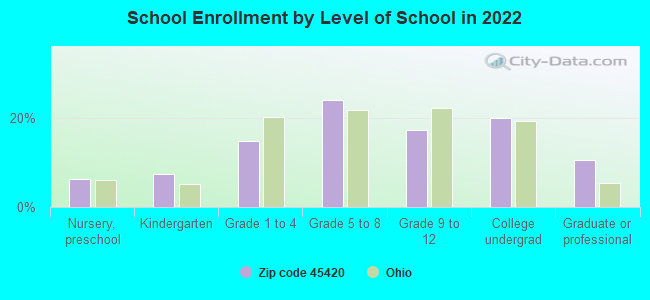
Private vs. public school enrollment:
Students in private schools in grades 1 to 8 (elementary and middle school): 465
Here:
25.4%
Ohio:
16.0%
Students in private schools in grades 9 to 12 (high school): 161
Here:
20.1%
Ohio:
13.1%
Students in private undergraduate colleges: 449
Here:
48.1%
Ohio:
22.3%
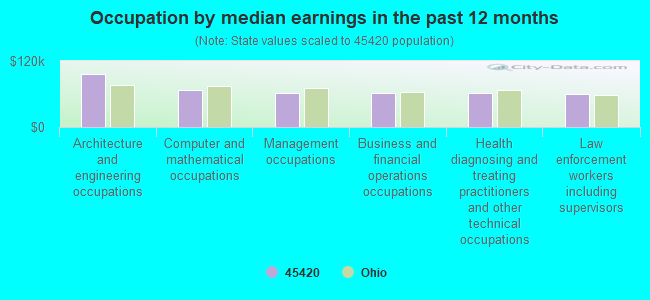
Occupation by median earnings in the past 12 months ($)
96,295Architecture and engineering occupations
67,571Computer and mathematical occupations
61,920Management occupations
61,901Business and financial operations occupations
61,873Health diagnosing and treating practitioners and other technical occupations
60,856Law enforcement workers including supervisors
Companies with biggest federal contracts located in this zip code:
ESE INC (1922 S SMITHVILLE RD in KETTERING, OH; small business) : $4,511,070 in 214 contractsfrom 1999 to 2006
Contracts for Connectors, Electrical, Aircraft Gunnery Fire Control Components, Electronic Modules, Relays and Solenoids, and moreby Defense Logistics Agency, Navy, U.S. Coast Guard Signed by year:2000: $497,381; 2001: $716,761; 2002: $480,639; 2003: $392,508; 2004: $895,763; 2005: $1,087,623; 2006: $269,679.
Biggest contracts:
$103,300 with Defense Logistics Agency for Connectors, Electrical. Signed on 2004-02-06. Completion date: 2004-07-06.
$102,225 with Defense Logistics Agency for Aircraft Gunnery Fire Control Components. Signed on 2000-11-16. Completion date: 2001-08-13.
$99,935 with Defense Logistics Agency for Electronic Modules. Signed on 2001-11-30. Completion date: 2003-05-24.
$99,935, same as above.Signed on 2001-11-27. Completion date: 2003-05-21.
BEARINGPOINT INC (3139 RESEARCH BLVD STE 200 in DAYTON, OH) : $2,631,373 in 11 contractsfrom 2003 to 2004
Contracts for ADP Systems Analysis Services by Air Force Signed by year:2000: $0; 2001: $0; 2002: $0; 2003: $1,278,887; 2004: $1,352,486; 2005: $0; 2006: $0.
Biggest contracts:
$602,135 with Air Force for ADP Systems Analysis Services. Signed on 2004-08-31. Completion date: 2004-12-31.
$497,550, same as above.Signed on 2003-01-31. Completion date: 2004-12-31.
$410,000, same as above.Signed on 2004-02-25. Completion date: 2004-12-31.
$250,000, same as above.Signed on 2004-08-12. Completion date: 2004-12-31.
THE NATIONAL CENTER FOR COMPOS (2000 COMPOSITE DRIVE in KETTERING, OH; small business) : $2,485,294 in 4 contractsfrom 2000 to 2001
$1,599,176 with Air Force for Other Defense -- Applied Research and Exploratory Development (R&D). Signed on 2001-04-06. Completion date: 2001-11-02.
$434,294, same as above.Signed on 2001-12-18. Completion date: 2002-09-03.
$425,000, same as above.Signed on 2000-08-30. Completion date: 2001-11-02.
$26,824, same as above.Signed on 2001-04-23. Completion date: 2002-06-03.
SOUTHWESTERN OHIO COUNCIL FOR (3155 RES BLVD STE 204 in DAYTON, OH) : $1,428,587 in 164 contractsfrom 2001 to 2006
Contracts for Educational Services, Educational Studies and Analyses by Air Force Signed by year:2000: $0; 2001: $26,960; 2002: $189,331; 2003: $318,659; 2004: $134,742; 2005: $390,796; 2006: $368,099.
Biggest contracts:
$104,962 with Air Force for Educational Services. Signed on 2003-09-11. Completion date: 2004-08-31.
$79,860, same as above.Signed on 2002-08-29. Completion date: 2003-08-29.
$69,971, same as above.Signed on 2006-05-02. Completion date: 2006-12-31.
$49,788, same as above.Signed on 2006-01-27. Completion date: 2006-12-31.
LEWIS & MICHAEL INC (1827 WOODMAN DR in DAYTON, OH; small business) : $976,988 in 11 contractsfrom 2001 to 2006
Contracts for ADP Facility Operation and Maintenance Services, Other ADP and Telecommunications Services (includes data storage on tapes, compact disks, etc.), Packing/Crating Services by Department of Defense, Defense Information Systems Agency, Army Signed by year:2000: $0; 2001: $286,430; 2002: $191,573; 2003: $194,850; 2004: $81,825; 2005: $195,310; 2006: $27,000.
Biggest contracts:
$286,430 with Department of Defense for ADP Facility Operation and Maintenance Services. Signed on 2001-07-16. Completion date: 2002-07-15.
$194,850, same as above.Signed on 2003-06-25. Completion date: 2004-07-14.
$127,918, same as above.Signed on 2005-01-18. Completion date: 2005-09-30.
$98,543, same as above.Signed on 2002-07-16. Completion date: 2002-11-15.
LJB INC (3100 RESEARCH BLVD in DAYTON, OH) : $480,873 in 6 contractsfrom 2003 to 2006
Contracts for Architect - Engineer Services (including landscaping, interior layout, and designing) by Air Force Signed by year:2000: $0; 2001: $0; 2002: $0; 2003: $449,064; 2004: $2,193; 2005: $0; 2006: $29,616.
Biggest contracts:
$237,758 with Air Force for Architect - Engineer Services (including landscaping, interior layout, and designing). Signed on 2003-09-19. Completion date: 2004-01-20.
$105,787, same as above.Signed on 2003-12-15. Completion date: 2004-03-22.
$93,097, same as above.Signed on 2003-09-19. Completion date: 2004-01-20.
$29,616, same as above.Signed on 2006-03-02. Completion date: 2006-05-12.
FOPAT LLC (3155 RESEARCH BLVD STE 101 in DAYTON, OH; small business) : $474,992 in 2 contractsfrom 2005 to 2006
$375,000 with Air Force for Defense Aircraft -- Management and Support (R&D). Signed on 2006-05-08. Completion date: 2008-09-08.
$99,992, same as above.Signed on 2005-03-29. Completion date: 2006-01-06.
FOREMOST SEAFOOD LLC (1904 WOODMEN CENTER DR in DAYTON, OH; small business) : $134,466 in 9 contractsfrom 2004 to 2006
Contracts for Meat, Poultry, and Fish by Defense Commissary Agency Signed by year:2000: $0; 2001: $0; 2002: $0; 2003: $0; 2004: $35,562; 2005: $77,215; 2006: $21,689.
Biggest contracts:
$35,562 with Defense Commissary Agency for Meat, Poultry, and Fish. Signed on 2004-10-01. Completion date: 2005-03-31.
$22,048, same as above.Signed on 2005-04-01. Completion date: 2005-06-30.
$19,027, same as above.Signed on 2005-10-01. Completion date: 2005-11-30.
$15,573, same as above.Signed on 2006-03-01. Completion date: 2006-03-31.
TRIANGLE PRECISION INDUSTRIES (1650 in KETTERING, OH; small business) : $48,906 in 3 contractsfrom 2003 to 2006
$30,587 with Air Force for Miscellaneous Power Transmission Equipment. Signed on 2003-03-26. Completion date: 2003-07-02.
$14,590 with Air Force for Laboratory Equipment and Supplies. Signed on 2006-01-04. Completion date: 2006-02-10.
$3,729 with Defense Logistics Agency for Stimulated Coherent Radiation Devices, Components and Accessories. Signed on 2006-03-29. Completion date: 2006-04-28.
TAMA KARATE INSTITUTE INC (1753 WOODMAN DR in DAYTON, OH; small business)
$45,000 with Air Force for Other Education and Training Services. Taking place in UT. Signed on 2004-07-08. Completion date: 2004-08-09.
Top industries in this zip code by the number of employees in 2005:
2003 - 2018 National Fire Incident Reporting System (NFIRS) incidents
According to the data from the years 2003 - 2018 the average number of fires per year is 61. The highest number of reported fire incidents - 110 took place in 2009, and the least - 23 in 2013. The data has a declining trend.
When looking into fire subcategories, the most reports belonged to: Outside Fires (39.0%), and Structure Fires (34.6%).
Fire incident types reported to NFIRS in Zip Code 45420


 Nearest zip codes: 45419, 45410, 45430, 45429, 45432, 45403.
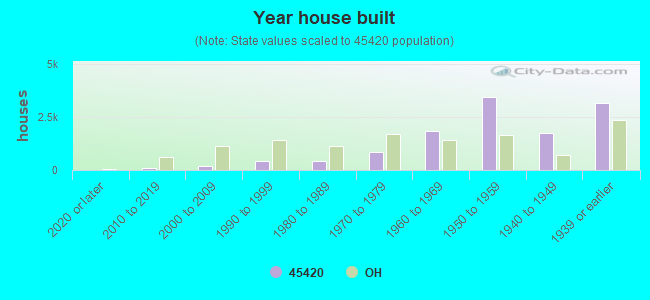


 According to the data from the years 2003 - 2018 the average number of fires per year is 61. The highest number of reported fire incidents - 110 took place in 2009, and the least - 23 in 2013. The data has a declining trend.
 When looking into fire subcategories, the most reports belonged to: Outside Fires (39.0%), and Structure Fires (34.6%).