Estimated zip code population in 2022: 17,317
Zip code population in 2010: 15,339
Zip code population in 2000: 17,646
Houses and condos: 8,022
Renter-occupied apartments: 3,613
% of renters here:
50%State:
33%
March 2022 cost of living index in zip code 45410: 93.5
(less than average, U.S. average is 100)
Land area: 2.2
sq. mi.
Water area: 0.0
sq. mi.
Population density: 7,768 people per square mile (high).
OSM Map
General Map
Google Map
MSN Map
OSM Map
General Map
Google Map
MSN Map
OSM Map
General Map
Google Map
MSN Map
OSM Map
General Map
Google Map
MSN Map
Please wait while loading the map...
Real estate property taxes paid for housing units in 2022:
This zip code:
1.7% ($1,636)Ohio:
1.3% ($2,639)
Median real estate property taxes paid for housing units with mortgages in 2022: $1,727 (1.6%)
Median real estate property taxes paid for housing units with no mortgage in 2022: $1,527 (1.9%)
Profiles of local businesses
Business Search - 14 Million verified businesses
Males: 9,375 Females: 7,943
For population 25 years and over in 45410:
High school or higher: 83.7%Bachelor's degree or higher: 20.9%Graduate or professional degree: 6.9%Unemployed: 5.5%Mean travel time to work (commute): 21.3 minutes
For population 15 years and over in 45410:
Never married: 50.3%Now married: 32.2%Separated: 1.6%Widowed: 4.3%Divorced: 11.7%
Zip code 45410 compared to state average:
Median household income below state average. Median house value below state average. Hispanic race population percentage above state average. Median age significantly below state average. Renting percentage above state average. House age above state average. Percentage of population with a bachelor's degree or higher below state average. 12,049 69.6% White 2,426 14.0% Black 1,542 8.9% Hispanic or Latino 1,019 5.9% Two or more races 216 1.2% Asian 62 0.4% American Indian
Data:
Median household income ($)
Median household income (% change since 2000)
Household income diversity
Ratio of average income to average house value (%)
Ratio of average income to average rent
Median household income ($) - White
Median household income ($) - Black or African American
Median household income ($) - Asian
Median household income ($) - Hispanic or Latino
Median household income ($) - American Indian and Alaska Native
Median household income ($) - Multirace
Median household income ($) - Other Race
Median household income for houses/condos with a mortgage ($)
Median household income for apartments without a mortgage ($)
Races - White alone (%)
Races - White alone (% change since 2000)
Races - Black alone (%)
Races - Black alone (% change since 2000)
Races - American Indian alone (%)
Races - American Indian alone (% change since 2000)
Races - Asian alone (%)
Races - Asian alone (% change since 2000)
Races - Hispanic (%)
Races - Hispanic (% change since 2000)
Races - Native Hawaiian and Other Pacific Islander alone (%)
Races - Native Hawaiian and Other Pacific Islander alone (% change since 2000)
Races - Two or more races (%)
Races - Two or more races (% change since 2000)
Races - Other race alone (%)
Races - Other race alone (% change since 2000)
Racial diversity
Unemployment (%)
Unemployment (% change since 2000)
Unemployment (%) - White
Unemployment (%) - Black or African American
Unemployment (%) - Asian
Unemployment (%) - Hispanic or Latino
Unemployment (%) - American Indian and Alaska Native
Unemployment (%) - Multirace
Unemployment (%) - Other Race
Population density (people per square mile)
Population - Males (%)
Population - Females (%)
Population - Males (%) - White
Population - Males (%) - Black or African American
Population - Males (%) - Asian
Population - Males (%) - Hispanic or Latino
Population - Males (%) - American Indian and Alaska Native
Population - Males (%) - Multirace
Population - Males (%) - Other Race
Population - Females (%) - White
Population - Females (%) - Black or African American
Population - Females (%) - Asian
Population - Females (%) - Hispanic or Latino
Population - Females (%) - American Indian and Alaska Native
Population - Females (%) - Multirace
Population - Females (%) - Other Race
Coronavirus confirmed cases (Apr 27, 2024)
Deaths caused by coronavirus (Apr 27, 2024)
Coronavirus confirmed cases (per 100k population) (Apr 27, 2024)
Deaths caused by coronavirus (per 100k population) (Apr 27, 2024)
Daily increase in number of cases (Apr 27, 2024)
Weekly increase in number of cases (Apr 27, 2024)
Cases doubled (in days) (Apr 27, 2024)
Hospitalized patients (Apr 18, 2022)
Negative test results (Apr 18, 2022)
Total test results (Apr 18, 2022)
COVID Vaccine doses distributed (per 100k population) (Sep 19, 2023)
COVID Vaccine doses administered (per 100k population) (Sep 19, 2023)
COVID Vaccine doses distributed (Sep 19, 2023)
COVID Vaccine doses administered (Sep 19, 2023)
Likely homosexual households (%)
Likely homosexual households (% change since 2000)
Likely homosexual households - Lesbian couples (%)
Likely homosexual households - Lesbian couples (% change since 2000)
Likely homosexual households - Gay men (%)
Likely homosexual households - Gay men (% change since 2000)
Cost of living index
Median gross rent ($)
Median contract rent ($)
Median monthly housing costs ($)
Median house or condo value ($)
Median house or condo value ($ change since 2000)
Mean house or condo value by units in structure - 1, detached ($)
Mean house or condo value by units in structure - 1, attached ($)
Mean house or condo value by units in structure - 2 ($)
Mean house or condo value by units in structure by units in structure - 3 or 4 ($)
Mean house or condo value by units in structure - 5 or more ($)
Mean house or condo value by units in structure - Boat, RV, van, etc. ($)
Mean house or condo value by units in structure - Mobile home ($)
Median house or condo value ($) - White
Median house or condo value ($) - Black or African American
Median house or condo value ($) - Asian
Median house or condo value ($) - Hispanic or Latino
Median house or condo value ($) - American Indian and Alaska Native
Median house or condo value ($) - Multirace
Median house or condo value ($) - Other Race
Median resident age
Resident age diversity
Median resident age - Males
Median resident age - Females
Median resident age - White
Median resident age - Black or African American
Median resident age - Asian
Median resident age - Hispanic or Latino
Median resident age - American Indian and Alaska Native
Median resident age - Multirace
Median resident age - Other Race
Median resident age - Males - White
Median resident age - Males - Black or African American
Median resident age - Males - Asian
Median resident age - Males - Hispanic or Latino
Median resident age - Males - American Indian and Alaska Native
Median resident age - Males - Multirace
Median resident age - Males - Other Race
Median resident age - Females - White
Median resident age - Females - Black or African American
Median resident age - Females - Asian
Median resident age - Females - Hispanic or Latino
Median resident age - Females - American Indian and Alaska Native
Median resident age - Females - Multirace
Median resident age - Females - Other Race
Commute - mean travel time to work (minutes)
Travel time to work - Less than 5 minutes (%)
Travel time to work - Less than 5 minutes (% change since 2000)
Travel time to work - 5 to 9 minutes (%)
Travel time to work - 5 to 9 minutes (% change since 2000)
Travel time to work - 10 to 19 minutes (%)
Travel time to work - 10 to 19 minutes (% change since 2000)
Travel time to work - 20 to 29 minutes (%)
Travel time to work - 20 to 29 minutes (% change since 2000)
Travel time to work - 30 to 39 minutes (%)
Travel time to work - 30 to 39 minutes (% change since 2000)
Travel time to work - 40 to 59 minutes (%)
Travel time to work - 40 to 59 minutes (% change since 2000)
Travel time to work - 60 to 89 minutes (%)
Travel time to work - 60 to 89 minutes (% change since 2000)
Travel time to work - 90 or more minutes (%)
Travel time to work - 90 or more minutes (% change since 2000)
Marital status - Never married (%)
Marital status - Now married (%)
Marital status - Separated (%)
Marital status - Widowed (%)
Marital status - Divorced (%)
Median family income ($)
Median family income (% change since 2000)
Median non-family income ($)
Median non-family income (% change since 2000)
Median per capita income ($)
Median per capita income (% change since 2000)
Median family income ($) - White
Median family income ($) - Black or African American
Median family income ($) - Asian
Median family income ($) - Hispanic or Latino
Median family income ($) - American Indian and Alaska Native
Median family income ($) - Multirace
Median family income ($) - Other Race
Median year house/condo built
Median year apartment built
Year house built - Built 2005 or later (%)
Year house built - Built 2000 to 2004 (%)
Year house built - Built 1990 to 1999 (%)
Year house built - Built 1980 to 1989 (%)
Year house built - Built 1970 to 1979 (%)
Year house built - Built 1960 to 1969 (%)
Year house built - Built 1950 to 1959 (%)
Year house built - Built 1940 to 1949 (%)
Year house built - Built 1939 or earlier (%)
Average household size
Household density (households per square mile)
Average household size - White
Average household size - Black or African American
Average household size - Asian
Average household size - Hispanic or Latino
Average household size - American Indian and Alaska Native
Average household size - Multirace
Average household size - Other Race
Occupied housing units (%)
Vacant housing units (%)
Owner occupied housing units (%)
Renter occupied housing units (%)
Vacancy status - For rent (%)
Vacancy status - For sale only (%)
Vacancy status - Rented or sold, not occupied (%)
Vacancy status - For seasonal, recreational, or occasional use (%)
Vacancy status - For migrant workers (%)
Vacancy status - Other vacant (%)
Residents with income below the poverty level (%)
Residents with income below 50% of the poverty level (%)
Children below poverty level (%)
Poor families by family type - Married-couple family (%)
Poor families by family type - Male, no wife present (%)
Poor families by family type - Female, no husband present (%)
Poverty status for native-born residents (%)
Poverty status for foreign-born residents (%)
Poverty among high school graduates not in families (%)
Poverty among people who did not graduate high school not in families (%)
Residents with income below the poverty level (%) - White
Residents with income below the poverty level (%) - Black or African American
Residents with income below the poverty level (%) - Asian
Residents with income below the poverty level (%) - Hispanic or Latino
Residents with income below the poverty level (%) - American Indian and Alaska Native
Residents with income below the poverty level (%) - Multirace
Residents with income below the poverty level (%) - Other Race
Air pollution - Air Quality Index (AQI)
Air pollution - CO
Air pollution - NO2
Air pollution - SO2
Air pollution - Ozone
Air pollution - PM10
Air pollution - PM25
Air pollution - Pb
Crime - Murders per 100,000 population
Crime - Rapes per 100,000 population
Crime - Robberies per 100,000 population
Crime - Assaults per 100,000 population
Crime - Burglaries per 100,000 population
Crime - Thefts per 100,000 population
Crime - Auto thefts per 100,000 population
Crime - Arson per 100,000 population
Crime - City-data.com crime index
Crime - Violent crime index
Crime - Property crime index
Crime - Murders per 100,000 population (5 year average)
Crime - Rapes per 100,000 population (5 year average)
Crime - Robberies per 100,000 population (5 year average)
Crime - Assaults per 100,000 population (5 year average)
Crime - Burglaries per 100,000 population (5 year average)
Crime - Thefts per 100,000 population (5 year average)
Crime - Auto thefts per 100,000 population (5 year average)
Crime - Arson per 100,000 population (5 year average)
Crime - City-data.com crime index (5 year average)
Crime - Violent crime index (5 year average)
Crime - Property crime index (5 year average)
1996 Presidential Elections Results (%) - Democratic Party (Clinton)
1996 Presidential Elections Results (%) - Republican Party (Dole)
1996 Presidential Elections Results (%) - Other
2000 Presidential Elections Results (%) - Democratic Party (Gore)
2000 Presidential Elections Results (%) - Republican Party (Bush)
2000 Presidential Elections Results (%) - Other
2004 Presidential Elections Results (%) - Democratic Party (Kerry)
2004 Presidential Elections Results (%) - Republican Party (Bush)
2004 Presidential Elections Results (%) - Other
2008 Presidential Elections Results (%) - Democratic Party (Obama)
2008 Presidential Elections Results (%) - Republican Party (McCain)
2008 Presidential Elections Results (%) - Other
2012 Presidential Elections Results (%) - Democratic Party (Obama)
2012 Presidential Elections Results (%) - Republican Party (Romney)
2012 Presidential Elections Results (%) - Other
2016 Presidential Elections Results (%) - Democratic Party (Clinton)
2016 Presidential Elections Results (%) - Republican Party (Trump)
2016 Presidential Elections Results (%) - Other
2020 Presidential Elections Results (%) - Democratic Party (Biden)
2020 Presidential Elections Results (%) - Republican Party (Trump)
2020 Presidential Elections Results (%) - Other
Ancestries Reported - Arab (%)
Ancestries Reported - Czech (%)
Ancestries Reported - Danish (%)
Ancestries Reported - Dutch (%)
Ancestries Reported - English (%)
Ancestries Reported - French (%)
Ancestries Reported - French Canadian (%)
Ancestries Reported - German (%)
Ancestries Reported - Greek (%)
Ancestries Reported - Hungarian (%)
Ancestries Reported - Irish (%)
Ancestries Reported - Italian (%)
Ancestries Reported - Lithuanian (%)
Ancestries Reported - Norwegian (%)
Ancestries Reported - Polish (%)
Ancestries Reported - Portuguese (%)
Ancestries Reported - Russian (%)
Ancestries Reported - Scotch-Irish (%)
Ancestries Reported - Scottish (%)
Ancestries Reported - Slovak (%)
Ancestries Reported - Subsaharan African (%)
Ancestries Reported - Swedish (%)
Ancestries Reported - Swiss (%)
Ancestries Reported - Ukrainian (%)
Ancestries Reported - United States (%)
Ancestries Reported - Welsh (%)
Ancestries Reported - West Indian (%)
Ancestries Reported - Other (%)
Educational Attainment - No schooling completed (%)
Educational Attainment - Less than high school (%)
Educational Attainment - High school or equivalent (%)
Educational Attainment - Less than 1 year of college (%)
Educational Attainment - 1 or more years of college (%)
Educational Attainment - Associate degree (%)
Educational Attainment - Bachelor's degree (%)
Educational Attainment - Master's degree (%)
Educational Attainment - Professional school degree (%)
Educational Attainment - Doctorate degree (%)
School Enrollment - Nursery, preschool (%)
School Enrollment - Kindergarten (%)
School Enrollment - Grade 1 to 4 (%)
School Enrollment - Grade 5 to 8 (%)
School Enrollment - Grade 9 to 12 (%)
School Enrollment - College undergrad (%)
School Enrollment - Graduate or professional (%)
School Enrollment - Not enrolled in school (%)
School enrollment - Public schools (%)
School enrollment - Private schools (%)
School enrollment - Not enrolled (%)
Median number of rooms in houses and condos
Median number of rooms in apartments
Housing units lacking complete plumbing facilities (%)
Housing units lacking complete kitchen facilities (%)
Density of houses
Urban houses (%)
Rural houses (%)
Households with people 60 years and over (%)
Households with people 65 years and over (%)
Households with people 75 years and over (%)
Households with one or more nonrelatives (%)
Households with no nonrelatives (%)
Population in households (%)
Family households (%)
Nonfamily households (%)
Population in families (%)
Family households with own children (%)
Median number of bedrooms in owner occupied houses
Mean number of bedrooms in owner occupied houses
Median number of bedrooms in renter occupied houses
Mean number of bedrooms in renter occupied houses
Median number of vehichles in owner occupied houses
Mean number of vehichles in owner occupied houses
Median number of vehichles in renter occupied houses
Mean number of vehichles in renter occupied houses
Mortgage status - with mortgage (%)
Mortgage status - with second mortgage (%)
Mortgage status - with home equity loan (%)
Mortgage status - with both second mortgage and home equity loan (%)
Mortgage status - without a mortgage (%)
Average family size
Average family size - White
Average family size - Black or African American
Average family size - Asian
Average family size - Hispanic or Latino
Average family size - American Indian and Alaska Native
Average family size - Multirace
Average family size - Other Race
Geographical mobility - Same house 1 year ago (%)
Geographical mobility - Moved within same county (%)
Geographical mobility - Moved from different county within same state (%)
Geographical mobility - Moved from different state (%)
Geographical mobility - Moved from abroad (%)
Place of birth - Born in state of residence (%)
Place of birth - Born in other state (%)
Place of birth - Native, outside of US (%)
Place of birth - Foreign born (%)
Housing units in structures - 1, detached (%)
Housing units in structures - 1, attached (%)
Housing units in structures - 2 (%)
Housing units in structures - 3 or 4 (%)
Housing units in structures - 5 to 9 (%)
Housing units in structures - 10 to 19 (%)
Housing units in structures - 20 to 49 (%)
Housing units in structures - 50 or more (%)
Housing units in structures - Mobile home (%)
Housing units in structures - Boat, RV, van, etc. (%)
House/condo owner moved in on average (years ago)
Renter moved in on average (years ago)
Year householder moved into unit - Moved in 1999 to March 2000 (%)
Year householder moved into unit - Moved in 1995 to 1998 (%)
Year householder moved into unit - Moved in 1990 to 1994 (%)
Year householder moved into unit - Moved in 1980 to 1989 (%)
Year householder moved into unit - Moved in 1970 to 1979 (%)
Year householder moved into unit - Moved in 1969 or earlier (%)
Means of transportation to work - Drove car alone (%)
Means of transportation to work - Carpooled (%)
Means of transportation to work - Public transportation (%)
Means of transportation to work - Bus or trolley bus (%)
Means of transportation to work - Streetcar or trolley car (%)
Means of transportation to work - Subway or elevated (%)
Means of transportation to work - Railroad (%)
Means of transportation to work - Ferryboat (%)
Means of transportation to work - Taxicab (%)
Means of transportation to work - Motorcycle (%)
Means of transportation to work - Bicycle (%)
Means of transportation to work - Walked (%)
Means of transportation to work - Other means (%)
Working at home (%)
Industry diversity
Most Common Industries - Agriculture, forestry, fishing and hunting, and mining (%)
Most Common Industries - Agriculture, forestry, fishing and hunting (%)
Most Common Industries - Mining, quarrying, and oil and gas extraction (%)
Most Common Industries - Construction (%)
Most Common Industries - Manufacturing (%)
Most Common Industries - Wholesale trade (%)
Most Common Industries - Retail trade (%)
Most Common Industries - Transportation and warehousing, and utilities (%)
Most Common Industries - Transportation and warehousing (%)
Most Common Industries - Utilities (%)
Most Common Industries - Information (%)
Most Common Industries - Finance and insurance, and real estate and rental and leasing (%)
Most Common Industries - Finance and insurance (%)
Most Common Industries - Real estate and rental and leasing (%)
Most Common Industries - Professional, scientific, and management, and administrative and waste management services (%)
Most Common Industries - Professional, scientific, and technical services (%)
Most Common Industries - Management of companies and enterprises (%)
Most Common Industries - Administrative and support and waste management services (%)
Most Common Industries - Educational services, and health care and social assistance (%)
Most Common Industries - Educational services (%)
Most Common Industries - Health care and social assistance (%)
Most Common Industries - Arts, entertainment, and recreation, and accommodation and food services (%)
Most Common Industries - Arts, entertainment, and recreation (%)
Most Common Industries - Accommodation and food services (%)
Most Common Industries - Other services, except public administration (%)
Most Common Industries - Public administration (%)
Occupation diversity
Most Common Occupations - Management, business, science, and arts occupations (%)
Most Common Occupations - Management, business, and financial occupations (%)
Most Common Occupations - Management occupations (%)
Most Common Occupations - Business and financial operations occupations (%)
Most Common Occupations - Computer, engineering, and science occupations (%)
Most Common Occupations - Computer and mathematical occupations (%)
Most Common Occupations - Architecture and engineering occupations (%)
Most Common Occupations - Life, physical, and social science occupations (%)
Most Common Occupations - Education, legal, community service, arts, and media occupations (%)
Most Common Occupations - Community and social service occupations (%)
Most Common Occupations - Legal occupations (%)
Most Common Occupations - Education, training, and library occupations (%)
Most Common Occupations - Arts, design, entertainment, sports, and media occupations (%)
Most Common Occupations - Healthcare practitioners and technical occupations (%)
Most Common Occupations - Health diagnosing and treating practitioners and other technical occupations (%)
Most Common Occupations - Health technologists and technicians (%)
Most Common Occupations - Service occupations (%)
Most Common Occupations - Healthcare support occupations (%)
Most Common Occupations - Protective service occupations (%)
Most Common Occupations - Fire fighting and prevention, and other protective service workers including supervisors (%)
Most Common Occupations - Law enforcement workers including supervisors (%)
Most Common Occupations - Food preparation and serving related occupations (%)
Most Common Occupations - Building and grounds cleaning and maintenance occupations (%)
Most Common Occupations - Personal care and service occupations (%)
Most Common Occupations - Sales and office occupations (%)
Most Common Occupations - Sales and related occupations (%)
Most Common Occupations - Office and administrative support occupations (%)
Most Common Occupations - Natural resources, construction, and maintenance occupations (%)
Most Common Occupations - Farming, fishing, and forestry occupations (%)
Most Common Occupations - Construction and extraction occupations (%)
Most Common Occupations - Installation, maintenance, and repair occupations (%)
Most Common Occupations - Production, transportation, and material moving occupations (%)
Most Common Occupations - Production occupations (%)
Most Common Occupations - Transportation occupations (%)
Most Common Occupations - Material moving occupations (%)
People in Group quarters - Institutionalized population (%)
People in Group quarters - Correctional institutions (%)
People in Group quarters - Federal prisons and detention centers (%)
People in Group quarters - Halfway houses (%)
People in Group quarters - Local jails and other confinement facilities (including police lockups) (%)
People in Group quarters - Military disciplinary barracks (%)
People in Group quarters - State prisons (%)
People in Group quarters - Other types of correctional institutions (%)
People in Group quarters - Nursing homes (%)
People in Group quarters - Hospitals/wards, hospices, and schools for the handicapped (%)
People in Group quarters - Hospitals/wards and hospices for chronically ill (%)
People in Group quarters - Hospices or homes for chronically ill (%)
People in Group quarters - Military hospitals or wards for chronically ill (%)
People in Group quarters - Other hospitals or wards for chronically ill (%)
People in Group quarters - Hospitals or wards for drug/alcohol abuse (%)
People in Group quarters - Mental (Psychiatric) hospitals or wards (%)
People in Group quarters - Schools, hospitals, or wards for the mentally retarded (%)
People in Group quarters - Schools, hospitals, or wards for the physically handicapped (%)
People in Group quarters - Institutions for the deaf (%)
People in Group quarters - Institutions for the blind (%)
People in Group quarters - Orthopedic wards and institutions for the physically handicapped (%)
People in Group quarters - Wards in general hospitals for patients who have no usual home elsewhere (%)
People in Group quarters - Wards in military hospitals for patients who have no usual home elsewhere (%)
People in Group quarters - Juvenile institutions (%)
People in Group quarters - Long-term care (%)
People in Group quarters - Homes for abused, dependent, and neglected children (%)
People in Group quarters - Residential treatment centers for emotionally disturbed children (%)
People in Group quarters - Training schools for juvenile delinquents (%)
People in Group quarters - Short-term care, detention or diagnostic centers for delinquent children (%)
People in Group quarters - Type of juvenile institution unknown (%)
People in Group quarters - Noninstitutionalized population (%)
People in Group quarters - College dormitories (includes college quarters off campus) (%)
People in Group quarters - Military quarters (%)
People in Group quarters - On base (%)
People in Group quarters - Barracks, unaccompanied personnel housing (UPH), (Enlisted/Officer), ;and similar group living quarters for military personnel (%)
People in Group quarters - Transient quarters for temporary residents (%)
People in Group quarters - Military ships (%)
People in Group quarters - Group homes (%)
People in Group quarters - Homes or halfway houses for drug/alcohol abuse (%)
People in Group quarters - Homes for the mentally ill (%)
People in Group quarters - Homes for the mentally retarded (%)
People in Group quarters - Homes for the physically handicapped (%)
People in Group quarters - Other group homes (%)
People in Group quarters - Religious group quarters (%)
People in Group quarters - Dormitories (%)
People in Group quarters - Agriculture workers' dormitories on farms (%)
People in Group quarters - Job Corps and vocational training facilities (%)
People in Group quarters - Other workers' dormitories (%)
People in Group quarters - Crews of maritime vessels (%)
People in Group quarters - Other nonhousehold living situations (%)
People in Group quarters - Other noninstitutional group quarters (%)
Residents speaking English at home (%)
Residents speaking English at home - Born in the United States (%)
Residents speaking English at home - Native, born elsewhere (%)
Residents speaking English at home - Foreign born (%)
Residents speaking Spanish at home (%)
Residents speaking Spanish at home - Born in the United States (%)
Residents speaking Spanish at home - Native, born elsewhere (%)
Residents speaking Spanish at home - Foreign born (%)
Residents speaking other language at home (%)
Residents speaking other language at home - Born in the United States (%)
Residents speaking other language at home - Native, born elsewhere (%)
Residents speaking other language at home - Foreign born (%)
Class of Workers - Employee of private company (%)
Class of Workers - Self-employed in own incorporated business (%)
Class of Workers - Private not-for-profit wage and salary workers (%)
Class of Workers - Local government workers (%)
Class of Workers - State government workers (%)
Class of Workers - Federal government workers (%)
Class of Workers - Self-employed workers in own not incorporated business and Unpaid family workers (%)
House heating fuel used in houses and condos - Utility gas (%)
House heating fuel used in houses and condos - Bottled, tank, or LP gas (%)
House heating fuel used in houses and condos - Electricity (%)
House heating fuel used in houses and condos - Fuel oil, kerosene, etc. (%)
House heating fuel used in houses and condos - Coal or coke (%)
House heating fuel used in houses and condos - Wood (%)
House heating fuel used in houses and condos - Solar energy (%)
House heating fuel used in houses and condos - Other fuel (%)
House heating fuel used in houses and condos - No fuel used (%)
House heating fuel used in apartments - Utility gas (%)
House heating fuel used in apartments - Bottled, tank, or LP gas (%)
House heating fuel used in apartments - Electricity (%)
House heating fuel used in apartments - Fuel oil, kerosene, etc. (%)
House heating fuel used in apartments - Coal or coke (%)
House heating fuel used in apartments - Wood (%)
House heating fuel used in apartments - Solar energy (%)
House heating fuel used in apartments - Other fuel (%)
House heating fuel used in apartments - No fuel used (%)
Armed forces status - In Armed Forces (%)
Armed forces status - Civilian (%)
Armed forces status - Civilian - Veteran (%)
Armed forces status - Civilian - Nonveteran (%)
Fatal accidents locations in years 2005-2021
Fatal accidents locations in 2005
Fatal accidents locations in 2006
Fatal accidents locations in 2007
Fatal accidents locations in 2008
Fatal accidents locations in 2009
Fatal accidents locations in 2010
Fatal accidents locations in 2011
Fatal accidents locations in 2012
Fatal accidents locations in 2013
Fatal accidents locations in 2014
Fatal accidents locations in 2015
Fatal accidents locations in 2016
Fatal accidents locations in 2017
Fatal accidents locations in 2018
Fatal accidents locations in 2019
Fatal accidents locations in 2020
Fatal accidents locations in 2021
Alcohol use - People drinking some alcohol every month (%)
Alcohol use - People not drinking at all (%)
Alcohol use - Average days/month drinking alcohol
Alcohol use - Average drinks/week
Alcohol use - Average days/year people drink much
Audiometry - Average condition of hearing (%)
Audiometry - People that can hear a whisper from across a quiet room (%)
Audiometry - People that can hear normal voice from across a quiet room (%)
Audiometry - Ears ringing, roaring, buzzing (%)
Audiometry - Had a job exposure to loud noise (%)
Audiometry - Had off-work exposure to loud noise (%)
Blood Pressure & Cholesterol - Has high blood pressure (%)
Blood Pressure & Cholesterol - Checking blood pressure at home (%)
Blood Pressure & Cholesterol - Frequently checking blood cholesterol (%)
Blood Pressure & Cholesterol - Has high cholesterol level (%)
Consumer Behavior - Money monthly spent on food at supermarket/grocery store
Consumer Behavior - Money monthly spent on food at other stores
Consumer Behavior - Money monthly spent on eating out
Consumer Behavior - Money monthly spent on carryout/delivered foods
Consumer Behavior - Income spent on food at supermarket/grocery store (%)
Consumer Behavior - Income spent on food at other stores (%)
Consumer Behavior - Income spent on eating out (%)
Consumer Behavior - Income spent on carryout/delivered foods (%)
Current Health Status - General health condition (%)
Current Health Status - Blood donors (%)
Current Health Status - Has blood ever tested for HIV virus (%)
Current Health Status - Left-handed people (%)
Dermatology - People using sunscreen (%)
Diabetes - Diabetics (%)
Diabetes - Had a blood test for high blood sugar (%)
Diabetes - People taking insulin (%)
Diet Behavior & Nutrition - Diet health (%)
Diet Behavior & Nutrition - Milk product consumption (# of products/month)
Diet Behavior & Nutrition - Meals not home prepared (#/week)
Diet Behavior & Nutrition - Meals from fast food or pizza place (#/week)
Diet Behavior & Nutrition - Ready-to-eat foods (#/month)
Diet Behavior & Nutrition - Frozen meals/pizza (#/month)
Drug Use - People that ever used marijuana or hashish (%)
Drug Use - Ever used hard drugs (%)
Drug Use - Ever used any form of cocaine (%)
Drug Use - Ever used heroin (%)
Drug Use - Ever used methamphetamine (%)
Health Insurance - People covered by health insurance (%)
Kidney Conditions-Urology - Avg. # of times urinating at night
Medical Conditions - People with asthma (%)
Medical Conditions - People with anemia (%)
Medical Conditions - People with psoriasis (%)
Medical Conditions - People with overweight (%)
Medical Conditions - Elderly people having difficulties in thinking or remembering (%)
Medical Conditions - People who ever received blood transfusion (%)
Medical Conditions - People having trouble seeing even with glass/contacts (%)
Medical Conditions - People with arthritis (%)
Medical Conditions - People with gout (%)
Medical Conditions - People with congestive heart failure (%)
Medical Conditions - People with coronary heart disease (%)
Medical Conditions - People with angina pectoris (%)
Medical Conditions - People who ever had heart attack (%)
Medical Conditions - People who ever had stroke (%)
Medical Conditions - People with emphysema (%)
Medical Conditions - People with thyroid problem (%)
Medical Conditions - People with chronic bronchitis (%)
Medical Conditions - People with any liver condition (%)
Medical Conditions - People who ever had cancer or malignancy (%)
Mental Health - People who have little interest in doing things (%)
Mental Health - People feeling down, depressed, or hopeless (%)
Mental Health - People who have trouble sleeping or sleeping too much (%)
Mental Health - People feeling tired or having little energy (%)
Mental Health - People with poor appetite or overeating (%)
Mental Health - People feeling bad about themself (%)
Mental Health - People who have trouble concentrating on things (%)
Mental Health - People moving or speaking slowly or too fast (%)
Mental Health - People having thoughts they would be better off dead (%)
Oral Health - Average years since last visit a dentist
Oral Health - People embarrassed because of mouth (%)
Oral Health - People with gum disease (%)
Oral Health - General health of teeth and gums (%)
Oral Health - Average days a week using dental floss/device
Oral Health - Average days a week using mouthwash for dental problem
Oral Health - Average number of teeth
Pesticide Use - Households using pesticides to control insects (%)
Pesticide Use - Households using pesticides to kill weeds (%)
Physical Activity - People doing vigorous-intensity work activities (%)
Physical Activity - People doing moderate-intensity work activities (%)
Physical Activity - People walking or bicycling (%)
Physical Activity - People doing vigorous-intensity recreational activities (%)
Physical Activity - People doing moderate-intensity recreational activities (%)
Physical Activity - Average hours a day doing sedentary activities
Physical Activity - Average hours a day watching TV or videos
Physical Activity - Average hours a day using computer
Physical Functioning - People having limitations keeping them from working (%)
Physical Functioning - People limited in amount of work they can do (%)
Physical Functioning - People that need special equipment to walk (%)
Physical Functioning - People experiencing confusion/memory problems (%)
Physical Functioning - People requiring special healthcare equipment (%)
Prescription Medications - Average number of prescription medicines taking
Preventive Aspirin Use - Adults 40+ taking low-dose aspirin (%)
Reproductive Health - Vaginal deliveries (%)
Reproductive Health - Cesarean deliveries (%)
Reproductive Health - Deliveries resulted in a live birth (%)
Reproductive Health - Pregnancies resulted in a delivery (%)
Reproductive Health - Women breastfeeding newborns (%)
Reproductive Health - Women that had a hysterectomy (%)
Reproductive Health - Women that had both ovaries removed (%)
Reproductive Health - Women that have ever taken birth control pills (%)
Reproductive Health - Women taking birth control pills (%)
Reproductive Health - Women that have ever used Depo-Provera or injectables (%)
Reproductive Health - Women that have ever used female hormones (%)
Sexual Behavior - People 18+ that ever had sex (vaginal, anal, or oral) (%)
Sexual Behavior - Males 18+ that ever had vaginal sex with a woman (%)
Sexual Behavior - Males 18+ that ever performed oral sex on a woman (%)
Sexual Behavior - Males 18+ that ever had anal sex with a woman (%)
Sexual Behavior - Males 18+ that ever had any sex with a man (%)
Sexual Behavior - Females 18+ that ever had vaginal sex with a man (%)
Sexual Behavior - Females 18+ that ever performed oral sex on a man (%)
Sexual Behavior - Females 18+ that ever had anal sex with a man (%)
Sexual Behavior - Females 18+ that ever had any kind of sex with a woman (%)
Sexual Behavior - Average age people first had sex
Sexual Behavior - Average number of female sex partners in lifetime (males 18+)
Sexual Behavior - Average number of female vaginal sex partners in lifetime (males 18+)
Sexual Behavior - Average age people first performed oral sex on a woman (18+)
Sexual Behavior - Average number of woman performed oral sex on in lifetime (18+)
Sexual Behavior - Average number of male sex partners in lifetime (males 18+)
Sexual Behavior - Average number of male anal sex partners in lifetime (males 18+)
Sexual Behavior - Average age people first performed oral sex on a man (18+)
Sexual Behavior - Average number of male oral sex partners in lifetime (18+)
Sexual Behavior - People using protection when performing oral sex (%)
Sexual Behavior - Average number of times people have vaginal or anal sex a year
Sexual Behavior - People having sex without condom (%)
Sexual Behavior - Average number of male sex partners in lifetime (females 18+)
Sexual Behavior - Average number of male vaginal sex partners in lifetime (females 18+)
Sexual Behavior - Average number of female sex partners in lifetime (females 18+)
Sexual Behavior - Circumcised males 18+ (%)
Sleep Disorders - Average hours sleeping at night
Sleep Disorders - People that has trouble sleeping (%)
Smoking-Cigarette Use - People smoking cigarettes (%)
Taste & Smell - People 40+ having problems with smell (%)
Taste & Smell - People 40+ having problems with taste (%)
Taste & Smell - People 40+ that ever had wisdom teeth removed (%)
Taste & Smell - People 40+ that ever had tonsils teeth removed (%)
Taste & Smell - People 40+ that ever had a loss of consciousness because of a head injury (%)
Taste & Smell - People 40+ that ever had a broken nose or other serious injury to face or skull (%)
Taste & Smell - People 40+ that ever had two or more sinus infections (%)
Weight - Average height (inches)
Weight - Average weight (pounds)
Weight - Average BMI
Weight - People that are obese (%)
Weight - People that ever were obese (%)
Weight - People trying to lose weight (%)
100%
urban population.
Estimated median house/condo value in 2022: $94,979
45410:
$94,979Ohio:
$204,100
Median resident age: This zip code:
31.5 yearsOhio median age:
39.9 years
Average household size: This zip code:
2.4 peopleOhio:
2.4 people
Averages for the 2020 tax year for zip code 45410, filed in 2021:
Average Adjusted Gross Income (AGI) in 2020: $37,186 (Individual Income Tax Returns) Here:
$37,186State:
$67,288
Salary/wage: $34,503 (reported on 86.2% of returns )Here:
$34,503State:
$55,628
(% of AGI for various income ranges: 1184.9% for AGIs below $25k , 3630.4% for AGIs $25k-50k , 6792.4% for AGIs $50k-75k , 10650.4% for AGIs $75k-100k , 17573.3% for AGIs $100k-200k ) Taxable interest for individuals: $322 (reported on 18.6% of returns )This zip code:
$322Ohio:
$1,518
(% of AGI for various income ranges: 6.3% for AGIs below $25k , 4.0% for AGIs $25k-50k , 9.1% for AGIs $50k-75k , 18.4% for AGIs $75k-100k , 46.7% for AGIs $100k-200k ) Ordinary dividends: $1,881 (reported on 7.5% of returns )(% of AGI for various income ranges: 5.1% for AGIs below $25k , 4.8% for AGIs $25k-50k , 16.1% for AGIs $50k-75k , 77.2% for AGIs $75k-100k , 184.7% for AGIs $100k-200k ) Net capital gain/loss in AGI: +$5,551 (reported on 6.8% of returns )Here:
+$5,551State:
+$18,919
(% of AGI for various income ranges: 4.5% for AGIs below $25k , 11.6% for AGIs $25k-50k , 66.9% for AGIs $50k-75k , 111.6% for AGIs $75k-100k , 1018.0% for AGIs $100k-200k ) Profit/loss from business: +$9,355 (reported on 13.4% of returns )Here:
+$9,355State:
+$13,744
(% of AGI for various income ranges: 132.3% for AGIs below $25k , 133.3% for AGIs $25k-50k , 210.7% for AGIs $50k-75k , 266.4% for AGIs $75k-100k , 532.7% for AGIs $100k-200k ) Taxable individual retirement arrangement distribution: $10,790 (reported on 4.2% of returns )45410:
$10,790Ohio:
$18,876
(% of AGI for various income ranges: 22.3% for AGIs below $25k , 30.1% for AGIs $25k-50k , 108.6% for AGIs $50k-75k , 170.4% for AGIs $75k-100k , 547.3% for AGIs $100k-200k ) Total itemized deductions: $21,889 (reported on 1.3% of returns )Here:
$21,889State:
$33,869
(% of AGI for various income ranges: 21.2% for AGIs below $25k , 103.4% for AGIs $50k-75k , 498.0% for AGIs $100k-200k ) Charity contributions: $10,280 (reported on 0.7% of returns )Here:
$10,280State:
$14,577
(% of AGI for various income ranges: 35.0% for AGIs $50k-75k , 179.3% for AGIs $100k-200k ) Taxes paid: $6,475 (reported on 1.2% of returns )(% of AGI for various income ranges: 2.1% for AGIs below $25k , 27.3% for AGIs $50k-75k , 184.7% for AGIs $100k-200k ) Earned income credit: $2,423 (reported on 27.2% of returns )(% of AGI for various income ranges: 128.0% for AGIs below $25k , 78.3% for AGIs $25k-50k , 2.1% for AGIs $50k-75k ) Percentage of individuals using paid preparers for their 2020 taxes: 94.1%(% for various income ranges: 94.2% for AGIs below $25k , 95.0% for AGIs $25k-50k , 93.6% for AGIs $50k-75k , 92.1% for AGIs $75k-100k , 92.6% for AGIs $100k-200k , 75.0% for AGIs over 200k )
Averages for the 2012 tax year for zip code 45410, filed in 2013:
Average Adjusted Gross Income (AGI) in 2012: $31,237 (Individual Income Tax Returns) Here:
$31,237State:
$54,926
Salary/wage: $29,265 (reported on 86.8% of returns )Here:
$29,265State:
$45,869
(% of AGI for various income ranges: 78.1% for AGIs below $25k , 85.2% for AGIs $25k-50k , 85.0% for AGIs $50k-75k , 85.3% for AGIs $75k-100k , 66.3% for AGIs $100k-200k ) Taxable interest for individuals: $475 (reported on 18.9% of returns )This zip code:
$475Ohio:
$1,297
(% of AGI for various income ranges: 0.4% for AGIs below $25k , 0.2% for AGIs $25k-50k , 0.2% for AGIs $50k-75k , 0.1% for AGIs $75k-100k , 0.6% for AGIs $100k-200k ) Ordinary dividends: $2,276 (reported on 8.5% of returns )(% of AGI for various income ranges: 0.6% for AGIs below $25k , 0.3% for AGIs $25k-50k , 0.7% for AGIs $50k-75k , 1.2% for AGIs $75k-100k , 0.8% for AGIs $100k-200k ) Net capital gain/loss in AGI: +$1,718 (reported on 5.3% of returns )Here:
+$1,718State:
+$11,232
(% of AGI for various income ranges: 0.4% for AGIs $50k-75k , 0.2% for AGIs $75k-100k , 1.6% for AGIs $100k-200k ) Profit/loss from business: +$8,991 (reported on 12.7% of returns )Here:
+$8,991State:
+$12,773
(% of AGI for various income ranges: 9.3% for AGIs below $25k , 2.8% for AGIs $25k-50k , 1.2% for AGIs $50k-75k , 1.4% for AGIs $75k-100k , 2.0% for AGIs $100k-200k ) Taxable individual retirement arrangement distribution: $9,415 (reported on 5.1% of returns )(% of AGI for various income ranges: 1.3% for AGIs below $25k , 1.2% for AGIs $25k-50k , 1.2% for AGIs $50k-75k , 2.0% for AGIs $75k-100k , 3.2% for AGIs $100k-200k ) Total itemized deductions: $13,448 (21% of AGI, reported on 13.4% of returns )Here:
$13,448State:
$21,278
Here:
21.2% of AGIState:
18.8% of AGI
(% of AGI for various income ranges: 2.8% for AGIs below $25k , 5.1% for AGIs $25k-50k , 6.1% for AGIs $50k-75k , 8.0% for AGIs $75k-100k , 10.2% for AGIs $100k-200k ) Charity contributions: $2,442 (reported on 8.9% of returns )(% of AGI for various income ranges: 0.1% for AGIs below $25k , 0.5% for AGIs $25k-50k , 0.8% for AGIs $50k-75k , 1.3% for AGIs $75k-100k , 1.6% for AGIs $100k-200k ) Taxes paid: $5,069 (reported on 13.2% of returns )(% of AGI for various income ranges: 0.5% for AGIs below $25k , 1.7% for AGIs $25k-50k , 2.3% for AGIs $50k-75k , 3.2% for AGIs $75k-100k , 5.0% for AGIs $100k-200k ) Earned income credit: $2,455 (reported on 29.3% of returns )(% of AGI for various income ranges: 8.8% for AGIs below $25k , 1.0% for AGIs $25k-50k ) Percentage of individuals using paid preparers for their 2012 taxes: 39.4%(% for various income ranges: 38.6% for AGIs below $25k , 38.9% for AGIs $25k-50k , 43.3% for AGIs $50k-75k , 41.9% for AGIs $75k-100k , 43.8% for AGIs $100k-200k )
Averages for the 2004 tax year for zip code 45410, filed in 2005:
Average Adjusted Gross Income (AGI) in 2004: $28,299 (Individual Income Tax Returns) Here:
$28,299State:
$44,480
Salary/wage: $27,107 (reported on 90.1% of returns )Here:
$27,107State:
$39,198
(% of AGI for various income ranges: 89.6% for AGIs below $10k , 84.0% for AGIs $10k-25k , 88.5% for AGIs $25k-50k , 86.9% for AGIs $50k-75k , 87.7% for AGIs $75k-100k , 73.6% for AGIs over 100k ) Taxable interest for individuals: $821 (reported on 25.7% of returns )This zip code:
$821Ohio:
$1,532
(% of AGI for various income ranges: 1.8% for AGIs below $10k , 1.1% for AGIs $10k-25k , 0.6% for AGIs $25k-50k , 0.5% for AGIs $50k-75k , 0.7% for AGIs $75k-100k , 0.7% for AGIs over 100k ) Taxable dividends: $1,430 (reported on 11.4% of returns )(% of AGI for various income ranges: 1.1% for AGIs below $10k , 0.6% for AGIs $10k-25k , 0.3% for AGIs $25k-50k , 0.5% for AGIs $50k-75k , 0.5% for AGIs $75k-100k , 2.4% for AGIs over 100k ) Net capital gain/loss: +$1,986 (reported on 7.3% of returns )Here:
+$1,986State:
+$8,582
(% of AGI for various income ranges: -0.2% for AGIs below $10k , -0.2% for AGIs $10k-25k , 0.1% for AGIs $25k-50k , 0.6% for AGIs $50k-75k , 1.3% for AGIs $75k-100k , 5.0% for AGIs over 100k ) Profit/loss from business: +$6,810 (reported on 8.9% of returns )Here:
+$6,810State:
+$10,813
(% of AGI for various income ranges: 5.3% for AGIs below $10k , 3.4% for AGIs $10k-25k , 1.5% for AGIs $25k-50k , 2.4% for AGIs $50k-75k , 1.2% for AGIs $75k-100k , 0.3% for AGIs over 100k ) IRA payment deduction: $2,229 (reported on 1.2% of returns )Total itemized deductions: $11,109 (23% of AGI, reported on 22.4% of returns )Here:
$11,109State:
$17,503
Here:
22.6% of AGIState:
20.8% of AGI
(% of AGI for various income ranges: 5.6% for AGIs below $10k , 4.3% for AGIs $10k-25k , 8.6% for AGIs $25k-50k , 10.8% for AGIs $50k-75k , 13.2% for AGIs $75k-100k , 13.1% for AGIs over 100k ) Charity contributions deductions: $1,644 (3% of AGI, reported on 16.1% of returns )Here:
3.1% of AGIState:
3.4% of AGI
(% of AGI for various income ranges: 0.2% for AGIs below $10k , 0.5% for AGIs $10k-25k , 0.8% for AGIs $25k-50k , 1.2% for AGIs $50k-75k , 1.5% for AGIs $75k-100k , 2.0% for AGIs over 100k ) Total tax: $3,150 (reported on 71.8% of returns )(% of AGI for various income ranges: 1.7% for AGIs below $10k , 4.3% for AGIs $10k-25k , 7.5% for AGIs $25k-50k , 9.9% for AGIs $50k-75k , 11.4% for AGIs $75k-100k , 15.4% for AGIs over 100k ) Earned income credit: $1,750 (reported on 21.4% of returns )Percentage of individuals using paid preparers for their 2004 taxes: 46.1%(% for various income ranges: 41.9% for AGIs below $10k , 48.6% for AGIs $10k-25k , 46.5% for AGIs $25k-50k , 45.4% for AGIs $50k-75k , 41.0% for AGIs $75k-100k , 60.0% for AGIs over 100k )
Estimated median household income in 2022: This zip code:
$43,798Ohio:
$65,720
Nearest zip codes: 45403 ,
45419 ,
45409 ,
45420 ,
45404 ,
45402 .
Riverside Zip Code Map
Percentage of family households: This zip code:
42.5%Ohio:
43.3%
Percentage of households with unmarried partners: This zip code:
12.9%Ohio:
44.6%
Likely homosexual households (counted as self-reported same-sex unmarried-partner households)
Lesbian couples: 0.2% of all households Gay men: 0.1% of all households
Household received Food Stamps/SNAP in the past 12 months: 1,733Household did not receive Food Stamps/SNAP in the past 12 months: 5,548
Women who had a birth in the past 12 months: 539 (91 now married , 432 unmarried) Women who did not have a birth in the past 12 months: 3,804 (1,204 now married , 2,601 unmarried)
Housing units in zip code 45410 with a mortgage: 1,971 (108
second mortgage , 76
both second mortgage and home equity loan )
Houses without a mortgage: 48
Median monthly owner costs for units with a mortgage: $947
Median monthly owner costs for units without a mortgage: $445
Residents with income below the poverty level in 2022:
This zip code:
26.4%Whole state:
13.4%
Residents with income below 50% of the poverty level in 2022:
This zip code:
16.0%Whole state:
7.0%
Median number of rooms in houses and condos: Median number of rooms in apartments: Notable locations in this zip code not listed on our city pages
Click to draw/clear zip code borders Notable locations in zip code 45410: (A) , Jaycee Towers (B) . Display/hide their locations on the map
Shopping Center: (1) . Display/hide its location on the map
Churches in zip code 45410 include: (A) , Church of Christ of East Dayton (B) , Voice of Pentecost Church of God (C) , The Chapel in Ohmer Park (D) , Saint Anthonys Roman Catholic Church (E) , Hope Lutheran Church (F) , Haynes Street Church of Christ (G) , Grace Church of the Nazarene (H) , First United Church of Christ (I) . Display/hide their locations on the map
Parks in zip code 45410 include: (1) , South Park Historic District (2) , Highland Park (3) , Burns-Jackson Park (4) , Ruskin Playground (5) . Display/hide their locations on the map
Tourist attractions (not listed on the city page) :
Year house built (houses)
0 2020 or later81 2010 to 201986 2000 to 2009196 1990 to 1999182 1980 to 1989410 1970 to 19791,001 1960 to 1969821 1950 to 1959719 1940 to 19494,396 1939 or earlier
Zip code 45410 household income distribution in 2022 558 Less than $10,000519 $10,000 to $14,999381 $15,000 to $19,999687 $20,000 to $24,999274 $25,000 to $29,999442 $30,000 to $34,999299 $35,000 to $39,999535 $40,000 to $44,999169 $45,000 to $49,999829 $50,000 to $59,999743 $60,000 to $74,999890 $75,000 to $99,999452 $100,000 to $124,999192 $125,000 to $149,999254 $150,000 to $199,99967 $200,000 or moreEstimate of home value of owner-occupied houses/condos in 2022 in zip code 45410 25 Less than $10,00012 $10,000 to $14,99981 $15,000 to $19,99967 $20,000 to $24,99917 $25,000 to $29,99987 $30,000 to $34,99950 $35,000 to $39,999141 $40,000 to $49,999228 $50,000 to $59,999362 $60,000 to $69,999394 $70,000 to $79,999340 $80,000 to $89,999297 $90,000 to $99,999357 $100,000 to $124,999243 $125,000 to $149,999212 $150,000 to $174,99954 $175,000 to $199,99979 $200,000 to $249,99959 $250,000 to $299,99950 $300,000 to $399,99921 $400,000 to $499,999Rent paid by renters in 2022 in zip code 45410 44 Less than $10047 $150 to $1998 $200 to $249127 $250 to $29947 $300 to $349138 $400 to $449105 $450 to $499212 $500 to $549283 $550 to $599410 $600 to $649347 $650 to $699234 $700 to $749316 $750 to $799540 $800 to $899190 $900 to $999145 $1,000 to $1,249183 $1,250 to $1,49917 $1,500 to $1,9993 $2,000 to $2,49930 $2,500 to $2,99973 No cash rent
Median gross rent in 2022: $910.
Estimated median house (or condo) value in 2022 for: White Non-Hispanic householders: $95,115Black or African American householders: $115,497Asian householders: $88,321Some other race householders: $101,909Two or more races householders: $80,440Hispanic or Latino householders: $46,878Estimated median house or condo value in 2022: $94,979
45410:
$94,979Ohio:
$204,100
Lower value quartile - upper value quartile: $66,985 - $131,783
Mean price in 2022: Detached houses: $106,200Here:
$106,200State:
$254,366
Townhouses or other attached units: $82,063Here:
$82,063State:
$225,733
In 2-unit structures: $296,788Here:
$296,788State:
$144,384
In 3-to-4-unit structures: $95,239Here:
$95,239State:
$203,002
In 5-or-more-unit structures: $128,014Here:
$128,014State:
$211,593
Mobile homes: $16,824Here:
$16,824State:
$62,719
Housing units in structures:
One, detached: 5,432One, attached: 719Two: 3633 or 4: 4205 to 9: 22010 to 19: 18920 to 49: 3050 or more: 674Mobile homes: 14Unemployment : 5.5%
Means of transportation to work in zip code 45410 72.5% 5,491 Drove a car alone9.4% 714 Carpooled1.6% 120 Bus or trolley bus1.0% 78 Bicycle3.6% 275 Walked1.5% 116 Other means9.4% 709 Worked at homeTravel time to work (commute) in zip code 45410 175 Less than 5 minutes623 5 to 9 minutes1,030 10 to 14 minutes1,494 15 to 19 minutes1,471 20 to 24 minutes598 25 to 29 minutes533 30 to 34 minutes186 35 to 39 minutes85 40 to 44 minutes275 45 to 59 minutes263 60 to 89 minutes53 90 or more minutes
Neighborhoods in zip code 45410: Percentage of zip code residents living and working in this county: 74.4%
Household type by relationship:
Households: 17,317
Male householders: 3,740 (1,598 living alone ), Female householders: 3,512 (1,202 living alone )1,925 spouses (1,864 opposite-sex spouses ), 1,091 unmarried partners , (1,084 opposite-sex unmarried partners ), 5,172 children (4,727 natural , 46 adopted , 388 stepchildren ), 390 grandchildren , 186 brothers or sisters , 77 parents , 0 foster children , 214 other relatives , 827 non-relatives In group quarters: 154 (-1 institutionalized population )
Size of family households: 1,382 2-persons , 908 3-persons , 608 4-persons , 573 5-persons , 87 6-persons , 186 7-or-more-persons
Size of nonfamily households: 2,795 1-person , 564 2-persons , 31 3-persons , 106 4-persons , 18 5-persons
1,661 married couples with children. single-parent households (751 men , 1,849 women ).
89.0% of residents of 45410 zip code speak English at home. of residents speak Spanish at home (37% very well, 23% well, 16% not well, 24% not at all ).of residents speak other Indo-European language at home (81% very well, 19% not well ).of residents speak Asian or Pacific Island language at home (68% very well, 21% well, 11% not well ).of residents speak other language at home (68% very well, 21% well, 12% not well ).
Foreign born population: 1,214 (7.0%)
(23.4%
of them are naturalized citizens )
This zip code:
7.0%Whole state:
5.0%
23% Honduras 13% El Salvador 10% Costa Rica 8% Georgia 8% Guatemala 7% Colombia 5% Malaysia 12% German 9% American 8% Irish 4% Czech 3% English 3% Italian 2% African
Year of entry for the foreign-born population
978 2010 or later 278 2000 to 2009 169 1990 to 1999 80 Before 1990
There are
39 Medical Specialists in Zip Code 45410 .
Facilities with environmental interests located in this zip code:
BP OIL CO (3000 LINDEN AVENUE in DAYTON, OH)
AIR MINOR (AIRS/AFS) CRITERIA AND HAZARDOUS AIR POLLUTANT INVENTORY (Inventory of air pollution sources) STATE MASTER (Ohio general info) - RCRA-OHD987014099, HAZARDOUS WASTE PROGRAM, AIR MAJOR, -57-5541-659-11, EPCRA Conditionally Exempt Small Quantity Generators, less than 100 kg/month of hazardous waste (Resource Conservation and Recovery Act (tracking hazardous waste)) - notification Business SIC classification: GASOLINE SERVICE STATIONSOrganizations: BP OIL COMPANY (CONTACT/OWNER)
Alternative names: BP AMOCO #09556
0307-57- (BEHIND 650 ST PAUL AVE in DAYTON, OH)
(Resource Conservation and Recovery Act (tracking hazardous waste))
Housing units lacking complete plumbing facilities: 4.2%
Housing units lacking complete kitchen facilities: 3.7%
77.5% Utility gas 19.7% Electricity 2.2% No fuel used 0.6% Bottled, tank, or LP gas
Population in 1990: 19,743.
Place of birth for U.S.-born residents:
This state: 12,526Northeast: 608Midwest: 1,039South: 1,429West: 289
51% of the 45410 zip code residents lived in the same house 5 years ago.
Out of people who lived in different houses, 72% lived in this county.
Out of people who lived in different counties, 50% lived in Ohio.
79% of the 45410 zip code residents lived in the same house 1 year ago.
Out of people who lived in different houses, 55% moved from this county.
Out of people who lived in different houses, 23% moved from different county within same state.
Out of people who lived in different houses, 12% moved from different state.
Out of people who lived in different houses, 8% moved from abroad.
Private vs. public school enrollment:
Students in private schools in grades 1 to 8 (elementary and middle school): 524
Students in private schools in grades 9 to 12 (high school): 162
Students in private undergraduate colleges: 221
Occupation by median earnings in the past 12 months ($)
92,011 Life, physical, and social science occupations 81,380 Health diagnosing and treating practitioners and other technical occupations 70,717 Law enforcement workers including supervisors 64,467 Legal occupations 58,821 Community and social service occupations 58,670 Business and financial operations occupations
Companies with federal contracts located in this zip code (DAYTON, OH):
LIGHT FANTASTIC INC, THE (608 XENIA AVE; small business) in 3 contracts from 2002 to 2005
$296,639 with Air Force for Electric Portable and Hand Lighting Equipment. Signed on 2002-06-04. Completion date: 2002-07-05.
, same as above. Signed on 2003-04-30. Completion date: 2003-05-23.
with Air Force for Photographic Equipment and Accessories. Signed on 2005-11-22. Completion date: 2005-12-22.
SERVICE ONE OF DAYTON (3101 WELLINGTON DRIVE; small business) in 5 contracts from 1999 to 2002
Contracts for Landscaping/Groundskeeping Services by U.S. Army Corps of Engineers - civil program financing onlySigned by year: 2000: $0; 2001: $47,991; 2002: $29,571; 2003: $0; 2004: $0; 2005: $0; 2006: $0.
Biggest contracts: with U.S. Army Corps of Engineers - civil program financing only for Landscaping/Groundskeeping Services. Signed on 2001-01-22. Completion date: 2001-12-31.
, same as above. Signed on 1999-12-28. Completion date: 2000-12-31.
, same as above. Signed on 2002-04-24. Completion date: 2002-12-31.
, same as above. Signed on 2002-07-09. Completion date: 2001-12-31.
GRECO, PATRICK (928 E STEWART ST; small business) in 2 contracts in 2003
$30,000 with Air Force for Chemicals. Signed on 2003-02-21. Completion date: 2003-03-21.
, same as above. Signed on 2003-09-08. Completion date: 2003-12-08.
SOUND FORCE INC (1857 WAYNE AVE; small business) in 2 contracts from 2001 to 2004
$31,592 with Air Force for Headsets, Handsets, Microphones and Speakers. Signed on 2001-12-12. Completion date: 2001-12-26.
with Air Force for Intercommunication and Public Address Systems, Except Airborne. Signed on 2004-08-05. Completion date: 2004-08-30.
EXCELLENCE DESIGN INSTITUTE (34 PERRINE STREET; small business) in 3 contracts from 2002 to 2004
$15,000 with Army for Other Research and Development -- Applied Research and Exploratory Development (R&D). Signed on 2004-05-10. Completion date: 2004-04-23.
with Army for ADP Software, Equipment, and Telecommunications Training. Signed on 2002-11-08. Completion date: 2002-12-31.
with Army for Other Research and Development -- Basic Research (R&D). Signed on 2003-04-29. Completion date: 2003-08-31.
Top industries in this zip code by the number of employees in 2005:
Accommodation and Food Services: Full-Service Restaurants (50-99 employees: 1 establishment, 20-49 employees: 3 establishments, 1-4 employees: 1 establishment)Administrative and Support and Waste Management and Remediation Services: Janitorial Services (100-249: 1, 5-9: 1)Administrative and Support and Waste Management and Remediation Services: Security Guards and Patrol Services (100-249: 1)Other Services (except Public Administration): Religious Organizations (20-49: 2, 10-19: 1, 5-9: 2, 1-4: 5)Accommodation and Food Services: Limited-Service Restaurants (20-49: 2, 10-19: 2, 5-9: 1)Health Care and Social Assistance: Residential Mental Health and Substance Abuse Facilities (50-99: 1, 10-19: 1)Health Care and Social Assistance: Nursing Care Facilities (50-99: 1, 5-9: 1)Construction: Industrial Building Construction (50-99: 1)Health Care and Social Assistance: Medical Laboratories (50-99: 1)
People in group quarters in 2010:
15 people in group homes intended for adults
6 people in nursing facilities/skilled-nursing facilities
People in group quarters in 2000:
103 people in college dormitories (includes college quarters off campus)
77 people in mental (psychiatric) hospitals or wards
41 people in nursing homes
12 people in other noninstitutional group quarters
11 people in other nonhousehold living situations
4 people in religious group quarters
Fatal accident statistics in 2014:
Fatal accident count: 1Vehicles involved in fatal accidents: 1Fatal accidents caused by drunken drivers: 0Fatalities: 1Persons involved in fatal accidents: 1Pedestrians involved in fatal accidents: 0
Fatal accident statistics in 2013:
Fatal accident count: 3Vehicles involved in fatal accidents: 3Fatal accidents caused by drunken drivers: 0Fatalities: 3Persons involved in fatal accidents: 3Pedestrians involved in fatal accidents: 1
Home Mortgage Disclosure Act Aggregated Statistics For Year 2009(Based on 2 full and 10 partial tracts) A) FHA, FSA/RHS & VA B) Conventional C) Refinancings D) Home Improvement Loans F) Non-occupant Loans on G) Loans On Manufactured Number Average Value Number Average Value Number Average Value Number Average Value Number Average Value Number Average Value
LOANS ORIGINATED 150 $67,416 44 $54,817 222 $78,059 18 $27,799 36 $57,255 0 $0 APPLICATIONS APPROVED, NOT ACCEPTED 3 $97,680 7 $49,930 45 $82,420 8 $14,204 8 $73,268 0 $0 APPLICATIONS DENIED 21 $62,918 10 $73,334 136 $75,511 50 $21,953 27 $64,097 0 $0 APPLICATIONS WITHDRAWN 15 $61,269 1 $145,050 47 $70,981 1 $27,200 9 $66,612 1 $123,080 FILES CLOSED FOR INCOMPLETENESS 0 $0 3 $30,727 14 $92,441 1 $14,650 5 $76,632 0 $0
Aggregated Statistics For Year 2008(Based on 2 full and 10 partial tracts) A) FHA, FSA/RHS & VA B) Conventional C) Refinancings D) Home Improvement Loans E) Loans on Dwellings For 5+ Families F) Non-occupant Loans on G) Loans On Manufactured Number Average Value Number Average Value Number Average Value Number Average Value Number Average Value Number Average Value Number Average Value
LOANS ORIGINATED 159 $79,312 121 $63,161 210 $71,852 50 $16,750 5 $765,410 87 $58,982 0 $0 APPLICATIONS APPROVED, NOT ACCEPTED 11 $63,165 19 $78,499 36 $80,396 14 $24,166 0 $0 14 $55,285 0 $0 APPLICATIONS DENIED 16 $66,609 32 $61,374 226 $80,153 66 $16,989 1 $108,820 40 $74,380 2 $4,885 APPLICATIONS WITHDRAWN 15 $77,095 26 $61,794 75 $74,036 3 $99,977 0 $0 18 $51,082 0 $0 FILES CLOSED FOR INCOMPLETENESS 0 $0 11 $64,287 17 $100,371 4 $35,122 0 $0 2 $50,175 0 $0
Aggregated Statistics For Year 2007(Based on 2 full and 10 partial tracts) A) FHA, FSA/RHS & VA B) Conventional C) Refinancings D) Home Improvement Loans E) Loans on Dwellings For 5+ Families F) Non-occupant Loans on Number Average Value Number Average Value Number Average Value Number Average Value Number Average Value Number Average Value
LOANS ORIGINATED 70 $80,311 397 $65,745 330 $69,663 61 $35,633 4 $239,350 202 $59,598 APPLICATIONS APPROVED, NOT ACCEPTED 6 $62,107 55 $68,002 68 $77,607 18 $31,108 1 $190,430 33 $65,003 APPLICATIONS DENIED 27 $69,586 120 $60,512 440 $76,565 100 $29,036 1 $439,560 139 $61,364 APPLICATIONS WITHDRAWN 2 $75,700 46 $58,531 108 $67,173 12 $36,450 0 $0 33 $63,271 FILES CLOSED FOR INCOMPLETENESS 0 $0 17 $53,972 31 $72,832 6 $56,697 3 $285,713 17 $64,605
Aggregated Statistics For Year 2006(Based on 2 full and 10 partial tracts) A) FHA, FSA/RHS & VA B) Conventional C) Refinancings D) Home Improvement Loans E) Loans on Dwellings For 5+ Families F) Non-occupant Loans on G) Loans On Manufactured Number Average Value Number Average Value Number Average Value Number Average Value Number Average Value Number Average Value Number Average Value
LOANS ORIGINATED 121 $81,739 465 $61,867 456 $67,710 68 $29,121 0 $0 244 $62,152 0 $0 APPLICATIONS APPROVED, NOT ACCEPTED 0 $0 77 $61,666 113 $71,310 16 $18,930 0 $0 51 $59,519 0 $0 APPLICATIONS DENIED 15 $76,580 145 $63,384 420 $72,539 103 $30,573 2 $4,070 139 $58,447 7 $61,066 APPLICATIONS WITHDRAWN 3 $88,827 59 $64,848 212 $74,224 31 $32,677 0 $0 53 $62,188 0 $0 FILES CLOSED FOR INCOMPLETENESS 0 $0 16 $72,827 70 $89,877 3 $24,743 0 $0 19 $58,438 2 $23,930
Aggregated Statistics For Year 2005(Based on 2 full and 10 partial tracts) A) FHA, FSA/RHS & VA B) Conventional C) Refinancings D) Home Improvement Loans E) Loans on Dwellings For 5+ Families F) Non-occupant Loans on G) Loans On Manufactured Number Average Value Number Average Value Number Average Value Number Average Value Number Average Value Number Average Value Number Average Value
LOANS ORIGINATED 147 $82,138 563 $67,480 601 $69,403 76 $22,941 11 $291,109 308 $60,806 0 $0 APPLICATIONS APPROVED, NOT ACCEPTED 7 $57,706 55 $67,325 164 $69,255 12 $33,513 0 $0 42 $60,172 2 $27,675 APPLICATIONS DENIED 19 $76,539 141 $72,817 536 $73,751 118 $30,853 0 $0 104 $55,122 6 $45,053 APPLICATIONS WITHDRAWN 13 $81,672 84 $70,112 292 $83,072 53 $79,335 0 $0 45 $69,540 2 $64,810 FILES CLOSED FOR INCOMPLETENESS 3 $126,607 32 $54,612 69 $86,164 2 $183,820 0 $0 19 $58,267 0 $0
Aggregated Statistics For Year 2004(Based on 2 full and 10 partial tracts) A) FHA, FSA/RHS & VA B) Conventional C) Refinancings D) Home Improvement Loans E) Loans on Dwellings For 5+ Families F) Non-occupant Loans on G) Loans On Manufactured Number Average Value Number Average Value Number Average Value Number Average Value Number Average Value Number Average Value Number Average Value
LOANS ORIGINATED 153 $80,655 466 $69,547 787 $68,951 75 $40,073 4 $107,395 339 $61,085 0 $0 APPLICATIONS APPROVED, NOT ACCEPTED 3 $110,267 76 $73,689 176 $68,155 14 $18,131 0 $0 44 $61,867 0 $0 APPLICATIONS DENIED 15 $61,427 116 $65,583 545 $69,947 105 $22,688 1 $2,564,100 75 $58,495 1 $60,070 APPLICATIONS WITHDRAWN 8 $89,742 57 $69,793 367 $75,698 35 $41,354 0 $0 33 $55,732 1 $29,300 FILES CLOSED FOR INCOMPLETENESS 2 $54,540 14 $63,361 64 $73,983 3 $64,113 0 $0 17 $66,257 0 $0
Aggregated Statistics For Year 2003(Based on 2 full and 10 partial tracts) A) FHA, FSA/RHS & VA B) Conventional C) Refinancings D) Home Improvement Loans E) Loans on Dwellings For 5+ Families F) Non-occupant Loans on Number Average Value Number Average Value Number Average Value Number Average Value Number Average Value Number Average Value
LOANS ORIGINATED 134 $75,986 413 $65,596 1,418 $67,331 67 $21,781 2 $87,870 345 $58,133 APPLICATIONS APPROVED, NOT ACCEPTED 12 $79,637 69 $64,748 242 $73,406 25 $13,177 0 $0 47 $65,151 APPLICATIONS DENIED 16 $81,300 136 $58,956 612 $69,152 112 $18,596 1 $128,940 133 $56,486 APPLICATIONS WITHDRAWN 6 $100,023 62 $65,059 374 $74,993 18 $16,339 0 $0 50 $54,246 FILES CLOSED FOR INCOMPLETENESS 5 $103,802 26 $66,382 84 $77,564 2 $32,560 0 $0 7 $69,326
Aggregated Statistics For Year 2002(Based on 2 full and 10 partial tracts) A) FHA, FSA/RHS & VA B) Conventional C) Refinancings D) Home Improvement Loans F) Non-occupant Loans on Number Average Value Number Average Value Number Average Value Number Average Value Number Average Value
LOANS ORIGINATED 202 $75,544 481 $66,535 973 $65,114 91 $12,705 341 $57,876 APPLICATIONS APPROVED, NOT ACCEPTED 12 $68,502 72 $63,913 255 $68,789 25 $22,038 54 $63,889 APPLICATIONS DENIED 23 $67,797 114 $58,261 584 $68,364 96 $14,467 117 $60,552 APPLICATIONS WITHDRAWN 6 $74,085 33 $66,325 353 $74,437 16 $14,671 12 $51,936 FILES CLOSED FOR INCOMPLETENESS 0 $0 29 $56,643 65 $73,843 0 $0 15 $47,869
Aggregated Statistics For Year 2001(Based on 2 full and 10 partial tracts) A) FHA, FSA/RHS & VA B) Conventional C) Refinancings D) Home Improvement Loans E) Loans on Dwellings For 5+ Families F) Non-occupant Loans on Number Average Value Number Average Value Number Average Value Number Average Value Number Average Value Number Average Value
LOANS ORIGINATED 225 $72,927 348 $63,338 1,019 $62,876 119 $15,246 8 $137,471 216 $53,266 APPLICATIONS APPROVED, NOT ACCEPTED 8 $73,160 46 $51,214 232 $58,889 33 $12,852 0 $0 35 $45,911 APPLICATIONS DENIED 11 $77,566 148 $55,431 560 $63,000 102 $14,377 2 $85,185 105 $60,547 APPLICATIONS WITHDRAWN 5 $65,070 46 $60,547 327 $69,478 14 $22,515 0 $0 28 $51,998 FILES CLOSED FOR INCOMPLETENESS 5 $51,794 20 $70,138 70 $70,630 1 $27,200 0 $0 11 $59,366
Aggregated Statistics For Year 2000(Based on 2 full and 10 partial tracts) A) FHA, FSA/RHS & VA B) Conventional C) Refinancings D) Home Improvement Loans E) Loans on Dwellings For 5+ Families F) Non-occupant Loans on Number Average Value Number Average Value Number Average Value Number Average Value Number Average Value Number Average Value
LOANS ORIGINATED 251 $69,346 396 $59,040 448 $55,452 167 $10,733 0 $0 176 $52,906 APPLICATIONS APPROVED, NOT ACCEPTED 11 $78,651 61 $49,912 187 $57,537 65 $15,125 0 $0 34 $53,004 APPLICATIONS DENIED 18 $71,899 196 $56,174 438 $53,716 146 $12,947 3 $100,937 106 $53,793 APPLICATIONS WITHDRAWN 5 $80,728 38 $50,832 177 $50,825 8 $27,615 2 $255,260 23 $54,444 FILES CLOSED FOR INCOMPLETENESS 6 $46,282 10 $70,635 64 $59,388 0 $0 0 $0 0 $0
Aggregated Statistics For Year 1999(Based on 2 full and 4 partial tracts) A) FHA, FSA/RHS & VA B) Conventional C) Refinancings D) Home Improvement Loans E) Loans on Dwellings For 5+ Families F) Non-occupant Loans on Number Average Value Number Average Value Number Average Value Number Average Value Number Average Value Number Average Value
LOANS ORIGINATED 129 $70,911 203 $119,850 341 $54,952 62 $13,158 1 $127,220 96 $57,222 APPLICATIONS APPROVED, NOT ACCEPTED 3 $71,547 36 $51,416 125 $53,168 39 $9,711 0 $0 15 $43,732 APPLICATIONS DENIED 7 $68,030 63 $54,057 215 $52,649 88 $11,151 1 $44,000 33 $43,000 APPLICATIONS WITHDRAWN 8 $62,151 25 $63,078 155 $54,245 14 $23,215 0 $0 12 $46,298 FILES CLOSED FOR INCOMPLETENESS 0 $0 6 $49,958 42 $55,447 2 $21,280 0 $0 1 $32,430
Private Mortgage Insurance Companies Aggregated Statistics For Year 2009(Based on 10 partial tracts) A) Conventional B) Refinancings C) Non-occupant Loans on Number Average Value Number Average Value Number Average Value
LOANS ORIGINATED 11 $65,194 20 $89,378 0 $0 APPLICATIONS APPROVED, NOT ACCEPTED 5 $85,828 9 $77,563 1 $120,150 APPLICATIONS DENIED 1 $105,490 2 $73,260 0 $0 APPLICATIONS WITHDRAWN 1 $39,560 2 $157,790 0 $0 FILES CLOSED FOR INCOMPLETENESS 0 $0 0 $0 0 $0
Aggregated Statistics For Year 2008(Based on 2 full and 10 partial tracts) A) Conventional B) Refinancings C) Non-occupant Loans on Number Average Value Number Average Value Number Average Value
LOANS ORIGINATED 72 $72,897 27 $81,691 9 $55,158 APPLICATIONS APPROVED, NOT ACCEPTED 23 $83,254 8 $80,204 6 $75,593 APPLICATIONS DENIED 5 $95,424 3 $72,417 2 $88,725 APPLICATIONS WITHDRAWN 3 $65,003 0 $0 1 $78,350 FILES CLOSED FOR INCOMPLETENESS 0 $0 0 $0 0 $0
Aggregated Statistics For Year 2007(Based on 2 full and 10 partial tracts) A) Conventional B) Refinancings C) Non-occupant Loans on Number Average Value Number Average Value Number Average Value
LOANS ORIGINATED 173 $71,685 53 $83,616 36 $57,869 APPLICATIONS APPROVED, NOT ACCEPTED 24 $93,576 12 $83,725 9 $80,439 APPLICATIONS DENIED 2 $78,770 0 $0 0 $0 APPLICATIONS WITHDRAWN 8 $66,899 6 $91,042 3 $50,033 FILES CLOSED FOR INCOMPLETENESS 0 $0 0 $0 0 $0
Aggregated Statistics For Year 2006(Based on 2 full and 10 partial tracts) A) Conventional B) Refinancings C) Non-occupant Loans on Number Average Value Number Average Value Number Average Value
LOANS ORIGINATED 120 $73,313 43 $83,284 39 $57,768 APPLICATIONS APPROVED, NOT ACCEPTED 4 $83,052 22 $96,715 10 $66,635 APPLICATIONS DENIED 2 $43,955 1 $87,910 0 $0 APPLICATIONS WITHDRAWN 11 $71,117 2 $68,375 2 $48,860 FILES CLOSED FOR INCOMPLETENESS 0 $0 0 $0 0 $0
Aggregated Statistics For Year 2005(Based on 2 full and 10 partial tracts) A) Conventional B) Refinancings C) Non-occupant Loans on Number Average Value Number Average Value Number Average Value
LOANS ORIGINATED 130 $67,495 61 $80,813 54 $53,790 APPLICATIONS APPROVED, NOT ACCEPTED 19 $90,689 17 $81,483 16 $75,076 APPLICATIONS DENIED 4 $57,142 0 $0 3 $37,120 APPLICATIONS WITHDRAWN 9 $45,929 3 $81,183 7 $36,830 FILES CLOSED FOR INCOMPLETENESS 1 $64,470 2 $66,750 1 $64,470
Aggregated Statistics For Year 2004(Based on 2 full and 10 partial tracts) A) Conventional B) Refinancings C) Non-occupant Loans on Number Average Value Number Average Value Number Average Value
LOANS ORIGINATED 120 $74,234 88 $75,556 56 $61,435 APPLICATIONS APPROVED, NOT ACCEPTED 22 $69,809 55 $72,131 15 $54,068 APPLICATIONS DENIED 1 $180,640 0 $0 0 $0 APPLICATIONS WITHDRAWN 9 $60,814 18 $92,048 9 $73,483 FILES CLOSED FOR INCOMPLETENESS 0 $0 0 $0 0 $0
Aggregated Statistics For Year 2003(Based on 2 full and 10 partial tracts) A) Conventional B) Refinancings C) Non-occupant Loans on Number Average Value Number Average Value Number Average Value
LOANS ORIGINATED 124 $79,088 145 $77,248 57 $58,869 APPLICATIONS APPROVED, NOT ACCEPTED 44 $71,162 44 $77,782 28 $54,368 APPLICATIONS DENIED 5 $76,516 2 $58,610 2 $62,680 APPLICATIONS WITHDRAWN 11 $59,203 13 $83,973 8 $65,074 FILES CLOSED FOR INCOMPLETENESS 0 $0 0 $0 0 $0
Aggregated Statistics For Year 2002(Based on 2 full and 10 partial tracts) A) Conventional B) Refinancings C) Non-occupant Loans on Number Average Value Number Average Value Number Average Value
LOANS ORIGINATED 202 $74,250 128 $74,850 101 $59,694 APPLICATIONS APPROVED, NOT ACCEPTED 27 $67,989 46 $86,888 12 $55,270 APPLICATIONS DENIED 11 $66,062 2 $59,825 5 $70,314 APPLICATIONS WITHDRAWN 16 $65,467 15 $71,381 15 $66,249 FILES CLOSED FOR INCOMPLETENESS 2 $57,795 3 $38,257 3 $59,207
Aggregated Statistics For Year 2001(Based on 2 full and 10 partial tracts) A) Conventional B) Refinancings C) Non-occupant Loans on Number Average Value Number Average Value Number Average Value
LOANS ORIGINATED 113 $62,399 142 $76,216 43 $52,228 APPLICATIONS APPROVED, NOT ACCEPTED 28 $70,187 33 $74,095 12 $54,582 APPLICATIONS DENIED 3 $79,610 7 $78,236 3 $66,477 APPLICATIONS WITHDRAWN 5 $81,578 8 $75,131 1 $164,100 FILES CLOSED FOR INCOMPLETENESS 0 $0 0 $0 0 $0
Aggregated Statistics For Year 2000(Based on 2 full and 10 partial tracts) A) Conventional B) Refinancings C) Non-occupant Loans on Number Average Value Number Average Value Number Average Value
LOANS ORIGINATED 105 $63,700 35 $63,415 31 $48,646 APPLICATIONS APPROVED, NOT ACCEPTED 9 $56,381 10 $62,136 5 $35,526 APPLICATIONS DENIED 8 $55,038 3 $56,937 3 $47,453 APPLICATIONS WITHDRAWN 2 $56,980 2 $48,840 2 $56,980 FILES CLOSED FOR INCOMPLETENESS 0 $0 0 $0 0 $0
Aggregated Statistics For Year 1999(Based on 2 full and 4 partial tracts) A) Conventional B) Refinancings C) Non-occupant Loans on Number Average Value Number Average Value Number Average Value
LOANS ORIGINATED 46 $64,914 47 $62,507 10 $51,569 APPLICATIONS APPROVED, NOT ACCEPTED 3 $71,123 9 $73,862 3 $57,953 APPLICATIONS DENIED 4 $57,490 0 $0 2 $40,040 APPLICATIONS WITHDRAWN 2 $110,795 1 $51,930 0 $0 FILES CLOSED FOR INCOMPLETENESS 1 $44,720 0 $0 0 $0
2003 - 2018 National Fire Incident Reporting System (NFIRS) incidents See full 2006 National Fire Incident Reporting System statistics for zip code 45410, Ohio
Most common first names in zip code 45410 among deceased individuals Name Count Lived (average)
Mary 227 77.6 years William 198 71.7 years John 183 72.9 years Robert 163 72.0 years James 142 69.8 years Charles 133 73.9 years Joseph 92 73.1 years Helen 90 77.4 years George 84 73.8 years Edward 80 73.6 years
Most common last names in zip code 45410 among deceased individuals Last name Count Lived (average)
Smith 85 72.0 years Brown 57 71.2 years Miller 52 77.8 years Davis 44 72.0 years Jones 43 75.1 years Johnson 41 70.0 years Williams 37 75.2 years Clark 28 67.1 years Allen 26 75.9 years Thomas 24 72.2 years
Businesses in zip code 45410
Name Count Name Count
Cricket Wireless 3 Rite Aid 1 GNC 1 Walgreens 1 H&R Block 1 Wendy's 1 Kroger 1

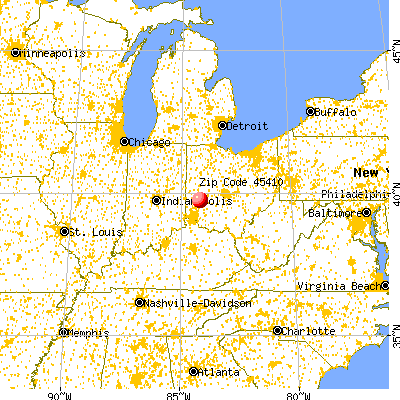


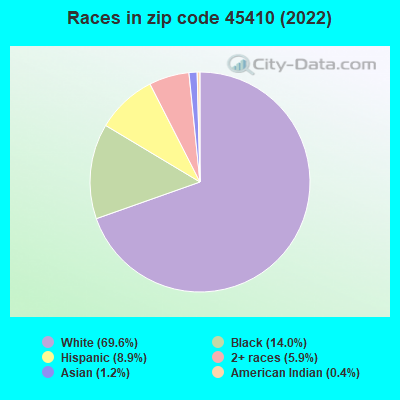


 Nearest zip codes: 45403, 45419, 45409, 45420, 45404, 45402.
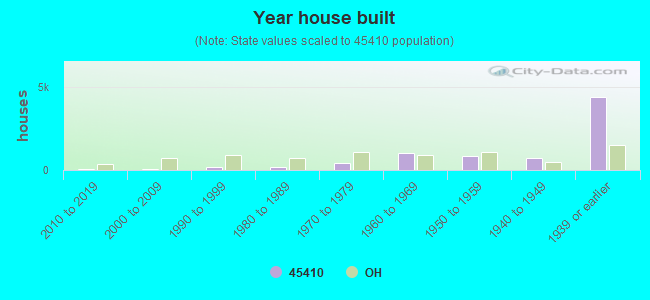

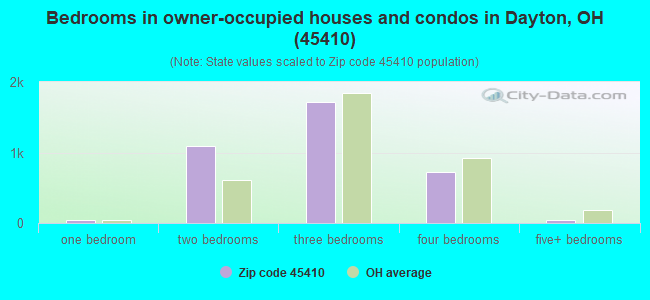
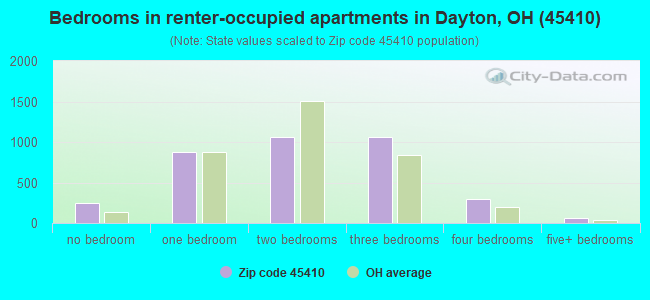
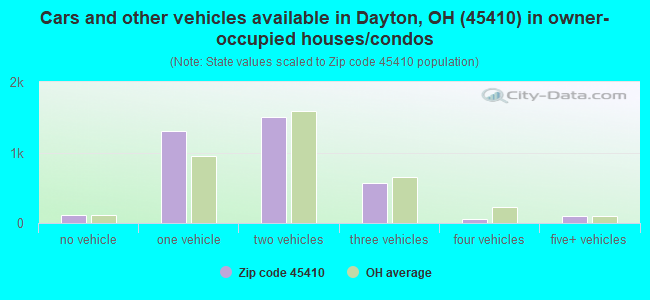
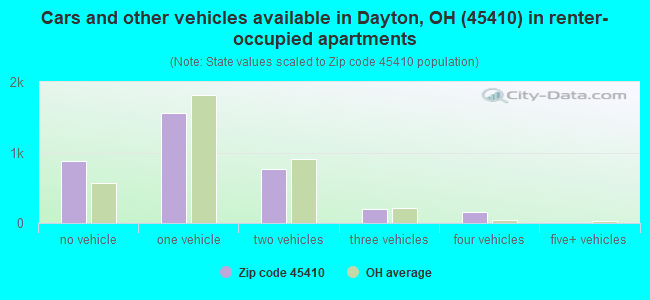


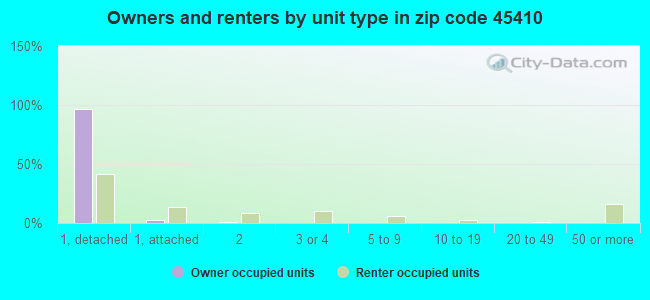
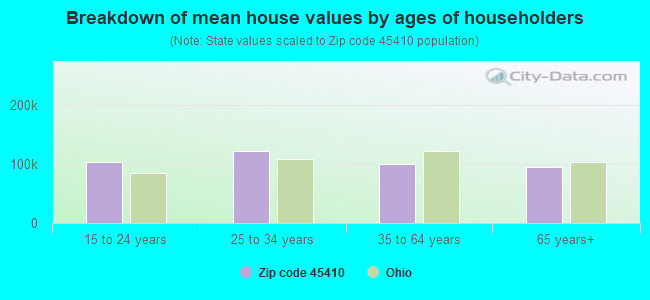


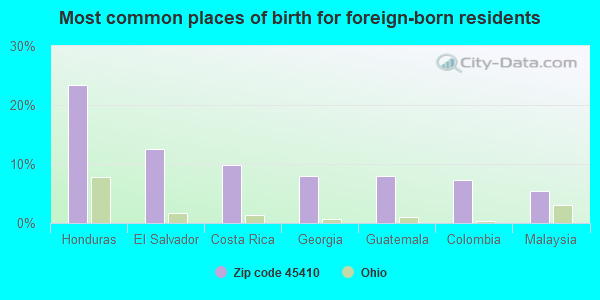
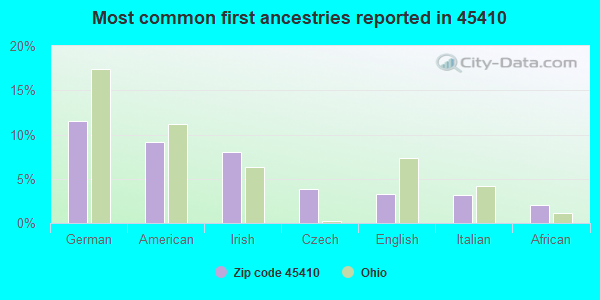
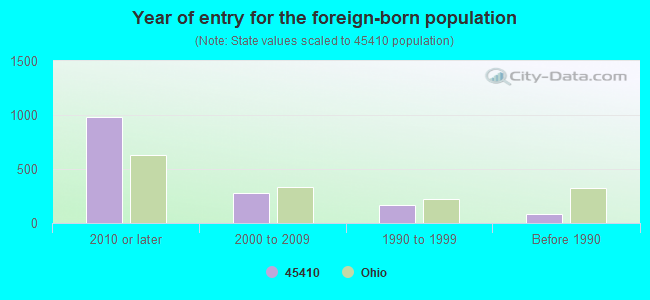

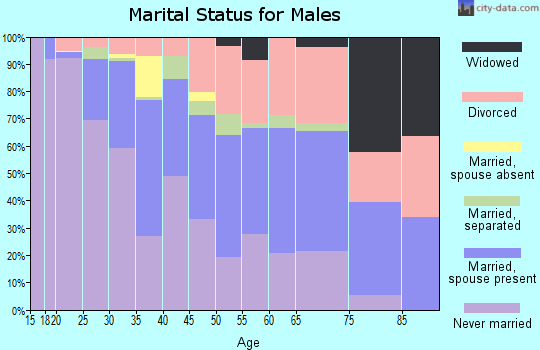
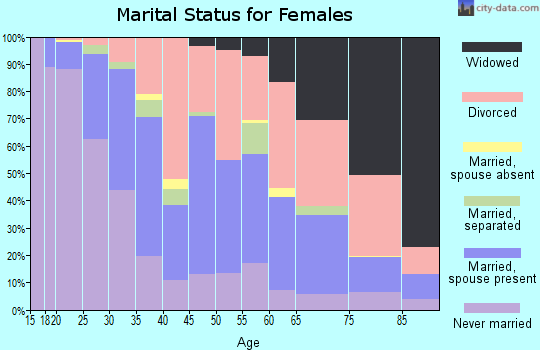
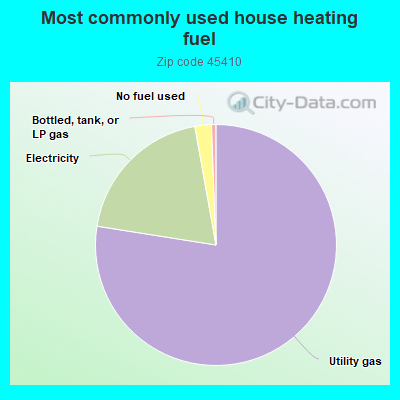
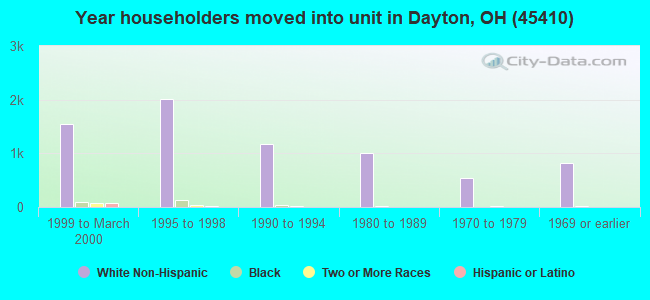
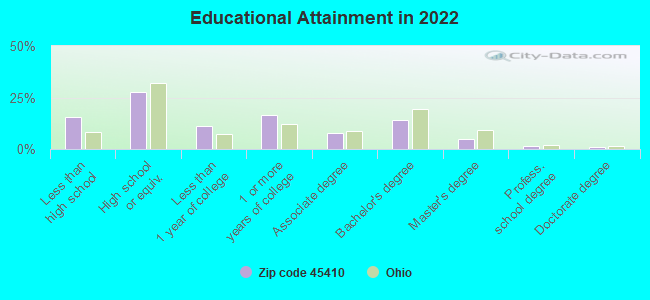
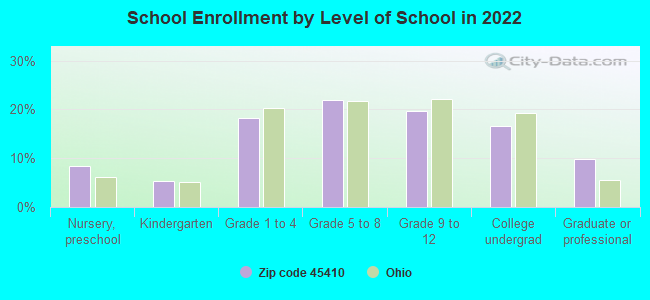
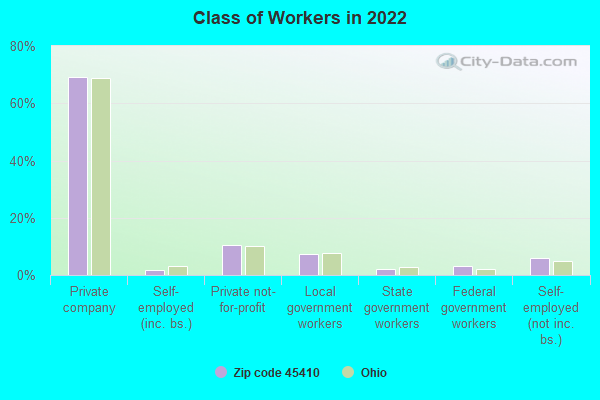
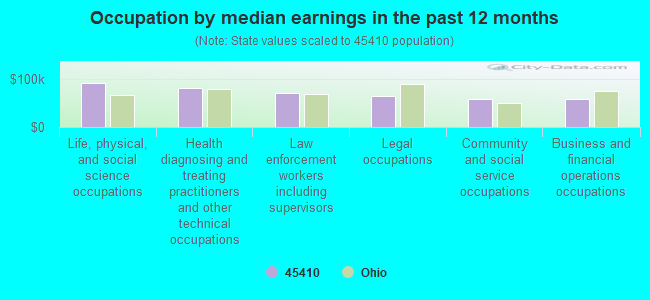
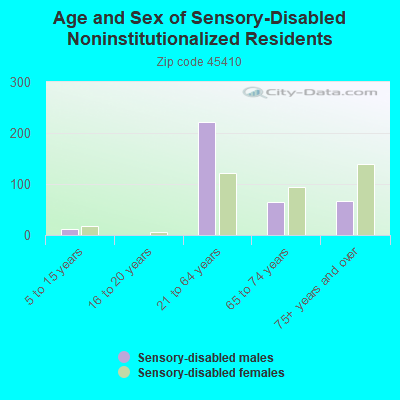
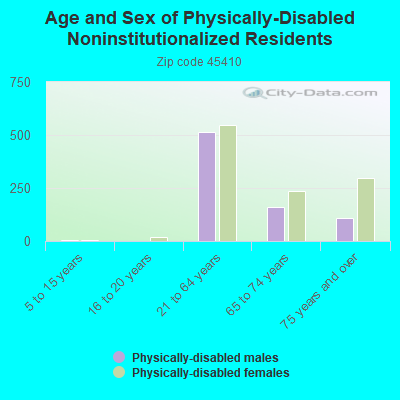
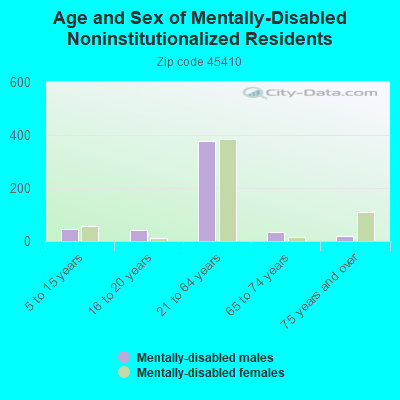
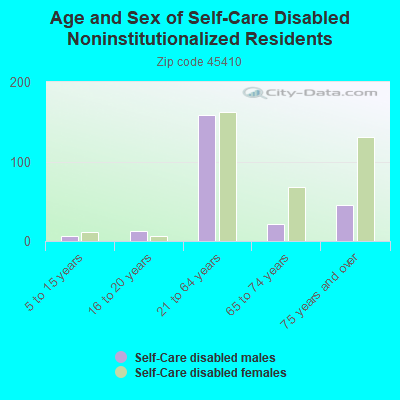
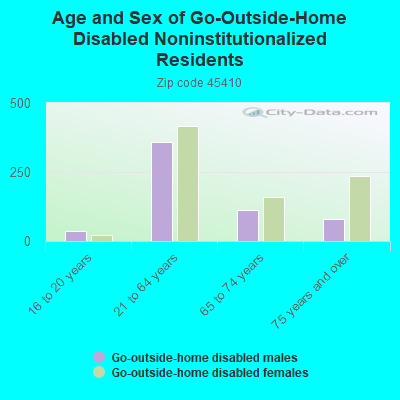
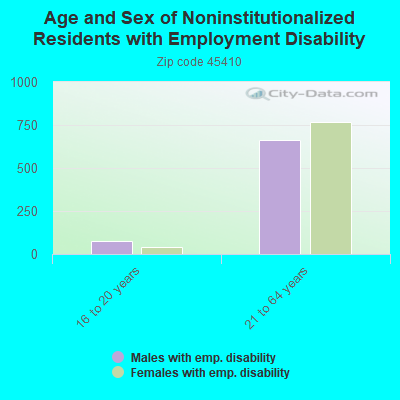
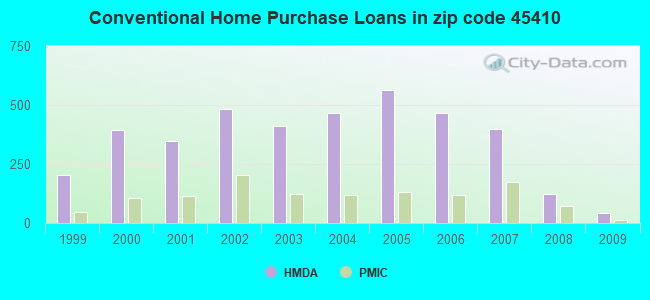
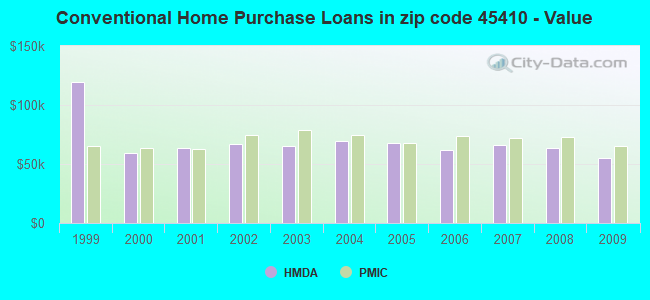
 According to the data from the years 2003 - 2018 the average number of fires per year is 70. The highest number of reported fire incidents - 113 took place in 2005, and the least - 25 in 2015. The data has a declining trend.
 When looking into fire subcategories, the most reports belonged to: Outside Fires (41.5%), and Structure Fires (27.2%).