Estimated zip code population in 2022: 16,825
Zip code population in 2010: 15,159
Zip code population in 2000: 15,437
Houses and condos: 7,600
Renter-occupied apartments: 2,441
% of renters here:
33%State:
33%
March 2022 cost of living index in zip code 45419: 94.3
(less than average, U.S. average is 100)
Land area: 3.9
sq. mi.
Water area: 0.0
sq. mi.
Population density: 4,368 people per square mile (average).
OSM Map
General Map
Google Map
MSN Map
OSM Map
General Map
Google Map
MSN Map
OSM Map
General Map
Google Map
MSN Map
OSM Map
General Map
Google Map
MSN Map
Please wait while loading the map...
Real estate property taxes paid for housing units in 2022:
This zip code:
1.9% ($4,745)Ohio:
1.3% ($2,639)
Median real estate property taxes paid for housing units with mortgages in 2022: $4,733 (1.9%)
Median real estate property taxes paid for housing units with no mortgage in 2022: $4,845 (2.0%)
Profiles of local businesses
Business Search - 14 Million verified businesses
Males: 7,970 Females: 8,854
For population 25 years and over in 45419:
High school or higher: 99.7%Bachelor's degree or higher: 59.4%Graduate or professional degree: 28.7%Unemployed: 2.3%Mean travel time to work (commute): 19.7 minutes
For population 15 years and over in 45419:
Never married: 34.1%Now married: 49.2%Separated: 1.1%Widowed: 2.3%Divorced: 13.3%
Zip code 45419 compared to state average:
Black race population percentage significantly below state average. Hispanic race population percentage below state average. Median age below state average. Length of stay since moving in below state average. House age above state average. Percentage of population with a bachelor's degree or higher above state average. 14,746 87.7% White 770 4.6% Two or more races 547 3.3% Asian 413 2.5% Hispanic or Latino 315 1.9% Black 31 0.2% Some other race
Data:
Median household income ($)
Median household income (% change since 2000)
Household income diversity
Ratio of average income to average house value (%)
Ratio of average income to average rent
Median household income ($) - White
Median household income ($) - Black or African American
Median household income ($) - Asian
Median household income ($) - Hispanic or Latino
Median household income ($) - American Indian and Alaska Native
Median household income ($) - Multirace
Median household income ($) - Other Race
Median household income for houses/condos with a mortgage ($)
Median household income for apartments without a mortgage ($)
Races - White alone (%)
Races - White alone (% change since 2000)
Races - Black alone (%)
Races - Black alone (% change since 2000)
Races - American Indian alone (%)
Races - American Indian alone (% change since 2000)
Races - Asian alone (%)
Races - Asian alone (% change since 2000)
Races - Hispanic (%)
Races - Hispanic (% change since 2000)
Races - Native Hawaiian and Other Pacific Islander alone (%)
Races - Native Hawaiian and Other Pacific Islander alone (% change since 2000)
Races - Two or more races (%)
Races - Two or more races (% change since 2000)
Races - Other race alone (%)
Races - Other race alone (% change since 2000)
Racial diversity
Unemployment (%)
Unemployment (% change since 2000)
Unemployment (%) - White
Unemployment (%) - Black or African American
Unemployment (%) - Asian
Unemployment (%) - Hispanic or Latino
Unemployment (%) - American Indian and Alaska Native
Unemployment (%) - Multirace
Unemployment (%) - Other Race
Population density (people per square mile)
Population - Males (%)
Population - Females (%)
Population - Males (%) - White
Population - Males (%) - Black or African American
Population - Males (%) - Asian
Population - Males (%) - Hispanic or Latino
Population - Males (%) - American Indian and Alaska Native
Population - Males (%) - Multirace
Population - Males (%) - Other Race
Population - Females (%) - White
Population - Females (%) - Black or African American
Population - Females (%) - Asian
Population - Females (%) - Hispanic or Latino
Population - Females (%) - American Indian and Alaska Native
Population - Females (%) - Multirace
Population - Females (%) - Other Race
Coronavirus confirmed cases (Apr 25, 2024)
Deaths caused by coronavirus (Apr 25, 2024)
Coronavirus confirmed cases (per 100k population) (Apr 25, 2024)
Deaths caused by coronavirus (per 100k population) (Apr 25, 2024)
Daily increase in number of cases (Apr 25, 2024)
Weekly increase in number of cases (Apr 25, 2024)
Cases doubled (in days) (Apr 25, 2024)
Hospitalized patients (Apr 18, 2022)
Negative test results (Apr 18, 2022)
Total test results (Apr 18, 2022)
COVID Vaccine doses distributed (per 100k population) (Sep 19, 2023)
COVID Vaccine doses administered (per 100k population) (Sep 19, 2023)
COVID Vaccine doses distributed (Sep 19, 2023)
COVID Vaccine doses administered (Sep 19, 2023)
Likely homosexual households (%)
Likely homosexual households (% change since 2000)
Likely homosexual households - Lesbian couples (%)
Likely homosexual households - Lesbian couples (% change since 2000)
Likely homosexual households - Gay men (%)
Likely homosexual households - Gay men (% change since 2000)
Cost of living index
Median gross rent ($)
Median contract rent ($)
Median monthly housing costs ($)
Median house or condo value ($)
Median house or condo value ($ change since 2000)
Mean house or condo value by units in structure - 1, detached ($)
Mean house or condo value by units in structure - 1, attached ($)
Mean house or condo value by units in structure - 2 ($)
Mean house or condo value by units in structure by units in structure - 3 or 4 ($)
Mean house or condo value by units in structure - 5 or more ($)
Mean house or condo value by units in structure - Boat, RV, van, etc. ($)
Mean house or condo value by units in structure - Mobile home ($)
Median house or condo value ($) - White
Median house or condo value ($) - Black or African American
Median house or condo value ($) - Asian
Median house or condo value ($) - Hispanic or Latino
Median house or condo value ($) - American Indian and Alaska Native
Median house or condo value ($) - Multirace
Median house or condo value ($) - Other Race
Median resident age
Resident age diversity
Median resident age - Males
Median resident age - Females
Median resident age - White
Median resident age - Black or African American
Median resident age - Asian
Median resident age - Hispanic or Latino
Median resident age - American Indian and Alaska Native
Median resident age - Multirace
Median resident age - Other Race
Median resident age - Males - White
Median resident age - Males - Black or African American
Median resident age - Males - Asian
Median resident age - Males - Hispanic or Latino
Median resident age - Males - American Indian and Alaska Native
Median resident age - Males - Multirace
Median resident age - Males - Other Race
Median resident age - Females - White
Median resident age - Females - Black or African American
Median resident age - Females - Asian
Median resident age - Females - Hispanic or Latino
Median resident age - Females - American Indian and Alaska Native
Median resident age - Females - Multirace
Median resident age - Females - Other Race
Commute - mean travel time to work (minutes)
Travel time to work - Less than 5 minutes (%)
Travel time to work - Less than 5 minutes (% change since 2000)
Travel time to work - 5 to 9 minutes (%)
Travel time to work - 5 to 9 minutes (% change since 2000)
Travel time to work - 10 to 19 minutes (%)
Travel time to work - 10 to 19 minutes (% change since 2000)
Travel time to work - 20 to 29 minutes (%)
Travel time to work - 20 to 29 minutes (% change since 2000)
Travel time to work - 30 to 39 minutes (%)
Travel time to work - 30 to 39 minutes (% change since 2000)
Travel time to work - 40 to 59 minutes (%)
Travel time to work - 40 to 59 minutes (% change since 2000)
Travel time to work - 60 to 89 minutes (%)
Travel time to work - 60 to 89 minutes (% change since 2000)
Travel time to work - 90 or more minutes (%)
Travel time to work - 90 or more minutes (% change since 2000)
Marital status - Never married (%)
Marital status - Now married (%)
Marital status - Separated (%)
Marital status - Widowed (%)
Marital status - Divorced (%)
Median family income ($)
Median family income (% change since 2000)
Median non-family income ($)
Median non-family income (% change since 2000)
Median per capita income ($)
Median per capita income (% change since 2000)
Median family income ($) - White
Median family income ($) - Black or African American
Median family income ($) - Asian
Median family income ($) - Hispanic or Latino
Median family income ($) - American Indian and Alaska Native
Median family income ($) - Multirace
Median family income ($) - Other Race
Median year house/condo built
Median year apartment built
Year house built - Built 2005 or later (%)
Year house built - Built 2000 to 2004 (%)
Year house built - Built 1990 to 1999 (%)
Year house built - Built 1980 to 1989 (%)
Year house built - Built 1970 to 1979 (%)
Year house built - Built 1960 to 1969 (%)
Year house built - Built 1950 to 1959 (%)
Year house built - Built 1940 to 1949 (%)
Year house built - Built 1939 or earlier (%)
Average household size
Household density (households per square mile)
Average household size - White
Average household size - Black or African American
Average household size - Asian
Average household size - Hispanic or Latino
Average household size - American Indian and Alaska Native
Average household size - Multirace
Average household size - Other Race
Occupied housing units (%)
Vacant housing units (%)
Owner occupied housing units (%)
Renter occupied housing units (%)
Vacancy status - For rent (%)
Vacancy status - For sale only (%)
Vacancy status - Rented or sold, not occupied (%)
Vacancy status - For seasonal, recreational, or occasional use (%)
Vacancy status - For migrant workers (%)
Vacancy status - Other vacant (%)
Residents with income below the poverty level (%)
Residents with income below 50% of the poverty level (%)
Children below poverty level (%)
Poor families by family type - Married-couple family (%)
Poor families by family type - Male, no wife present (%)
Poor families by family type - Female, no husband present (%)
Poverty status for native-born residents (%)
Poverty status for foreign-born residents (%)
Poverty among high school graduates not in families (%)
Poverty among people who did not graduate high school not in families (%)
Residents with income below the poverty level (%) - White
Residents with income below the poverty level (%) - Black or African American
Residents with income below the poverty level (%) - Asian
Residents with income below the poverty level (%) - Hispanic or Latino
Residents with income below the poverty level (%) - American Indian and Alaska Native
Residents with income below the poverty level (%) - Multirace
Residents with income below the poverty level (%) - Other Race
Air pollution - Air Quality Index (AQI)
Air pollution - CO
Air pollution - NO2
Air pollution - SO2
Air pollution - Ozone
Air pollution - PM10
Air pollution - PM25
Air pollution - Pb
Crime - Murders per 100,000 population
Crime - Rapes per 100,000 population
Crime - Robberies per 100,000 population
Crime - Assaults per 100,000 population
Crime - Burglaries per 100,000 population
Crime - Thefts per 100,000 population
Crime - Auto thefts per 100,000 population
Crime - Arson per 100,000 population
Crime - City-data.com crime index
Crime - Violent crime index
Crime - Property crime index
Crime - Murders per 100,000 population (5 year average)
Crime - Rapes per 100,000 population (5 year average)
Crime - Robberies per 100,000 population (5 year average)
Crime - Assaults per 100,000 population (5 year average)
Crime - Burglaries per 100,000 population (5 year average)
Crime - Thefts per 100,000 population (5 year average)
Crime - Auto thefts per 100,000 population (5 year average)
Crime - Arson per 100,000 population (5 year average)
Crime - City-data.com crime index (5 year average)
Crime - Violent crime index (5 year average)
Crime - Property crime index (5 year average)
1996 Presidential Elections Results (%) - Democratic Party (Clinton)
1996 Presidential Elections Results (%) - Republican Party (Dole)
1996 Presidential Elections Results (%) - Other
2000 Presidential Elections Results (%) - Democratic Party (Gore)
2000 Presidential Elections Results (%) - Republican Party (Bush)
2000 Presidential Elections Results (%) - Other
2004 Presidential Elections Results (%) - Democratic Party (Kerry)
2004 Presidential Elections Results (%) - Republican Party (Bush)
2004 Presidential Elections Results (%) - Other
2008 Presidential Elections Results (%) - Democratic Party (Obama)
2008 Presidential Elections Results (%) - Republican Party (McCain)
2008 Presidential Elections Results (%) - Other
2012 Presidential Elections Results (%) - Democratic Party (Obama)
2012 Presidential Elections Results (%) - Republican Party (Romney)
2012 Presidential Elections Results (%) - Other
2016 Presidential Elections Results (%) - Democratic Party (Clinton)
2016 Presidential Elections Results (%) - Republican Party (Trump)
2016 Presidential Elections Results (%) - Other
2020 Presidential Elections Results (%) - Democratic Party (Biden)
2020 Presidential Elections Results (%) - Republican Party (Trump)
2020 Presidential Elections Results (%) - Other
Ancestries Reported - Arab (%)
Ancestries Reported - Czech (%)
Ancestries Reported - Danish (%)
Ancestries Reported - Dutch (%)
Ancestries Reported - English (%)
Ancestries Reported - French (%)
Ancestries Reported - French Canadian (%)
Ancestries Reported - German (%)
Ancestries Reported - Greek (%)
Ancestries Reported - Hungarian (%)
Ancestries Reported - Irish (%)
Ancestries Reported - Italian (%)
Ancestries Reported - Lithuanian (%)
Ancestries Reported - Norwegian (%)
Ancestries Reported - Polish (%)
Ancestries Reported - Portuguese (%)
Ancestries Reported - Russian (%)
Ancestries Reported - Scotch-Irish (%)
Ancestries Reported - Scottish (%)
Ancestries Reported - Slovak (%)
Ancestries Reported - Subsaharan African (%)
Ancestries Reported - Swedish (%)
Ancestries Reported - Swiss (%)
Ancestries Reported - Ukrainian (%)
Ancestries Reported - United States (%)
Ancestries Reported - Welsh (%)
Ancestries Reported - West Indian (%)
Ancestries Reported - Other (%)
Educational Attainment - No schooling completed (%)
Educational Attainment - Less than high school (%)
Educational Attainment - High school or equivalent (%)
Educational Attainment - Less than 1 year of college (%)
Educational Attainment - 1 or more years of college (%)
Educational Attainment - Associate degree (%)
Educational Attainment - Bachelor's degree (%)
Educational Attainment - Master's degree (%)
Educational Attainment - Professional school degree (%)
Educational Attainment - Doctorate degree (%)
School Enrollment - Nursery, preschool (%)
School Enrollment - Kindergarten (%)
School Enrollment - Grade 1 to 4 (%)
School Enrollment - Grade 5 to 8 (%)
School Enrollment - Grade 9 to 12 (%)
School Enrollment - College undergrad (%)
School Enrollment - Graduate or professional (%)
School Enrollment - Not enrolled in school (%)
School enrollment - Public schools (%)
School enrollment - Private schools (%)
School enrollment - Not enrolled (%)
Median number of rooms in houses and condos
Median number of rooms in apartments
Housing units lacking complete plumbing facilities (%)
Housing units lacking complete kitchen facilities (%)
Density of houses
Urban houses (%)
Rural houses (%)
Households with people 60 years and over (%)
Households with people 65 years and over (%)
Households with people 75 years and over (%)
Households with one or more nonrelatives (%)
Households with no nonrelatives (%)
Population in households (%)
Family households (%)
Nonfamily households (%)
Population in families (%)
Family households with own children (%)
Median number of bedrooms in owner occupied houses
Mean number of bedrooms in owner occupied houses
Median number of bedrooms in renter occupied houses
Mean number of bedrooms in renter occupied houses
Median number of vehichles in owner occupied houses
Mean number of vehichles in owner occupied houses
Median number of vehichles in renter occupied houses
Mean number of vehichles in renter occupied houses
Mortgage status - with mortgage (%)
Mortgage status - with second mortgage (%)
Mortgage status - with home equity loan (%)
Mortgage status - with both second mortgage and home equity loan (%)
Mortgage status - without a mortgage (%)
Average family size
Average family size - White
Average family size - Black or African American
Average family size - Asian
Average family size - Hispanic or Latino
Average family size - American Indian and Alaska Native
Average family size - Multirace
Average family size - Other Race
Geographical mobility - Same house 1 year ago (%)
Geographical mobility - Moved within same county (%)
Geographical mobility - Moved from different county within same state (%)
Geographical mobility - Moved from different state (%)
Geographical mobility - Moved from abroad (%)
Place of birth - Born in state of residence (%)
Place of birth - Born in other state (%)
Place of birth - Native, outside of US (%)
Place of birth - Foreign born (%)
Housing units in structures - 1, detached (%)
Housing units in structures - 1, attached (%)
Housing units in structures - 2 (%)
Housing units in structures - 3 or 4 (%)
Housing units in structures - 5 to 9 (%)
Housing units in structures - 10 to 19 (%)
Housing units in structures - 20 to 49 (%)
Housing units in structures - 50 or more (%)
Housing units in structures - Mobile home (%)
Housing units in structures - Boat, RV, van, etc. (%)
House/condo owner moved in on average (years ago)
Renter moved in on average (years ago)
Year householder moved into unit - Moved in 1999 to March 2000 (%)
Year householder moved into unit - Moved in 1995 to 1998 (%)
Year householder moved into unit - Moved in 1990 to 1994 (%)
Year householder moved into unit - Moved in 1980 to 1989 (%)
Year householder moved into unit - Moved in 1970 to 1979 (%)
Year householder moved into unit - Moved in 1969 or earlier (%)
Means of transportation to work - Drove car alone (%)
Means of transportation to work - Carpooled (%)
Means of transportation to work - Public transportation (%)
Means of transportation to work - Bus or trolley bus (%)
Means of transportation to work - Streetcar or trolley car (%)
Means of transportation to work - Subway or elevated (%)
Means of transportation to work - Railroad (%)
Means of transportation to work - Ferryboat (%)
Means of transportation to work - Taxicab (%)
Means of transportation to work - Motorcycle (%)
Means of transportation to work - Bicycle (%)
Means of transportation to work - Walked (%)
Means of transportation to work - Other means (%)
Working at home (%)
Industry diversity
Most Common Industries - Agriculture, forestry, fishing and hunting, and mining (%)
Most Common Industries - Agriculture, forestry, fishing and hunting (%)
Most Common Industries - Mining, quarrying, and oil and gas extraction (%)
Most Common Industries - Construction (%)
Most Common Industries - Manufacturing (%)
Most Common Industries - Wholesale trade (%)
Most Common Industries - Retail trade (%)
Most Common Industries - Transportation and warehousing, and utilities (%)
Most Common Industries - Transportation and warehousing (%)
Most Common Industries - Utilities (%)
Most Common Industries - Information (%)
Most Common Industries - Finance and insurance, and real estate and rental and leasing (%)
Most Common Industries - Finance and insurance (%)
Most Common Industries - Real estate and rental and leasing (%)
Most Common Industries - Professional, scientific, and management, and administrative and waste management services (%)
Most Common Industries - Professional, scientific, and technical services (%)
Most Common Industries - Management of companies and enterprises (%)
Most Common Industries - Administrative and support and waste management services (%)
Most Common Industries - Educational services, and health care and social assistance (%)
Most Common Industries - Educational services (%)
Most Common Industries - Health care and social assistance (%)
Most Common Industries - Arts, entertainment, and recreation, and accommodation and food services (%)
Most Common Industries - Arts, entertainment, and recreation (%)
Most Common Industries - Accommodation and food services (%)
Most Common Industries - Other services, except public administration (%)
Most Common Industries - Public administration (%)
Occupation diversity
Most Common Occupations - Management, business, science, and arts occupations (%)
Most Common Occupations - Management, business, and financial occupations (%)
Most Common Occupations - Management occupations (%)
Most Common Occupations - Business and financial operations occupations (%)
Most Common Occupations - Computer, engineering, and science occupations (%)
Most Common Occupations - Computer and mathematical occupations (%)
Most Common Occupations - Architecture and engineering occupations (%)
Most Common Occupations - Life, physical, and social science occupations (%)
Most Common Occupations - Education, legal, community service, arts, and media occupations (%)
Most Common Occupations - Community and social service occupations (%)
Most Common Occupations - Legal occupations (%)
Most Common Occupations - Education, training, and library occupations (%)
Most Common Occupations - Arts, design, entertainment, sports, and media occupations (%)
Most Common Occupations - Healthcare practitioners and technical occupations (%)
Most Common Occupations - Health diagnosing and treating practitioners and other technical occupations (%)
Most Common Occupations - Health technologists and technicians (%)
Most Common Occupations - Service occupations (%)
Most Common Occupations - Healthcare support occupations (%)
Most Common Occupations - Protective service occupations (%)
Most Common Occupations - Fire fighting and prevention, and other protective service workers including supervisors (%)
Most Common Occupations - Law enforcement workers including supervisors (%)
Most Common Occupations - Food preparation and serving related occupations (%)
Most Common Occupations - Building and grounds cleaning and maintenance occupations (%)
Most Common Occupations - Personal care and service occupations (%)
Most Common Occupations - Sales and office occupations (%)
Most Common Occupations - Sales and related occupations (%)
Most Common Occupations - Office and administrative support occupations (%)
Most Common Occupations - Natural resources, construction, and maintenance occupations (%)
Most Common Occupations - Farming, fishing, and forestry occupations (%)
Most Common Occupations - Construction and extraction occupations (%)
Most Common Occupations - Installation, maintenance, and repair occupations (%)
Most Common Occupations - Production, transportation, and material moving occupations (%)
Most Common Occupations - Production occupations (%)
Most Common Occupations - Transportation occupations (%)
Most Common Occupations - Material moving occupations (%)
People in Group quarters - Institutionalized population (%)
People in Group quarters - Correctional institutions (%)
People in Group quarters - Federal prisons and detention centers (%)
People in Group quarters - Halfway houses (%)
People in Group quarters - Local jails and other confinement facilities (including police lockups) (%)
People in Group quarters - Military disciplinary barracks (%)
People in Group quarters - State prisons (%)
People in Group quarters - Other types of correctional institutions (%)
People in Group quarters - Nursing homes (%)
People in Group quarters - Hospitals/wards, hospices, and schools for the handicapped (%)
People in Group quarters - Hospitals/wards and hospices for chronically ill (%)
People in Group quarters - Hospices or homes for chronically ill (%)
People in Group quarters - Military hospitals or wards for chronically ill (%)
People in Group quarters - Other hospitals or wards for chronically ill (%)
People in Group quarters - Hospitals or wards for drug/alcohol abuse (%)
People in Group quarters - Mental (Psychiatric) hospitals or wards (%)
People in Group quarters - Schools, hospitals, or wards for the mentally retarded (%)
People in Group quarters - Schools, hospitals, or wards for the physically handicapped (%)
People in Group quarters - Institutions for the deaf (%)
People in Group quarters - Institutions for the blind (%)
People in Group quarters - Orthopedic wards and institutions for the physically handicapped (%)
People in Group quarters - Wards in general hospitals for patients who have no usual home elsewhere (%)
People in Group quarters - Wards in military hospitals for patients who have no usual home elsewhere (%)
People in Group quarters - Juvenile institutions (%)
People in Group quarters - Long-term care (%)
People in Group quarters - Homes for abused, dependent, and neglected children (%)
People in Group quarters - Residential treatment centers for emotionally disturbed children (%)
People in Group quarters - Training schools for juvenile delinquents (%)
People in Group quarters - Short-term care, detention or diagnostic centers for delinquent children (%)
People in Group quarters - Type of juvenile institution unknown (%)
People in Group quarters - Noninstitutionalized population (%)
People in Group quarters - College dormitories (includes college quarters off campus) (%)
People in Group quarters - Military quarters (%)
People in Group quarters - On base (%)
People in Group quarters - Barracks, unaccompanied personnel housing (UPH), (Enlisted/Officer), ;and similar group living quarters for military personnel (%)
People in Group quarters - Transient quarters for temporary residents (%)
People in Group quarters - Military ships (%)
People in Group quarters - Group homes (%)
People in Group quarters - Homes or halfway houses for drug/alcohol abuse (%)
People in Group quarters - Homes for the mentally ill (%)
People in Group quarters - Homes for the mentally retarded (%)
People in Group quarters - Homes for the physically handicapped (%)
People in Group quarters - Other group homes (%)
People in Group quarters - Religious group quarters (%)
People in Group quarters - Dormitories (%)
People in Group quarters - Agriculture workers' dormitories on farms (%)
People in Group quarters - Job Corps and vocational training facilities (%)
People in Group quarters - Other workers' dormitories (%)
People in Group quarters - Crews of maritime vessels (%)
People in Group quarters - Other nonhousehold living situations (%)
People in Group quarters - Other noninstitutional group quarters (%)
Residents speaking English at home (%)
Residents speaking English at home - Born in the United States (%)
Residents speaking English at home - Native, born elsewhere (%)
Residents speaking English at home - Foreign born (%)
Residents speaking Spanish at home (%)
Residents speaking Spanish at home - Born in the United States (%)
Residents speaking Spanish at home - Native, born elsewhere (%)
Residents speaking Spanish at home - Foreign born (%)
Residents speaking other language at home (%)
Residents speaking other language at home - Born in the United States (%)
Residents speaking other language at home - Native, born elsewhere (%)
Residents speaking other language at home - Foreign born (%)
Class of Workers - Employee of private company (%)
Class of Workers - Self-employed in own incorporated business (%)
Class of Workers - Private not-for-profit wage and salary workers (%)
Class of Workers - Local government workers (%)
Class of Workers - State government workers (%)
Class of Workers - Federal government workers (%)
Class of Workers - Self-employed workers in own not incorporated business and Unpaid family workers (%)
House heating fuel used in houses and condos - Utility gas (%)
House heating fuel used in houses and condos - Bottled, tank, or LP gas (%)
House heating fuel used in houses and condos - Electricity (%)
House heating fuel used in houses and condos - Fuel oil, kerosene, etc. (%)
House heating fuel used in houses and condos - Coal or coke (%)
House heating fuel used in houses and condos - Wood (%)
House heating fuel used in houses and condos - Solar energy (%)
House heating fuel used in houses and condos - Other fuel (%)
House heating fuel used in houses and condos - No fuel used (%)
House heating fuel used in apartments - Utility gas (%)
House heating fuel used in apartments - Bottled, tank, or LP gas (%)
House heating fuel used in apartments - Electricity (%)
House heating fuel used in apartments - Fuel oil, kerosene, etc. (%)
House heating fuel used in apartments - Coal or coke (%)
House heating fuel used in apartments - Wood (%)
House heating fuel used in apartments - Solar energy (%)
House heating fuel used in apartments - Other fuel (%)
House heating fuel used in apartments - No fuel used (%)
Armed forces status - In Armed Forces (%)
Armed forces status - Civilian (%)
Armed forces status - Civilian - Veteran (%)
Armed forces status - Civilian - Nonveteran (%)
Fatal accidents locations in years 2005-2021
Fatal accidents locations in 2005
Fatal accidents locations in 2006
Fatal accidents locations in 2007
Fatal accidents locations in 2008
Fatal accidents locations in 2009
Fatal accidents locations in 2010
Fatal accidents locations in 2011
Fatal accidents locations in 2012
Fatal accidents locations in 2013
Fatal accidents locations in 2014
Fatal accidents locations in 2015
Fatal accidents locations in 2016
Fatal accidents locations in 2017
Fatal accidents locations in 2018
Fatal accidents locations in 2019
Fatal accidents locations in 2020
Fatal accidents locations in 2021
Alcohol use - People drinking some alcohol every month (%)
Alcohol use - People not drinking at all (%)
Alcohol use - Average days/month drinking alcohol
Alcohol use - Average drinks/week
Alcohol use - Average days/year people drink much
Audiometry - Average condition of hearing (%)
Audiometry - People that can hear a whisper from across a quiet room (%)
Audiometry - People that can hear normal voice from across a quiet room (%)
Audiometry - Ears ringing, roaring, buzzing (%)
Audiometry - Had a job exposure to loud noise (%)
Audiometry - Had off-work exposure to loud noise (%)
Blood Pressure & Cholesterol - Has high blood pressure (%)
Blood Pressure & Cholesterol - Checking blood pressure at home (%)
Blood Pressure & Cholesterol - Frequently checking blood cholesterol (%)
Blood Pressure & Cholesterol - Has high cholesterol level (%)
Consumer Behavior - Money monthly spent on food at supermarket/grocery store
Consumer Behavior - Money monthly spent on food at other stores
Consumer Behavior - Money monthly spent on eating out
Consumer Behavior - Money monthly spent on carryout/delivered foods
Consumer Behavior - Income spent on food at supermarket/grocery store (%)
Consumer Behavior - Income spent on food at other stores (%)
Consumer Behavior - Income spent on eating out (%)
Consumer Behavior - Income spent on carryout/delivered foods (%)
Current Health Status - General health condition (%)
Current Health Status - Blood donors (%)
Current Health Status - Has blood ever tested for HIV virus (%)
Current Health Status - Left-handed people (%)
Dermatology - People using sunscreen (%)
Diabetes - Diabetics (%)
Diabetes - Had a blood test for high blood sugar (%)
Diabetes - People taking insulin (%)
Diet Behavior & Nutrition - Diet health (%)
Diet Behavior & Nutrition - Milk product consumption (# of products/month)
Diet Behavior & Nutrition - Meals not home prepared (#/week)
Diet Behavior & Nutrition - Meals from fast food or pizza place (#/week)
Diet Behavior & Nutrition - Ready-to-eat foods (#/month)
Diet Behavior & Nutrition - Frozen meals/pizza (#/month)
Drug Use - People that ever used marijuana or hashish (%)
Drug Use - Ever used hard drugs (%)
Drug Use - Ever used any form of cocaine (%)
Drug Use - Ever used heroin (%)
Drug Use - Ever used methamphetamine (%)
Health Insurance - People covered by health insurance (%)
Kidney Conditions-Urology - Avg. # of times urinating at night
Medical Conditions - People with asthma (%)
Medical Conditions - People with anemia (%)
Medical Conditions - People with psoriasis (%)
Medical Conditions - People with overweight (%)
Medical Conditions - Elderly people having difficulties in thinking or remembering (%)
Medical Conditions - People who ever received blood transfusion (%)
Medical Conditions - People having trouble seeing even with glass/contacts (%)
Medical Conditions - People with arthritis (%)
Medical Conditions - People with gout (%)
Medical Conditions - People with congestive heart failure (%)
Medical Conditions - People with coronary heart disease (%)
Medical Conditions - People with angina pectoris (%)
Medical Conditions - People who ever had heart attack (%)
Medical Conditions - People who ever had stroke (%)
Medical Conditions - People with emphysema (%)
Medical Conditions - People with thyroid problem (%)
Medical Conditions - People with chronic bronchitis (%)
Medical Conditions - People with any liver condition (%)
Medical Conditions - People who ever had cancer or malignancy (%)
Mental Health - People who have little interest in doing things (%)
Mental Health - People feeling down, depressed, or hopeless (%)
Mental Health - People who have trouble sleeping or sleeping too much (%)
Mental Health - People feeling tired or having little energy (%)
Mental Health - People with poor appetite or overeating (%)
Mental Health - People feeling bad about themself (%)
Mental Health - People who have trouble concentrating on things (%)
Mental Health - People moving or speaking slowly or too fast (%)
Mental Health - People having thoughts they would be better off dead (%)
Oral Health - Average years since last visit a dentist
Oral Health - People embarrassed because of mouth (%)
Oral Health - People with gum disease (%)
Oral Health - General health of teeth and gums (%)
Oral Health - Average days a week using dental floss/device
Oral Health - Average days a week using mouthwash for dental problem
Oral Health - Average number of teeth
Pesticide Use - Households using pesticides to control insects (%)
Pesticide Use - Households using pesticides to kill weeds (%)
Physical Activity - People doing vigorous-intensity work activities (%)
Physical Activity - People doing moderate-intensity work activities (%)
Physical Activity - People walking or bicycling (%)
Physical Activity - People doing vigorous-intensity recreational activities (%)
Physical Activity - People doing moderate-intensity recreational activities (%)
Physical Activity - Average hours a day doing sedentary activities
Physical Activity - Average hours a day watching TV or videos
Physical Activity - Average hours a day using computer
Physical Functioning - People having limitations keeping them from working (%)
Physical Functioning - People limited in amount of work they can do (%)
Physical Functioning - People that need special equipment to walk (%)
Physical Functioning - People experiencing confusion/memory problems (%)
Physical Functioning - People requiring special healthcare equipment (%)
Prescription Medications - Average number of prescription medicines taking
Preventive Aspirin Use - Adults 40+ taking low-dose aspirin (%)
Reproductive Health - Vaginal deliveries (%)
Reproductive Health - Cesarean deliveries (%)
Reproductive Health - Deliveries resulted in a live birth (%)
Reproductive Health - Pregnancies resulted in a delivery (%)
Reproductive Health - Women breastfeeding newborns (%)
Reproductive Health - Women that had a hysterectomy (%)
Reproductive Health - Women that had both ovaries removed (%)
Reproductive Health - Women that have ever taken birth control pills (%)
Reproductive Health - Women taking birth control pills (%)
Reproductive Health - Women that have ever used Depo-Provera or injectables (%)
Reproductive Health - Women that have ever used female hormones (%)
Sexual Behavior - People 18+ that ever had sex (vaginal, anal, or oral) (%)
Sexual Behavior - Males 18+ that ever had vaginal sex with a woman (%)
Sexual Behavior - Males 18+ that ever performed oral sex on a woman (%)
Sexual Behavior - Males 18+ that ever had anal sex with a woman (%)
Sexual Behavior - Males 18+ that ever had any sex with a man (%)
Sexual Behavior - Females 18+ that ever had vaginal sex with a man (%)
Sexual Behavior - Females 18+ that ever performed oral sex on a man (%)
Sexual Behavior - Females 18+ that ever had anal sex with a man (%)
Sexual Behavior - Females 18+ that ever had any kind of sex with a woman (%)
Sexual Behavior - Average age people first had sex
Sexual Behavior - Average number of female sex partners in lifetime (males 18+)
Sexual Behavior - Average number of female vaginal sex partners in lifetime (males 18+)
Sexual Behavior - Average age people first performed oral sex on a woman (18+)
Sexual Behavior - Average number of woman performed oral sex on in lifetime (18+)
Sexual Behavior - Average number of male sex partners in lifetime (males 18+)
Sexual Behavior - Average number of male anal sex partners in lifetime (males 18+)
Sexual Behavior - Average age people first performed oral sex on a man (18+)
Sexual Behavior - Average number of male oral sex partners in lifetime (18+)
Sexual Behavior - People using protection when performing oral sex (%)
Sexual Behavior - Average number of times people have vaginal or anal sex a year
Sexual Behavior - People having sex without condom (%)
Sexual Behavior - Average number of male sex partners in lifetime (females 18+)
Sexual Behavior - Average number of male vaginal sex partners in lifetime (females 18+)
Sexual Behavior - Average number of female sex partners in lifetime (females 18+)
Sexual Behavior - Circumcised males 18+ (%)
Sleep Disorders - Average hours sleeping at night
Sleep Disorders - People that has trouble sleeping (%)
Smoking-Cigarette Use - People smoking cigarettes (%)
Taste & Smell - People 40+ having problems with smell (%)
Taste & Smell - People 40+ having problems with taste (%)
Taste & Smell - People 40+ that ever had wisdom teeth removed (%)
Taste & Smell - People 40+ that ever had tonsils teeth removed (%)
Taste & Smell - People 40+ that ever had a loss of consciousness because of a head injury (%)
Taste & Smell - People 40+ that ever had a broken nose or other serious injury to face or skull (%)
Taste & Smell - People 40+ that ever had two or more sinus infections (%)
Weight - Average height (inches)
Weight - Average weight (pounds)
Weight - Average BMI
Weight - People that are obese (%)
Weight - People that ever were obese (%)
Weight - People trying to lose weight (%)
100%
urban population.
Estimated median house/condo value in 2022: $246,078
45419:
$246,078Ohio:
$204,100
According to our research of Ohio and other state lists, there were 16 registered sex offenders living in 45419 zip code as of April 25, 2024 . The ratio of all residents to sex offenders in zip code 45419 is 945 to 1.The ratio of registered sex offenders to all residents in this zip code is lower than the state average.
Median resident age: This zip code:
35.9 yearsOhio median age:
39.9 years
Average household size: This zip code:
2.3 peopleOhio:
2.4 people
Averages for the 2020 tax year for zip code 45419, filed in 2021:
Average Adjusted Gross Income (AGI) in 2020: $112,441 (Individual Income Tax Returns) Here:
$112,441State:
$67,288
Salary/wage: $82,506 (reported on 84.4% of returns )Here:
$82,506State:
$55,628
(% of AGI for various income ranges: 1206.2% for AGIs below $25k , 3748.0% for AGIs $25k-50k , 6772.7% for AGIs $50k-75k , 10007.9% for AGIs $75k-100k , 19825.2% for AGIs $100k-200k , 116459.0% for AGIs over 200k ) Taxable interest for individuals: $2,393 (reported on 40.0% of returns )This zip code:
$2,393Ohio:
$1,518
(% of AGI for various income ranges: 15.5% for AGIs below $25k , 17.5% for AGIs $25k-50k , 41.2% for AGIs $50k-75k , 71.3% for AGIs $75k-100k , 132.2% for AGIs $100k-200k , 2757.5% for AGIs over 200k ) Ordinary dividends: $21,069 (reported on 29.2% of returns )(% of AGI for various income ranges: 46.1% for AGIs below $25k , 79.9% for AGIs $25k-50k , 151.0% for AGIs $50k-75k , 270.4% for AGIs $75k-100k , 671.5% for AGIs $100k-200k , 19956.5% for AGIs over 200k ) Net capital gain/loss in AGI: +$32,797 (reported on 26.6% of returns )Here:
+$32,797State:
+$18,919
(% of AGI for various income ranges: 22.3% for AGIs below $25k , 63.7% for AGIs $25k-50k , 118.4% for AGIs $50k-75k , 223.8% for AGIs $75k-100k , 743.9% for AGIs $100k-200k , 30531.5% for AGIs over 200k ) Profit/loss from business: +$17,351 (reported on 16.3% of returns )Here:
+$17,351State:
+$13,744
(% of AGI for various income ranges: 103.1% for AGIs below $25k , 126.8% for AGIs $25k-50k , 221.4% for AGIs $50k-75k , 342.1% for AGIs $75k-100k , 784.1% for AGIs $100k-200k , 4950.0% for AGIs over 200k ) Taxable individual retirement arrangement distribution: $25,496 (reported on 10.0% of returns )45419:
$25,496Ohio:
$18,876
(% of AGI for various income ranges: 65.4% for AGIs below $25k , 128.0% for AGIs $25k-50k , 236.3% for AGIs $50k-75k , 292.5% for AGIs $75k-100k , 857.7% for AGIs $100k-200k , 3946.5% for AGIs over 200k ) Self-employed (Keogh) retirement plans: $26,478 (reported on 1.1% of returns )45419:
$26,478Ohio:
$24,898
(% of AGI for various income ranges: 69.2% for AGIs $100k-200k , 918.0% for AGIs over 200k ) Total itemized deductions: $39,668 (reported on 10.0% of returns )Here:
$39,668State:
$33,869
(% of AGI for various income ranges: 46.7% for AGIs below $25k , 106.9% for AGIs $25k-50k , 206.5% for AGIs $50k-75k , 407.7% for AGIs $75k-100k , 970.0% for AGIs $100k-200k , 9329.5% for AGIs over 200k ) Charity contributions: $20,022 (reported on 8.4% of returns )Here:
$20,022State:
$14,577
(% of AGI for various income ranges: 14.3% for AGIs $25k-50k , 29.3% for AGIs $50k-75k , 98.1% for AGIs $75k-100k , 269.7% for AGIs $100k-200k , 5277.5% for AGIs over 200k ) Taxes paid: $8,694 (reported on 9.9% of returns )(% of AGI for various income ranges: 8.7% for AGIs below $25k , 18.8% for AGIs $25k-50k , 68.1% for AGIs $50k-75k , 138.3% for AGIs $75k-100k , 289.6% for AGIs $100k-200k , 1517.0% for AGIs over 200k ) Earned income credit: $1,799 (reported on 9.3% of returns )(% of AGI for various income ranges: 60.2% for AGIs below $25k , 39.4% for AGIs $25k-50k ) Percentage of individuals using paid preparers for their 2020 taxes: 93.1%(% for various income ranges: 91.2% for AGIs below $25k , 94.0% for AGIs $25k-50k , 94.0% for AGIs $50k-75k , 93.7% for AGIs $75k-100k , 92.7% for AGIs $100k-200k , 94.8% for AGIs over 200k )
Averages for the 2012 tax year for zip code 45419, filed in 2013:
Average Adjusted Gross Income (AGI) in 2012: $108,186 (Individual Income Tax Returns) Here:
$108,186State:
$54,926
Salary/wage: $68,438 (reported on 83.0% of returns )Here:
$68,438State:
$45,869
(% of AGI for various income ranges: 73.1% for AGIs below $25k , 75.8% for AGIs $25k-50k , 78.1% for AGIs $50k-75k , 76.2% for AGIs $75k-100k , 74.2% for AGIs $100k-200k , 33.6% for AGIs over 200k ) Taxable interest for individuals: $2,262 (reported on 43.1% of returns )This zip code:
$2,262Ohio:
$1,297
(% of AGI for various income ranges: 1.2% for AGIs below $25k , 0.6% for AGIs $25k-50k , 0.7% for AGIs $50k-75k , 0.7% for AGIs $75k-100k , 0.9% for AGIs $100k-200k , 1.0% for AGIs over 200k ) Ordinary dividends: $18,368 (reported on 31.7% of returns )(% of AGI for various income ranges: 3.3% for AGIs below $25k , 1.8% for AGIs $25k-50k , 2.2% for AGIs $50k-75k , 2.5% for AGIs $75k-100k , 2.9% for AGIs $100k-200k , 7.7% for AGIs over 200k ) Net capital gain/loss in AGI: +$23,157 (reported on 25.8% of returns )Here:
+$23,157State:
+$11,232
(% of AGI for various income ranges: 0.9% for AGIs below $25k , 0.8% for AGIs $25k-50k , 0.8% for AGIs $50k-75k , 1.2% for AGIs $75k-100k , 2.3% for AGIs $100k-200k , 8.8% for AGIs over 200k ) Profit/loss from business: +$15,788 (reported on 15.2% of returns )Here:
+$15,788State:
+$12,773
(% of AGI for various income ranges: 6.9% for AGIs below $25k , 3.2% for AGIs $25k-50k , 1.7% for AGIs $50k-75k , 3.0% for AGIs $75k-100k , 4.1% for AGIs $100k-200k , 1.1% for AGIs over 200k ) Taxable individual retirement arrangement distribution: $23,173 (reported on 11.9% of returns )45419:
$23,173Ohio:
$14,511
(% of AGI for various income ranges: 3.3% for AGIs below $25k , 2.4% for AGIs $25k-50k , 2.4% for AGIs $50k-75k , 2.6% for AGIs $75k-100k , 3.6% for AGIs $100k-200k , 2.2% for AGIs over 200k ) Self-employment retirement plans: $26,291 (reported on 1.4% of returns )45419:
$26,291Ohio:
$20,257
(% of AGI for various income ranges: 0.7% for AGIs $100k-200k , 0.4% for AGIs over 200k ) Total itemized deductions: $30,344 (15% of AGI, reported on 44.7% of returns )Here:
$30,344State:
$21,278
Here:
14.8% of AGIState:
18.8% of AGI
(% of AGI for various income ranges: 9.8% for AGIs below $25k , 10.8% for AGIs $25k-50k , 15.1% for AGIs $50k-75k , 15.1% for AGIs $75k-100k , 17.7% for AGIs $100k-200k , 10.5% for AGIs over 200k ) Charity contributions: $6,237 (reported on 36.7% of returns )(% of AGI for various income ranges: 0.7% for AGIs below $25k , 1.1% for AGIs $25k-50k , 1.7% for AGIs $50k-75k , 1.7% for AGIs $75k-100k , 2.4% for AGIs $100k-200k , 2.4% for AGIs over 200k ) Taxes paid: $15,853 (reported on 44.4% of returns )45419:
$15,853State:
$9,568
(% of AGI for various income ranges: 3.2% for AGIs below $25k , 3.8% for AGIs $25k-50k , 6.2% for AGIs $50k-75k , 7.2% for AGIs $75k-100k , 9.2% for AGIs $100k-200k , 6.1% for AGIs over 200k ) Earned income credit: $1,887 (reported on 10.5% of returns )(% of AGI for various income ranges: 4.1% for AGIs below $25k , 0.6% for AGIs $25k-50k ) Percentage of individuals using paid preparers for their 2012 taxes: 46.5%(% for various income ranges: 40.1% for AGIs below $25k , 44.2% for AGIs $25k-50k , 48.3% for AGIs $50k-75k , 45.7% for AGIs $75k-100k , 48.2% for AGIs $100k-200k , 77.8% for AGIs over 200k )
Averages for the 2004 tax year for zip code 45419, filed in 2005:
Average Adjusted Gross Income (AGI) in 2004: $71,979 (Individual Income Tax Returns) Here:
$71,979State:
$44,480
Salary/wage: $58,696 (reported on 82.1% of returns )Here:
$58,696State:
$39,198
(% of AGI for various income ranges: 90.2% for AGIs below $10k , 70.3% for AGIs $10k-25k , 79.9% for AGIs $25k-50k , 80.3% for AGIs $50k-75k , 79.7% for AGIs $75k-100k , 58.2% for AGIs over 100k ) Taxable interest for individuals: $2,396 (reported on 55.0% of returns )This zip code:
$2,396Ohio:
$1,532
(% of AGI for various income ranges: 5.7% for AGIs below $10k , 3.5% for AGIs $10k-25k , 1.5% for AGIs $25k-50k , 1.5% for AGIs $50k-75k , 1.3% for AGIs $75k-100k , 1.9% for AGIs over 100k ) Taxable dividends: $6,424 (reported on 39.1% of returns )(% of AGI for various income ranges: 8.7% for AGIs below $10k , 3.0% for AGIs $10k-25k , 2.0% for AGIs $25k-50k , 2.0% for AGIs $50k-75k , 2.1% for AGIs $75k-100k , 4.4% for AGIs over 100k ) Net capital gain/loss: +$15,593 (reported on 31.7% of returns )Here:
+$15,593State:
+$8,582
(% of AGI for various income ranges: -1.4% for AGIs below $10k , 0.8% for AGIs $10k-25k , 0.8% for AGIs $25k-50k , 1.4% for AGIs $50k-75k , 1.3% for AGIs $75k-100k , 11.0% for AGIs over 100k ) Profit/loss from business: +$17,706 (reported on 14.4% of returns )Here:
+$17,706State:
+$10,813
(% of AGI for various income ranges: 3.9% for AGIs below $10k , 5.2% for AGIs $10k-25k , 3.0% for AGIs $25k-50k , 3.2% for AGIs $50k-75k , 4.4% for AGIs $75k-100k , 3.5% for AGIs over 100k ) IRA payment deduction: $2,974 (reported on 2.4% of returns )(% of AGI for various income ranges: 0.2% for AGIs $10k-25k , 0.2% for AGIs $25k-50k , 0.1% for AGIs $50k-75k , 0.1% for AGIs $75k-100k , 0.1% for AGIs over 100k ) Self-employed pension: $16,406 (reported on 2.0% of returns )(% of AGI for various income ranges: 0.2% for AGIs $10k-25k , 0.2% for AGIs $50k-75k , 0.2% for AGIs $75k-100k , 0.7% for AGIs over 100k ) Total itemized deductions: $23,589 (19% of AGI, reported on 48.9% of returns )Here:
$23,589State:
$17,503
Here:
19.2% of AGIState:
20.8% of AGI
(% of AGI for various income ranges: 20.3% for AGIs below $10k , 11.6% for AGIs $10k-25k , 13.9% for AGIs $25k-50k , 18.1% for AGIs $50k-75k , 18.9% for AGIs $75k-100k , 15.7% for AGIs over 100k ) Charity contributions deductions: $4,552 (3% of AGI, reported on 42.1% of returns )Here:
3.4% of AGIState:
3.4% of AGI
(% of AGI for various income ranges: 0.9% for AGIs below $10k , 1.1% for AGIs $10k-25k , 1.4% for AGIs $25k-50k , 2.0% for AGIs $50k-75k , 2.4% for AGIs $75k-100k , 3.3% for AGIs over 100k ) Total tax: $13,984 (reported on 81.5% of returns )45419:
$13,984State:
$6,781
(% of AGI for various income ranges: 2.5% for AGIs below $10k , 4.8% for AGIs $10k-25k , 8.1% for AGIs $25k-50k , 9.6% for AGIs $50k-75k , 10.6% for AGIs $75k-100k , 20.8% for AGIs over 100k ) Earned income credit: $1,232 (reported on 6.7% of returns )Percentage of individuals using paid preparers for their 2004 taxes: 48.7%(% for various income ranges: 44.7% for AGIs below $10k , 47.0% for AGIs $10k-25k , 45.7% for AGIs $25k-50k , 49.0% for AGIs $50k-75k , 45.8% for AGIs $75k-100k , 61.4% for AGIs over 100k )
Estimated median household income in 2022: This zip code:
$80,625Ohio:
$65,720
Nearest zip codes: 45409 ,
45429 ,
45410 ,
45420 ,
45439 ,
45403 .
Oakwood Zip Code Map
Percentage of family households: This zip code:
46.2%Ohio:
43.3%
Percentage of households with unmarried partners: This zip code:
5.7%Ohio:
44.6%
Likely homosexual households (counted as self-reported same-sex unmarried-partner households)
Lesbian couples: 0.3% of all households Gay men: 0.1% of all households
Household received Food Stamps/SNAP in the past 12 months: 579Household did not receive Food Stamps/SNAP in the past 12 months: 6,744
Women who had a birth in the past 12 months: 239 (118 now married , 119 unmarried) Women who did not have a birth in the past 12 months: 4,039 (1,732 now married , 2,307 unmarried)
Housing units in zip code 45419 with a mortgage: 3,516 (424
second mortgage , 426
both second mortgage and home equity loan )
Houses without a mortgage: 69
Median monthly owner costs for units with a mortgage: $1,541
Median monthly owner costs for units without a mortgage: $805
Residents with income below the poverty level in 2022:
This zip code:
8.3%Whole state:
13.4%
Residents with income below 50% of the poverty level in 2022:
This zip code:
4.7%Whole state:
7.0%
Median number of rooms in houses and condos: Median number of rooms in apartments: Notable locations in this zip code not listed on our city pages
Click to draw/clear zip code borders Notable location: (A) . Display/hide its location on the map
Shopping Center: (1) . Display/hide its location on the map
Churches in zip code 45419 include: (A) , Shroyer Road Baptist Church (B) , Patterson Park Church (C) , Far Hills Seventh Day Adventist Church (D) , Oakwood United Methodist Church (E) , Concordia Lutheran Church (F) . Display/hide their locations on the map
Parks in zip code 45419 include: (1) , Shafor Park (2) , Orcherly Park (3) , Loy Park (4) , Houk Stream Park (5) , Jane Newcom Park (6) , Elizabeth Gardens Park (7) . Display/hide their locations on the map
Year house built (houses)
0 2020 or later121 2010 to 201987 2000 to 2009135 1990 to 1999167 1980 to 1989481 1970 to 1979732 1960 to 19691,990 1950 to 19591,713 1940 to 19491,993 1939 or earlier
Zip code 45419 household income distribution in 2022 293 Less than $10,000251 $10,000 to $14,999286 $15,000 to $19,99980 $20,000 to $24,999227 $25,000 to $29,999278 $30,000 to $34,999224 $35,000 to $39,999183 $40,000 to $44,999388 $45,000 to $49,999458 $50,000 to $59,999599 $60,000 to $74,9991,085 $75,000 to $99,999756 $100,000 to $124,999312 $125,000 to $149,999729 $150,000 to $199,9991,161 $200,000 or moreEstimate of home value of owner-occupied houses/condos in 2022 in zip code 45419 17 Less than $10,0003 $15,000 to $19,9997 $25,000 to $29,99919 $30,000 to $34,99911 $35,000 to $39,99911 $40,000 to $49,99949 $50,000 to $59,99916 $60,000 to $69,99915 $70,000 to $79,99974 $80,000 to $89,99970 $90,000 to $99,999219 $100,000 to $124,999481 $125,000 to $149,999496 $150,000 to $174,999359 $175,000 to $199,999766 $200,000 to $249,999535 $250,000 to $299,999811 $300,000 to $399,999517 $400,000 to $499,999274 $500,000 to $749,999124 $750,000 to $999,99974 $1,000,000 to $1,499,99919 $1,500,000 to $1,999,99924 $2,000,000 or moreRent paid by renters in 2022 in zip code 45419 62 $100 to $1497 $250 to $29922 $300 to $34951 $350 to $39922 $400 to $44924 $450 to $499117 $500 to $549248 $550 to $599150 $600 to $649202 $650 to $69997 $700 to $749225 $750 to $799219 $800 to $899266 $900 to $999207 $1,000 to $1,249171 $1,250 to $1,499250 $1,500 to $1,99911 $2,000 to $2,49942 No cash rent
Median gross rent in 2022: $901.
Median price asked for vacant for-sale houses and condos in 2022: $200,344.
Estimated median house (or condo) value in 2022 for: White Non-Hispanic householders: $246,832Black or African American householders: $200,445American Indian or Alaska Native householders: $122,567Asian householders: $164,617Two or more races householders: $135,578Hispanic or Latino householders: $239,101Estimated median house or condo value in 2022: $246,078
45419:
$246,078Ohio:
$204,100
Lower value quartile - upper value quartile: $162,647 - $384,320
Mean price in 2022: Detached houses: $186,710Here:
$186,710State:
$254,366
Townhouses or other attached units: $181,085Here:
$181,085State:
$225,733
In 2-unit structures: $149,132Here:
$149,132State:
$144,384
In 3-to-4-unit structures: $103,103Here:
$103,103State:
$203,002
In 5-or-more-unit structures: $75,492Here:
$75,492State:
$211,593
Mobile homes: $25,706Here:
$25,706State:
$62,719
Housing units in structures:
One, detached: 5,438One, attached: 154Two: 2343 or 4: 1,0025 to 9: 29310 to 19: 19620 to 49: 189Mobile homes: 51Unemployment : 2.3%
Means of transportation to work in zip code 45419 74.5% 6,975 Drove a car alone5.0% 464 Carpooled0.9% 85 Bus or trolley bus0.8% 71 Bicycle2.9% 268 Walked0.7% 68 Other means15.7% 1,472 Worked at homeTravel time to work (commute) in zip code 45419 258 Less than 5 minutes978 5 to 9 minutes1,486 10 to 14 minutes1,789 15 to 19 minutes1,496 20 to 24 minutes549 25 to 29 minutes662 30 to 34 minutes117 35 to 39 minutes52 40 to 44 minutes239 45 to 59 minutes256 60 to 89 minutes65 90 or more minutes
Neighborhoods in zip code 45419: Percentage of zip code residents living and working in this county: 78.8%
Household type by relationship:
Households: 16,825
Male householders: 3,531 (981 living alone ), Female householders: 3,804 (1,538 living alone )3,177 spouses (3,153 opposite-sex spouses ), 795 unmarried partners , (721 opposite-sex unmarried partners ), 4,783 children (4,452 natural , 214 adopted , 126 stepchildren ), 17 grandchildren , 117 brothers or sisters , 59 parents , 6 foster children , 31 other relatives , 464 non-relatives In group quarters: 85 (-1 institutionalized population )
Size of family households: 1,700 2-persons , 1,078 3-persons , 927 4-persons , 334 5-persons , 98 6-persons , 8 7-or-more-persons
Size of nonfamily households: 2,521 1-person , 583 2-persons , 53 3-persons , 24 4-persons
3,084 married couples with children. single-parent households (317 men , 638 women ).
93.5% of residents of 45419 zip code speak English at home. of residents speak Spanish at home (78% very well, 22% not well ).of residents speak other Indo-European language at home (55% very well, 30% well, 15% not well ).of residents speak Asian or Pacific Island language at home (59% very well, 33% well, 5% not well, 3% not at all ).of residents speak other language at home (93% very well, 7% well ).
Foreign born population: 981 (5.8%)
(40.4%
of them are naturalized citizens )
This zip code:
5.8%Whole state:
5.0%
9% Ukraine 9% Malaysia 8% Sweden 6% Chile 5% Bhutan 2% Hong Kong 2% Belgium 21% German 18% English 7% American 6% Irish 6% European 3% Italian 2% Scottish
Year of entry for the foreign-born population
673 2010 or later 279 2000 to 2009 83 1990 to 1999 184 Before 1990
There are
80 Medical Specialists in Zip Code 45419 .
Facilities with environmental interests located in this zip code:
BEAVERTOWN ELEMENTARY SCHOOL (2700 WILMINGTON PIKE in KETTERING, OH)
(Geographic Names Information System) (National Center for Education Statistics) - STATE ID-001982 Organizations: KETTERING CITY SD (SCHOOL DISTRICT)
Housing units lacking complete kitchen facilities: 0.4%
81.6% Utility gas 16.7% Electricity 1.1% Bottled, tank, or LP gas
Population in 1990: 17,079.
Place of birth for U.S.-born residents:
This state: 10,860Northeast: 930Midwest: 1,623South: 1,437West: 805
54% of the 45419 zip code residents lived in the same house 5 years ago.
Out of people who lived in different houses, 62% lived in this county.
Out of people who lived in different counties, 50% lived in Ohio.
86% of the 45419 zip code residents lived in the same house 1 year ago.
Out of people who lived in different houses, 54% moved from this county.
Out of people who lived in different houses, 14% moved from different county within same state.
Out of people who lived in different houses, 23% moved from different state.
Out of people who lived in different houses, 8% moved from abroad.
Private vs. public school enrollment:
Students in private schools in grades 1 to 8 (elementary and middle school): 294
Students in private schools in grades 9 to 12 (high school): 35
Students in private undergraduate colleges: 375
Occupation by median earnings in the past 12 months ($)
155,141 Law enforcement workers including supervisors 113,117 Computer and mathematical occupations 105,600 Management occupations 102,900 Architecture and engineering occupations 82,790 Life, physical, and social science occupations 78,997 Health diagnosing and treating practitioners and other technical occupations
Companies with federal contracts located in this zip code (DAYTON, OH):
OHMCO LLC (1300 RALEIGH RD; small business) in 92 contracts from 1999 to 2006
Contracts for Antennas, Waveguides, and Related Equipment, Switches, Oscillators and Piezoelectric Crystals, Relays and Solenoids, and more by Defense Logistics Agency, Navy, Army, Air Force, and others Signed by year: 2000: $146,026; 2001: $923,262; 2002: $998,899; 2003: $62,778; 2004: $714,398; 2005: $353,160; 2006: $115,730.
Biggest contracts: with Defense Logistics Agency for Antennas, Waveguides, and Related Equipment. Signed on 2002-05-10. Completion date: 2003-02-04.
, same as above. Signed on 2002-07-12. Completion date: 2003-03-19.
with Navy for Antennas, Waveguides, and Related Equipment. Signed on 2001-08-16. Completion date: 2002-03-14.
with Defense Logistics Agency for Antennas, Waveguides, and Related Equipment. Signed on 2001-02-28. Completion date: 2002-05-04.
PROFICIENT INFORMATION TECHNOL (522 SHAFOR BLVD; small business) in 6 contracts from 2002 to 2005
Contracts for Programming Services, ADP Facility Operation and Maintenance Services by Air ForceSigned by year: 2000: $0; 2001: $0; 2002: $175,500; 2003: $138,066; 2004: $161,155; 2005: $165,155; 2006: $0.
Biggest contracts: with Air Force for Programming Services. Signed on 2005-07-26. Completion date: 2006-08-11.
with Air Force for ADP Facility Operation and Maintenance Services. Signed on 2004-08-10. Completion date: 2005-08-12.
, same as above. Signed on 2003-08-22. Completion date: 2004-08-13.
with Air Force for Programming Services. Signed on 2002-11-13. Completion date: 2003-08-15.
FUTURE TEK USA CORP (454 PATTERSON RD; small business) in 2 contracts from 2005 to 2006
$99,992 with Air Force for Physical Sciences -- Management and Support (R&D). Signed on 2005-08-01. Completion date: 2006-04-30.
with Air Force for Defense Aircraft -- Management and Support (R&D). Signed on 2006-04-04. Completion date: 2007-01-03.
STOOPS, GLENN A (52 IVANHOE; small business) in 4 contracts from 2004 to 2005
$9,240 with Air Force for Educational Services. Signed on 2004-07-01. Completion date: 2004-12-20.
, same as above. Signed on 2005-04-11. Completion date: 2005-06-24.
, same as above. Signed on 2005-06-14. Completion date: 2005-09-30.
, same as above. Signed on 2005-09-06. Completion date: 2005-12-09.
Top industries in this zip code by the number of employees in 2005:
Accommodation and Food Services: Limited-Service Restaurants (50-99 employees: 1 establishment, 20-49 employees: 3 establishments, 10-19 employees: 1 establishment, 5-9 employees: 2 establishments, 1-4 employees: 1 establishment)Health Care and Social Assistance: Offices of Physicians (except Mental Health Specialists) (20-49: 2, 10-19: 4, 5-9: 4, 1-4: 3)Accommodation and Food Services: Full-Service Restaurants (20-49: 3, 10-19: 2, 5-9: 1, 1-4: 1)Health Care and Social Assistance: Offices of Dentists (10-19: 3, 5-9: 5, 1-4: 3)Health Care and Social Assistance: Home Health Care Services (50-99: 1, 1-4: 1)Arts, Entertainment, and Recreation: Golf Courses and Country Clubs (50-99: 1)Construction: Roofing Contractors (50-99: 1)Other Services (except Public Administration): Car Washes (20-49: 2)
People in group quarters in 2010:
59 people in nursing facilities/skilled-nursing facilities
2 people in college/university student housing
People in group quarters in 2000:
41 people in nursing homes
Fatal accident statistics in 2013:
Fatal accident count: 1Vehicles involved in fatal accidents: 1Fatal accidents caused by drunken drivers: 0Fatalities: 1Persons involved in fatal accidents: 2Pedestrians involved in fatal accidents: 0
Home Mortgage Disclosure Act Aggregated Statistics For Year 2009(Based on 2 full and 10 partial tracts) A) FHA, FSA/RHS & VA B) Conventional C) Refinancings D) Home Improvement Loans E) Loans on Dwellings For 5+ Families F) Non-occupant Loans on Number Average Value Number Average Value Number Average Value Number Average Value Number Average Value Number Average Value
LOANS ORIGINATED 219 $132,287 213 $168,894 1,072 $169,869 45 $85,306 2 $1,201,950 36 $98,814 APPLICATIONS APPROVED, NOT ACCEPTED 8 $141,846 13 $155,222 74 $180,811 10 $49,098 0 $0 8 $124,862 APPLICATIONS DENIED 24 $133,437 19 $168,443 249 $192,682 40 $86,515 0 $0 28 $138,573 APPLICATIONS WITHDRAWN 9 $133,321 24 $181,731 154 $158,134 3 $19,897 0 $0 12 $93,182 FILES CLOSED FOR INCOMPLETENESS 1 $131,670 0 $0 23 $146,041 0 $0 0 $0 0 $0
Aggregated Statistics For Year 2008(Based on 2 full and 10 partial tracts) A) FHA, FSA/RHS & VA B) Conventional C) Refinancings D) Home Improvement Loans E) Loans on Dwellings For 5+ Families F) Non-occupant Loans on Number Average Value Number Average Value Number Average Value Number Average Value Number Average Value Number Average Value
LOANS ORIGINATED 152 $134,121 288 $171,250 432 $169,538 64 $55,691 0 $0 76 $101,144 APPLICATIONS APPROVED, NOT ACCEPTED 6 $156,885 21 $236,751 48 $166,537 12 $51,497 0 $0 5 $192,764 APPLICATIONS DENIED 10 $134,261 14 $117,823 195 $141,470 44 $53,821 2 $3,846,240 10 $104,172 APPLICATIONS WITHDRAWN 5 $139,680 17 $185,056 121 $163,792 12 $31,140 2 $3,846,240 13 $128,052 FILES CLOSED FOR INCOMPLETENESS 4 $115,082 3 $133,257 26 $163,614 3 $45,817 0 $0 3 $111,243
Aggregated Statistics For Year 2007(Based on 2 full and 10 partial tracts) A) FHA, FSA/RHS & VA B) Conventional C) Refinancings D) Home Improvement Loans F) Non-occupant Loans on Number Average Value Number Average Value Number Average Value Number Average Value Number Average Value
LOANS ORIGINATED 64 $137,932 580 $150,154 415 $168,245 82 $61,151 94 $102,669 APPLICATIONS APPROVED, NOT ACCEPTED 1 $328,680 54 $148,482 98 $143,409 10 $45,801 26 $98,058 APPLICATIONS DENIED 9 $91,099 50 $154,527 194 $144,022 60 $53,950 24 $101,909 APPLICATIONS WITHDRAWN 6 $110,400 45 $189,039 96 $142,544 15 $208,310 8 $93,534 FILES CLOSED FOR INCOMPLETENESS 1 $218,120 11 $137,455 38 $182,707 0 $0 5 $108,178
Aggregated Statistics For Year 2006(Based on 2 full and 10 partial tracts) A) FHA, FSA/RHS & VA B) Conventional C) Refinancings D) Home Improvement Loans E) Loans on Dwellings For 5+ Families F) Non-occupant Loans on G) Loans On Manufactured Number Average Value Number Average Value Number Average Value Number Average Value Number Average Value Number Average Value Number Average Value
LOANS ORIGINATED 82 $128,035 702 $148,773 486 $150,928 111 $68,781 3 $613,593 136 $134,170 2 $81,735 APPLICATIONS APPROVED, NOT ACCEPTED 5 $114,606 66 $126,668 73 $187,314 16 $201,341 0 $0 28 $127,536 2 $36,860 APPLICATIONS DENIED 5 $134,332 98 $125,903 233 $158,192 60 $42,432 0 $0 57 $113,478 0 $0 APPLICATIONS WITHDRAWN 8 $129,901 74 $144,673 121 $142,902 19 $48,204 0 $0 29 $144,528 0 $0 FILES CLOSED FOR INCOMPLETENESS 0 $0 19 $126,208 36 $144,581 1 $313,740 0 $0 5 $179,054 0 $0
Aggregated Statistics For Year 2005(Based on 2 full and 10 partial tracts) A) FHA, FSA/RHS & VA B) Conventional C) Refinancings D) Home Improvement Loans E) Loans on Dwellings For 5+ Families F) Non-occupant Loans on Number Average Value Number Average Value Number Average Value Number Average Value Number Average Value Number Average Value
LOANS ORIGINATED 91 $125,123 770 $149,935 582 $163,965 96 $56,001 0 $0 149 $121,314 APPLICATIONS APPROVED, NOT ACCEPTED 12 $118,550 42 $214,148 122 $147,499 23 $41,923 2 $157,520 11 $159,533 APPLICATIONS DENIED 6 $156,500 89 $167,108 286 $165,807 45 $69,392 0 $0 45 $206,108 APPLICATIONS WITHDRAWN 1 $261,450 70 $163,104 192 $155,275 19 $98,886 0 $0 23 $109,725 FILES CLOSED FOR INCOMPLETENESS 1 $133,920 11 $106,626 37 $146,134 3 $62,003 0 $0 7 $83,663
Aggregated Statistics For Year 2004(Based on 2 full and 10 partial tracts) A) FHA, FSA/RHS & VA B) Conventional C) Refinancings D) Home Improvement Loans E) Loans on Dwellings For 5+ Families F) Non-occupant Loans on G) Loans On Manufactured Number Average Value Number Average Value Number Average Value Number Average Value Number Average Value Number Average Value Number Average Value
LOANS ORIGINATED 126 $120,575 712 $138,132 878 $150,822 64 $62,517 0 $0 222 $110,100 0 $0 APPLICATIONS APPROVED, NOT ACCEPTED 4 $116,385 60 $116,166 125 $149,275 16 $34,030 0 $0 22 $81,869 0 $0 APPLICATIONS DENIED 11 $102,526 85 $83,538 245 $161,690 63 $36,952 2 $119,755 34 $101,852 2 $7,210 APPLICATIONS WITHDRAWN 3 $101,447 40 $124,680 180 $137,996 9 $74,099 0 $0 18 $93,528 0 $0 FILES CLOSED FOR INCOMPLETENESS 3 $115,807 15 $116,210 46 $134,466 2 $24,615 0 $0 6 $69,458 0 $0
Aggregated Statistics For Year 2003(Based on 2 full and 10 partial tracts) A) FHA, FSA/RHS & VA B) Conventional C) Refinancings D) Home Improvement Loans E) Loans on Dwellings For 5+ Families F) Non-occupant Loans on Number Average Value Number Average Value Number Average Value Number Average Value Number Average Value Number Average Value
LOANS ORIGINATED 150 $115,407 674 $134,531 2,529 $140,978 63 $27,780 2 $1,402,275 202 $95,936 APPLICATIONS APPROVED, NOT ACCEPTED 10 $93,786 60 $141,711 259 $134,623 17 $41,032 0 $0 17 $85,725 APPLICATIONS DENIED 15 $91,057 81 $108,531 357 $130,131 42 $26,994 0 $0 33 $86,036 APPLICATIONS WITHDRAWN 5 $81,150 45 $147,781 230 $148,742 3 $68,540 0 $0 13 $121,756 FILES CLOSED FOR INCOMPLETENESS 4 $116,662 15 $99,133 74 $130,439 6 $19,453 0 $0 11 $132,769
Aggregated Statistics For Year 2002(Based on 2 full and 10 partial tracts) A) FHA, FSA/RHS & VA B) Conventional C) Refinancings D) Home Improvement Loans E) Loans on Dwellings For 5+ Families F) Non-occupant Loans on Number Average Value Number Average Value Number Average Value Number Average Value Number Average Value Number Average Value
LOANS ORIGINATED 132 $112,104 668 $145,159 1,759 $146,452 81 $28,480 3 $373,857 152 $103,474 APPLICATIONS APPROVED, NOT ACCEPTED 10 $105,108 42 $163,229 232 $138,664 22 $17,208 1 $151,380 12 $89,952 APPLICATIONS DENIED 10 $100,658 39 $134,965 286 $142,665 48 $17,010 0 $0 14 $90,269 APPLICATIONS WITHDRAWN 6 $106,477 22 $142,066 198 $141,607 8 $15,734 0 $0 17 $124,429 FILES CLOSED FOR INCOMPLETENESS 0 $0 5 $105,074 48 $132,880 0 $0 0 $0 1 $230,080
Aggregated Statistics For Year 2001(Based on 2 full and 10 partial tracts) A) FHA, FSA/RHS & VA B) Conventional C) Refinancings D) Home Improvement Loans E) Loans on Dwellings For 5+ Families F) Non-occupant Loans on Number Average Value Number Average Value Number Average Value Number Average Value Number Average Value Number Average Value
LOANS ORIGINATED 161 $104,450 578 $142,011 1,315 $145,143 137 $29,452 3 $554,460 112 $106,361 APPLICATIONS APPROVED, NOT ACCEPTED 10 $117,051 60 $150,999 196 $113,841 37 $33,484 0 $0 7 $120,527 APPLICATIONS DENIED 6 $77,583 38 $91,604 287 $113,113 71 $17,064 0 $0 13 $81,628 APPLICATIONS WITHDRAWN 3 $96,613 41 $136,549 174 $132,192 10 $25,017 0 $0 13 $109,172 FILES CLOSED FOR INCOMPLETENESS 1 $117,810 11 $109,500 53 $112,207 1 $73,210 0 $0 2 $132,910
Aggregated Statistics For Year 2000(Based on 2 full and 10 partial tracts) A) FHA, FSA/RHS & VA B) Conventional C) Refinancings D) Home Improvement Loans F) Non-occupant Loans on Number Average Value Number Average Value Number Average Value Number Average Value Number Average Value
LOANS ORIGINATED 166 $102,239 555 $139,487 328 $118,018 149 $26,241 68 $94,848 APPLICATIONS APPROVED, NOT ACCEPTED 11 $114,764 72 $116,980 81 $120,508 40 $31,467 10 $66,434 APPLICATIONS DENIED 12 $103,731 50 $120,247 180 $119,081 67 $18,283 18 $101,391 APPLICATIONS WITHDRAWN 7 $98,847 38 $145,941 101 $114,643 6 $55,683 2 $157,520 FILES CLOSED FOR INCOMPLETENESS 5 $120,862 4 $175,918 33 $94,228 0 $0 2 $127,985
Aggregated Statistics For Year 1999(Based on 1 full and 5 partial tracts) A) FHA, FSA/RHS & VA B) Conventional C) Refinancings D) Home Improvement Loans E) Loans on Dwellings For 5+ Families F) Non-occupant Loans on Number Average Value Number Average Value Number Average Value Number Average Value Number Average Value Number Average Value
LOANS ORIGINATED 84 $102,728 275 $139,784 282 $120,262 84 $17,305 2 $141,590 51 $92,212 APPLICATIONS APPROVED, NOT ACCEPTED 4 $92,735 27 $127,442 65 $96,038 24 $24,664 0 $0 8 $104,494 APPLICATIONS DENIED 5 $85,840 15 $122,931 89 $92,482 31 $9,906 0 $0 5 $86,052 APPLICATIONS WITHDRAWN 5 $120,958 12 $122,006 85 $91,144 3 $79,930 0 $0 3 $105,983 FILES CLOSED FOR INCOMPLETENESS 2 $106,495 3 $153,477 25 $114,364 1 $187,750 0 $0 1 $42,810
Private Mortgage Insurance Companies Aggregated Statistics For Year 2009(Based on 2 full and 10 partial tracts) A) Conventional B) Refinancings C) Non-occupant Loans on Number Average Value Number Average Value Number Average Value
LOANS ORIGINATED 41 $162,554 39 $160,738 0 $0 APPLICATIONS APPROVED, NOT ACCEPTED 0 $0 14 $224,556 1 $292,820 APPLICATIONS DENIED 4 $244,845 1 $289,840 0 $0 APPLICATIONS WITHDRAWN 1 $228,580 2 $169,775 0 $0 FILES CLOSED FOR INCOMPLETENESS 0 $0 1 $575,190 0 $0
Aggregated Statistics For Year 2008(Based on 2 full and 10 partial tracts) A) Conventional B) Refinancings C) Non-occupant Loans on Number Average Value Number Average Value Number Average Value
LOANS ORIGINATED 114 $151,199 32 $160,935 10 $89,787 APPLICATIONS APPROVED, NOT ACCEPTED 21 $191,003 5 $195,396 5 $86,966 APPLICATIONS DENIED 3 $114,243 4 $194,225 0 $0 APPLICATIONS WITHDRAWN 5 $183,102 0 $0 0 $0 FILES CLOSED FOR INCOMPLETENESS 1 $235,620 0 $0 0 $0
Aggregated Statistics For Year 2007(Based on 2 full and 10 partial tracts) A) Conventional B) Refinancings C) Non-occupant Loans on Number Average Value Number Average Value Number Average Value
LOANS ORIGINATED 155 $131,160 28 $124,085 22 $111,562 APPLICATIONS APPROVED, NOT ACCEPTED 18 $215,524 7 $127,900 5 $109,932 APPLICATIONS DENIED 1 $198,700 0 $0 0 $0 APPLICATIONS WITHDRAWN 5 $94,636 0 $0 0 $0 FILES CLOSED FOR INCOMPLETENESS 0 $0 1 $276,390 0 $0
Aggregated Statistics For Year 2006(Based on 2 full and 10 partial tracts) A) Conventional B) Refinancings C) Non-occupant Loans on Number Average Value Number Average Value Number Average Value
LOANS ORIGINATED 117 $147,970 44 $146,189 28 $103,431 APPLICATIONS APPROVED, NOT ACCEPTED 14 $133,982 9 $149,710 8 $95,928 APPLICATIONS DENIED 3 $671,887 0 $0 0 $0 APPLICATIONS WITHDRAWN 4 $91,638 3 $143,830 0 $0 FILES CLOSED FOR INCOMPLETENESS 0 $0 2 $128,210 0 $0
Aggregated Statistics For Year 2005(Based on 2 full and 10 partial tracts) A) Conventional B) Refinancings C) Non-occupant Loans on Number Average Value Number Average Value Number Average Value
LOANS ORIGINATED 89 $141,217 48 $157,980 13 $103,069 APPLICATIONS APPROVED, NOT ACCEPTED 10 $198,561 22 $258,011 2 $281,295 APPLICATIONS DENIED 0 $0 0 $0 0 $0 APPLICATIONS WITHDRAWN 1 $255,470 5 $131,122 0 $0 FILES CLOSED FOR INCOMPLETENESS 0 $0 0 $0 0 $0
Aggregated Statistics For Year 2004(Based on 2 full and 10 partial tracts) A) Conventional B) Refinancings C) Non-occupant Loans on Number Average Value Number Average Value Number Average Value
LOANS ORIGINATED 155 $132,860 94 $125,791 90 $126,895 APPLICATIONS APPROVED, NOT ACCEPTED 33 $141,758 26 $146,226 10 $135,467 APPLICATIONS DENIED 21 $123,900 0 $0 19 $127,035 APPLICATIONS WITHDRAWN 8 $137,214 11 $133,552 4 $86,122 FILES CLOSED FOR INCOMPLETENESS 2 $97,465 0 $0 0 $0
Aggregated Statistics For Year 2003(Based on 2 full and 10 partial tracts) A) Conventional B) Refinancings C) Non-occupant Loans on Number Average Value Number Average Value Number Average Value
LOANS ORIGINATED 166 $131,832 200 $122,025 31 $123,035 APPLICATIONS APPROVED, NOT ACCEPTED 32 $142,060 54 $137,701 6 $86,565 APPLICATIONS DENIED 5 $190,934 7 $185,544 2 $147,420 APPLICATIONS WITHDRAWN 7 $118,724 6 $141,035 6 $113,017 FILES CLOSED FOR INCOMPLETENESS 0 $0 1 $180,770 0 $0
Aggregated Statistics For Year 2002(Based on 2 full and 10 partial tracts) A) Conventional B) Refinancings C) Non-occupant Loans on Number Average Value Number Average Value Number Average Value
LOANS ORIGINATED 187 $130,176 150 $124,494 30 $116,259 APPLICATIONS APPROVED, NOT ACCEPTED 27 $114,040 48 $131,566 9 $90,808 APPLICATIONS DENIED 1 $72,780 7 $89,071 1 $72,780 APPLICATIONS WITHDRAWN 8 $86,140 20 $133,502 5 $90,462 FILES CLOSED FOR INCOMPLETENESS 0 $0 2 $92,150 0 $0
Aggregated Statistics For Year 2001(Based on 2 full and 10 partial tracts) A) Conventional B) Refinancings C) Non-occupant Loans on Number Average Value Number Average Value Number Average Value
LOANS ORIGINATED 153 $132,411 117 $133,158 21 $99,296 APPLICATIONS APPROVED, NOT ACCEPTED 17 $107,666 16 $178,513 5 $122,280 APPLICATIONS DENIED 1 $240,530 3 $109,443 0 $0 APPLICATIONS WITHDRAWN 0 $0 7 $165,031 0 $0 FILES CLOSED FOR INCOMPLETENESS 2 $82,535 0 $0 0 $0
Aggregated Statistics For Year 2000(Based on 2 full and 10 partial tracts) A) Conventional B) Refinancings C) Non-occupant Loans on Number Average Value Number Average Value Number Average Value
LOANS ORIGINATED 159 $115,892 21 $115,225 19 $90,547 APPLICATIONS APPROVED, NOT ACCEPTED 16 $147,047 13 $101,828 5 $95,876 APPLICATIONS DENIED 1 $137,450 3 $130,890 0 $0 APPLICATIONS WITHDRAWN 2 $74,820 0 $0 0 $0 FILES CLOSED FOR INCOMPLETENESS 1 $103,950 1 $170,320 0 $0
Aggregated Statistics For Year 1999(Based on 1 full and 5 partial tracts) A) Conventional B) Refinancings C) Non-occupant Loans on Number Average Value Number Average Value Number Average Value
LOANS ORIGINATED 83 $115,534 44 $118,895 4 $73,685 APPLICATIONS APPROVED, NOT ACCEPTED 5 $157,350 8 $99,259 2 $69,845 APPLICATIONS DENIED 2 $79,925 0 $0 1 $78,950 APPLICATIONS WITHDRAWN 0 $0 0 $0 0 $0 FILES CLOSED FOR INCOMPLETENESS 0 $0 1 $60,080 0 $0
2003 - 2018 National Fire Incident Reporting System (NFIRS) incidents See full 2006 National Fire Incident Reporting System statistics for zip code 45419, Ohio
Most common first names in zip code 45419 among deceased individuals Name Count Lived (average)
Mary 197 78.9 years John 157 76.2 years Robert 148 74.6 years William 141 77.7 years Charles 110 78.7 years Helen 104 82.6 years James 93 72.4 years Margaret 87 81.1 years Dorothy 77 80.3 years George 70 79.5 years
Most common last names in zip code 45419 among deceased individuals Last name Count Lived (average)
Smith 41 82.9 years Miller 39 80.0 years Brown 30 79.5 years Jones 27 75.8 years Davis 26 77.0 years Johnson 24 77.5 years Baker 22 81.2 years Snyder 20 80.3 years Williams 17 77.5 years Thompson 16 80.6 years
Businesses in zip code 45419
Name Count Name Count
AT&T 1 Little Caesars Pizza 1 CVS 1 McDonald's 1 Chico's 1 Papa John's Pizza 1 Circle K 1 SONIC Drive-In 1 Cricket Wireless 1 Starbucks 1 Dairy Queen 1 Talbots 1 Domino's Pizza 1 Tim Hortons 1 Kincaid 1 UPS 1 La-Z-Boy 1
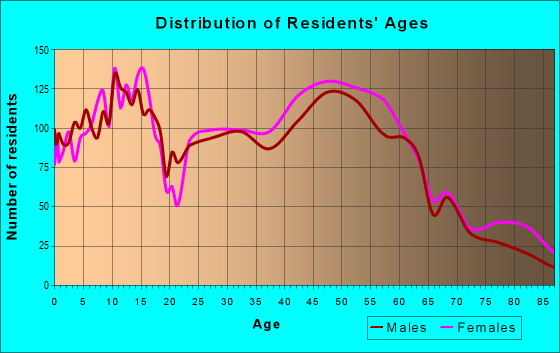
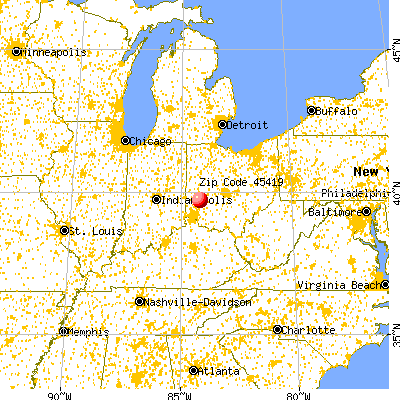


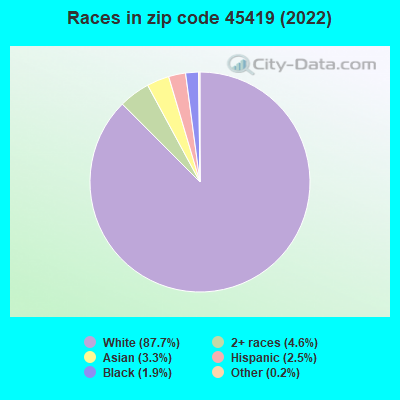


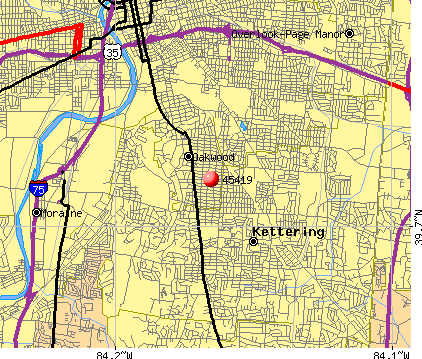 Nearest zip codes: 45409, 45429, 45410, 45420, 45439, 45403.
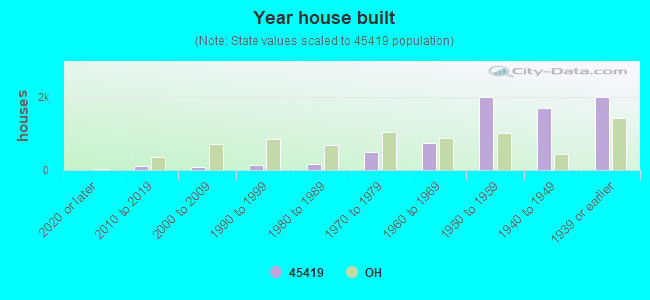
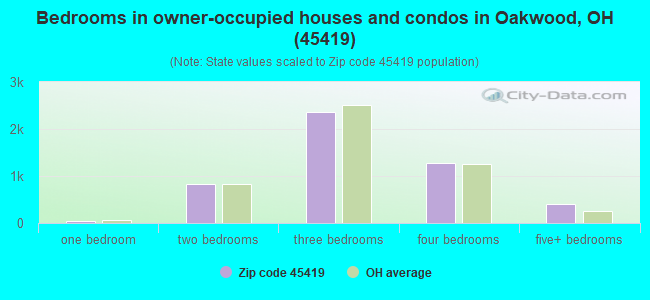
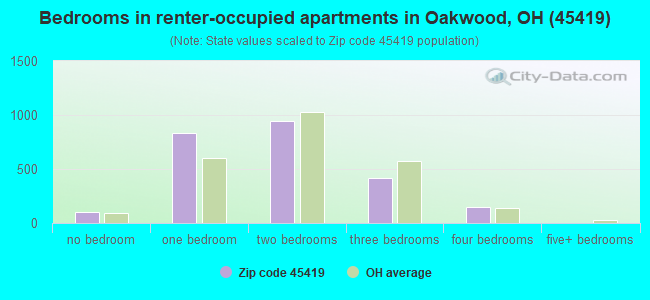
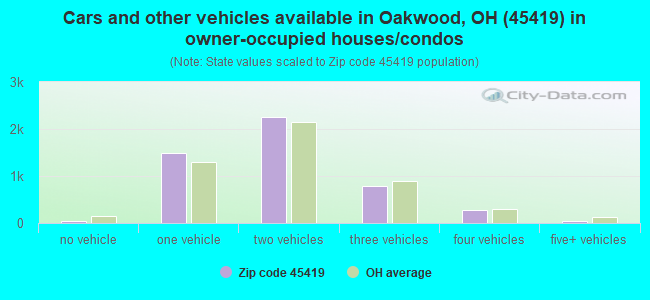
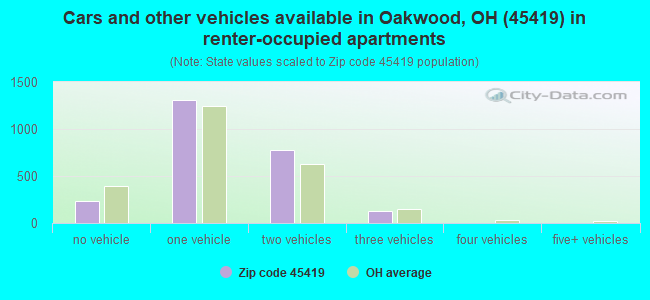


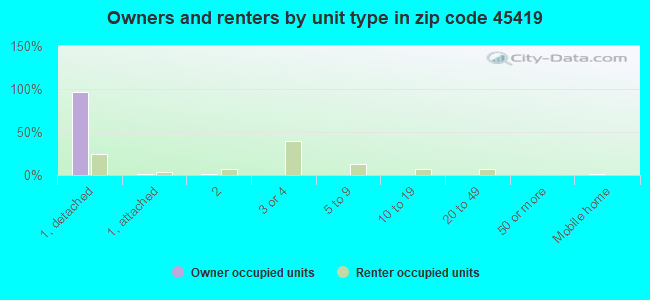
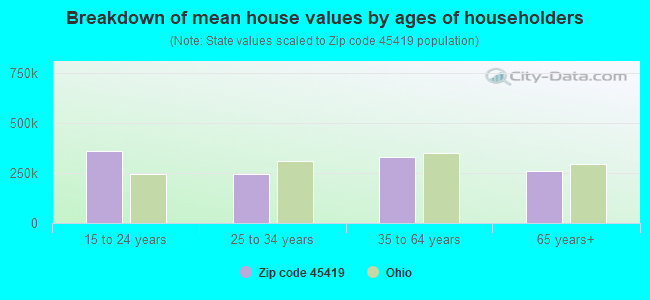


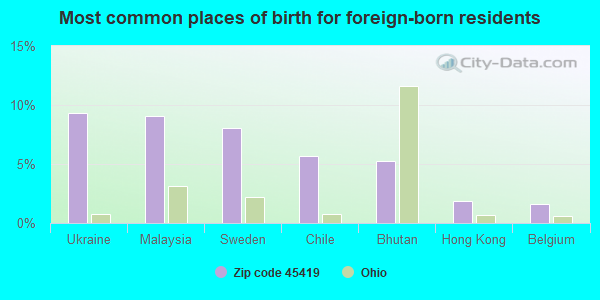
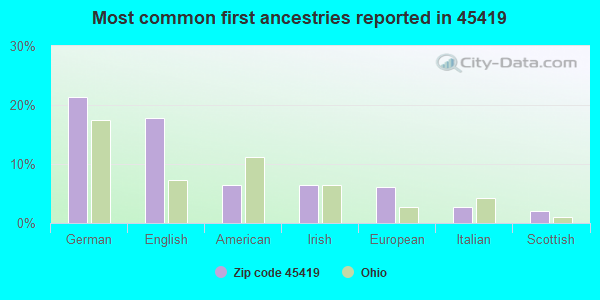
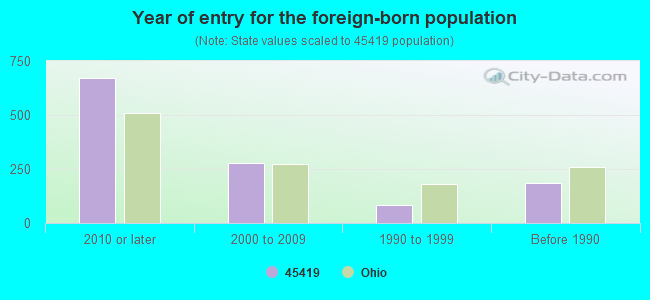

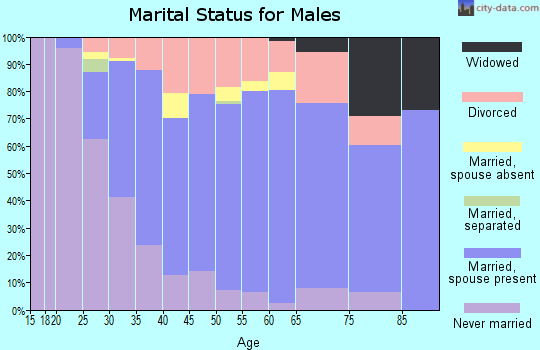
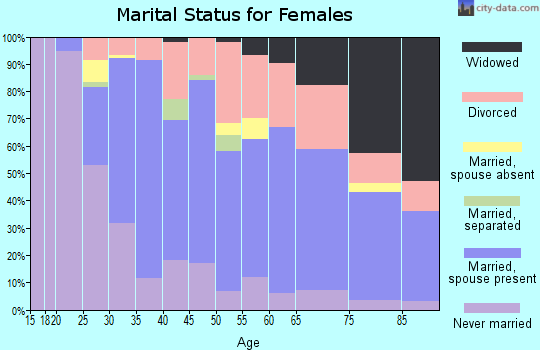
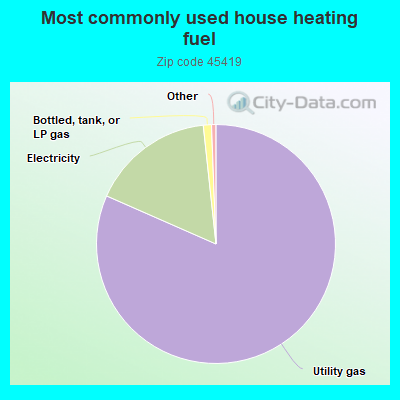
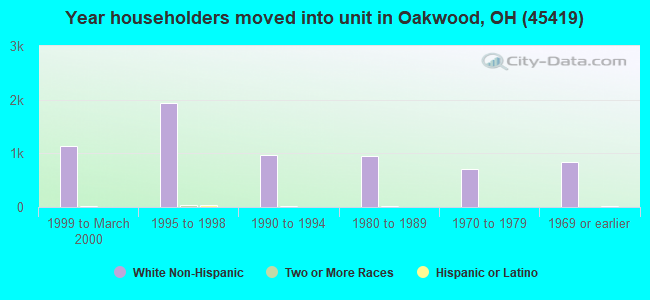
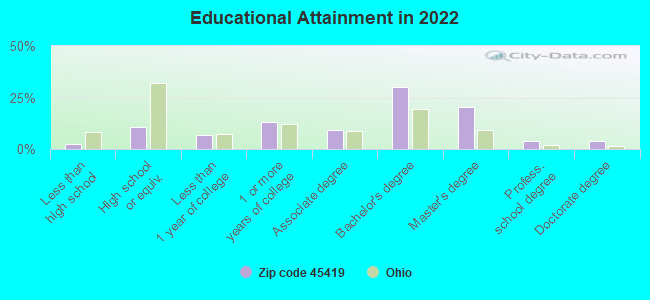
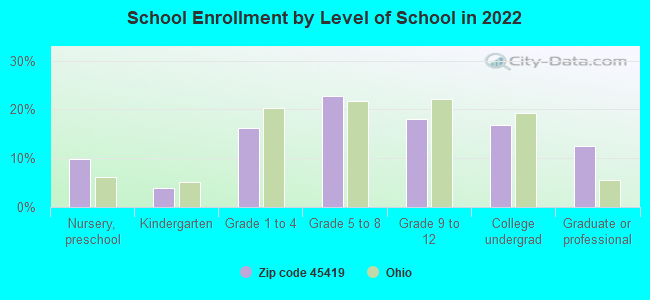
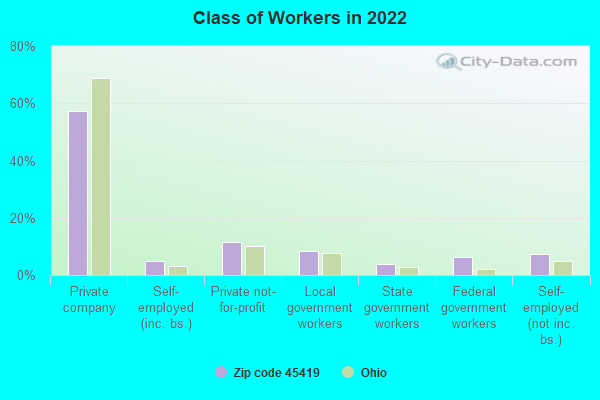
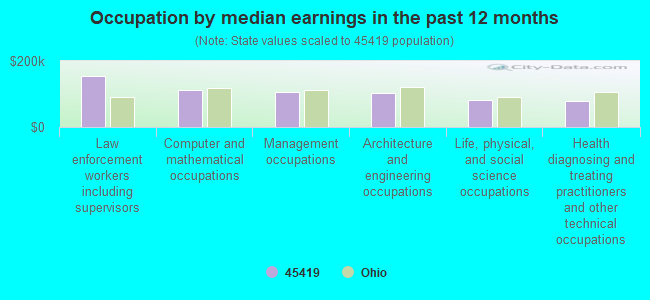
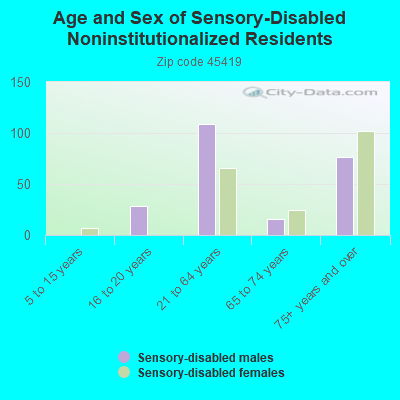
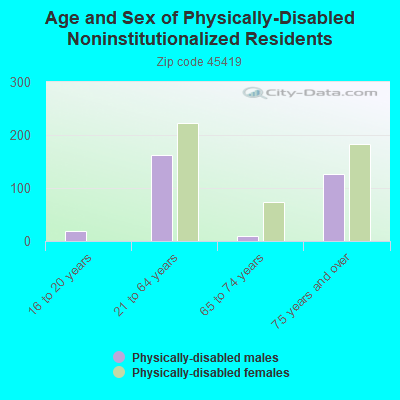
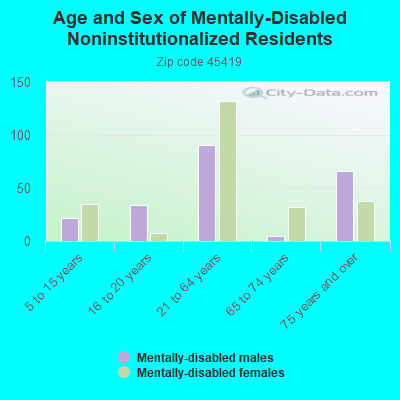
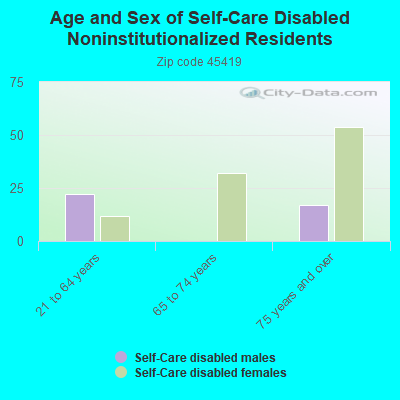
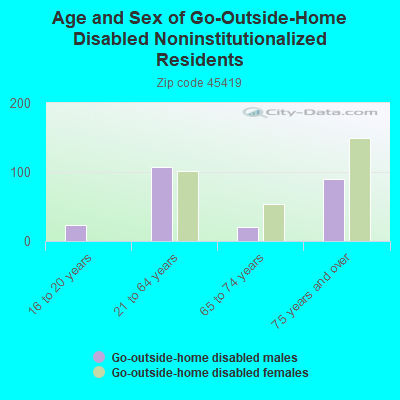
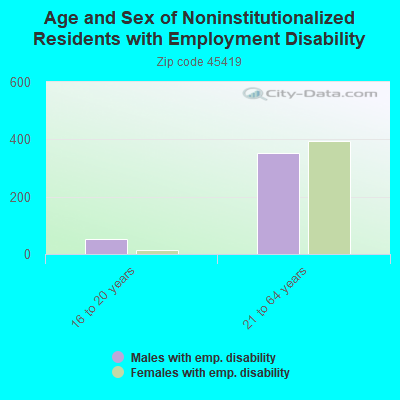
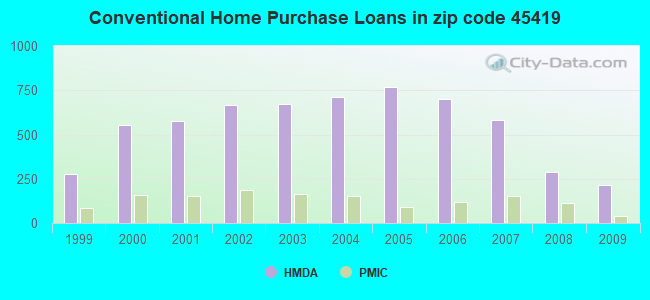
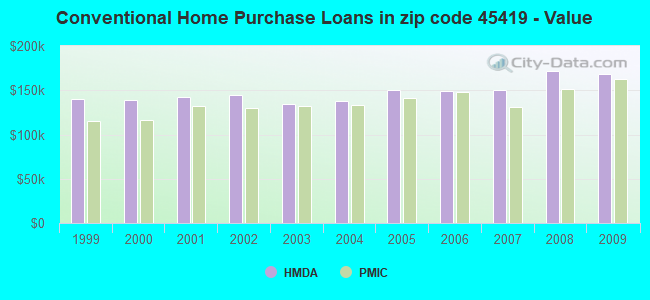
 According to the data from the years 2003 - 2018 the average number of fires per year is 20. The highest number of reported fire incidents - 38 took place in 2010, and the least - 9 in 2017. The data has a declining trend.
 When looking into fire subcategories, the most reports belonged to: Structure Fires (44.9%), and Outside Fires (32.7%).