Estimated zip code population in 2022: 19,885 Zip code population in 2010: 19,414 Zip code population in 2000: 20,986
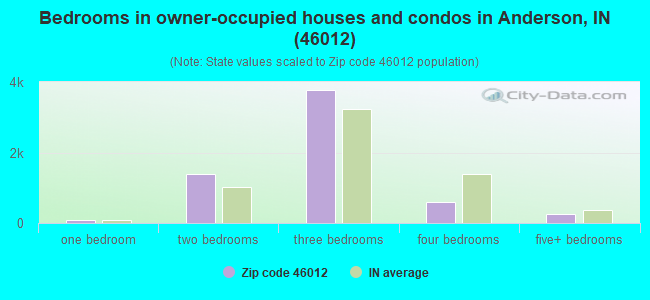
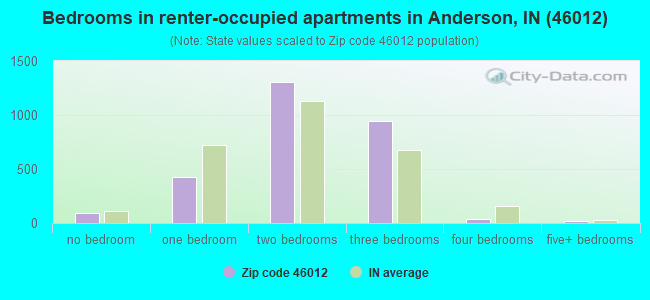
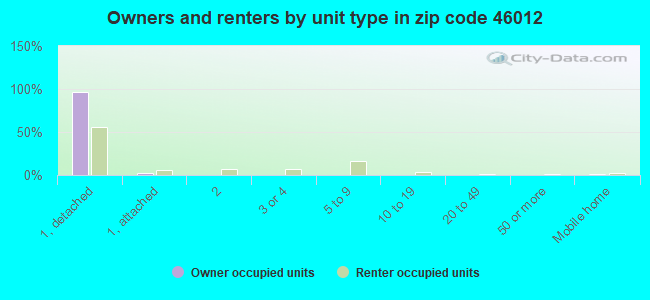
Houses and condos: 9,744 Renter-occupied apartments: 2,839
% of renters here:
32%
State:
29%
March 2022 cost of living index in zip code 46012: 84.9 (less than average, U.S. average is 100)
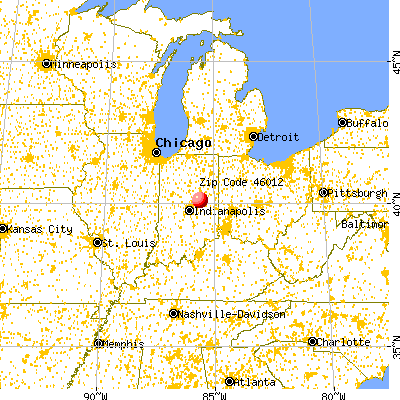
Land area: 32.5 sq. mi. Water area: 0.3 sq. mi.
Population density: 612 people per square mile
(low).
OSM Map
General Map
Google Map
MSN Map
OSM Map
General Map
Google Map
MSN Map
OSM Map
General Map
Google Map
MSN Map
OSM Map
General Map
Google Map
MSN Map
Please wait while loading the map...
Real estate property taxes paid for housing units in 2022:
This zip code:
0.7% ($1,154)
Indiana:
0.7% ($1,467)
Median real estate property taxes paid for housing units with mortgages in 2022: $1,227 (0.7%) Median real estate property taxes paid for housing units with no mortgage in 2022: $1,049 (0.8%)
Business Search- 14 Million verified businesses
Males: 9,760
(49.1%)
Females: 10,124
(50.9%)
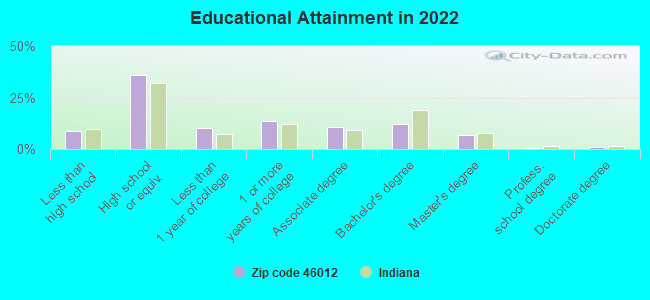
For population 25 years and over in 46012:
High school or higher: 90.2%
Bachelor's degree or higher: 20.6%
Graduate or professional degree: 8.6%
Unemployed: 3.7%
Mean travel time to work (commute): 24.6 minutes
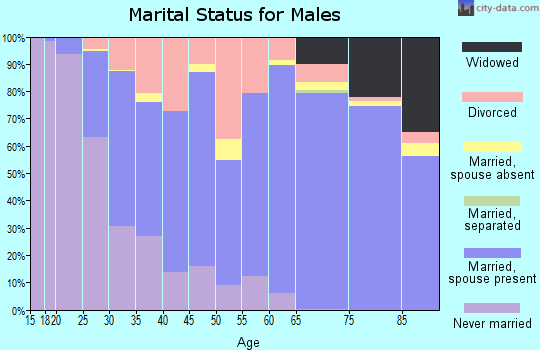
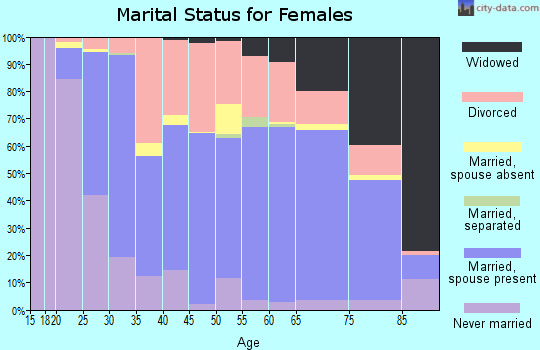
For population 15 years and over in 46012:
Never married: 29.0%
Now married: 43.9%
Separated: 1.9%
Widowed: 7.9%
Divorced: 17.2%
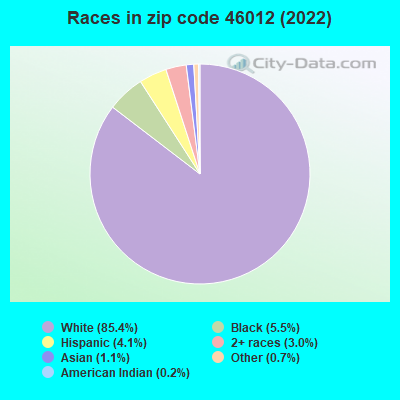
Zip code 46012 compared to state average:
Black race population percentage below state average.
Hispanic race population percentage below state average.
Median age above state average.
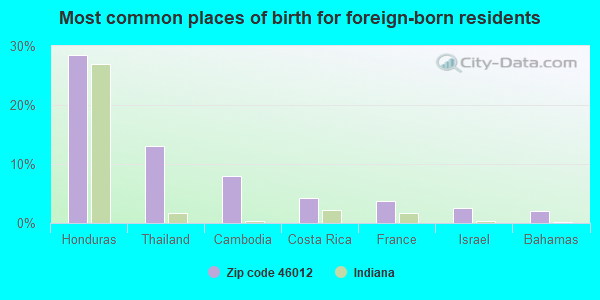
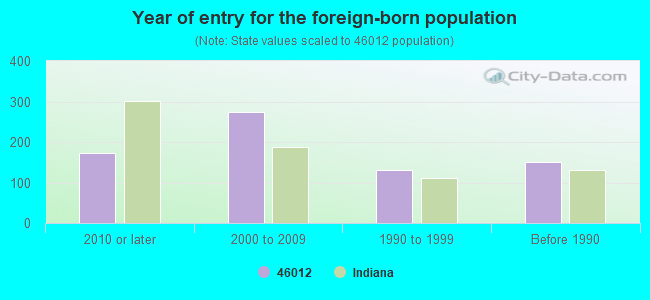
Foreign-born population percentage significantly below state average.
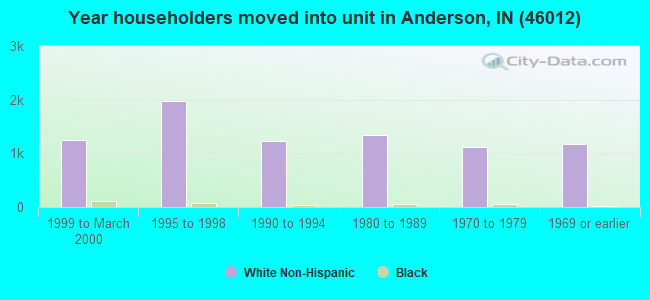
Length of stay since moving in above state average.
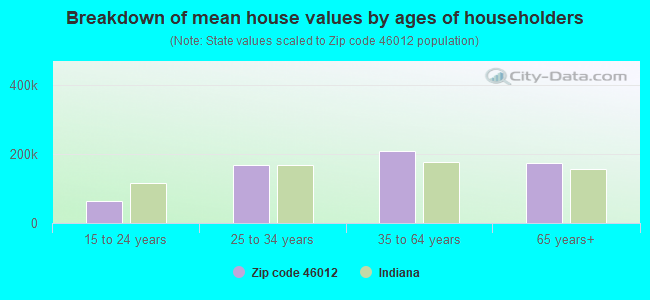
Estimated median house/condo value in 2022: $156,525
46012:
$156,525
Indiana:
$208,700
According to our research of Indiana and other state lists, there were 6 registered sex offenders living in 46012 zip code as of April 26, 2024. The ratio of all residents to sex offenders in zip code 46012 is 3,256 to 1. The ratio of registered sex offenders to all residents in this zip code is much lower than the state average.
Median resident age:
This zip code:
43.5 years
Indiana median age:
38.2 years
Average household size:
This zip code:
2.1 people
Indiana:
2.4 people
Averages for the 2020 tax year for zip code 46012, filed in 2021:
Average Adjusted Gross Income (AGI) in 2020: $47,928 (Individual Income Tax Returns)
Here:
$47,928
State:
$64,978
Salary/wage: $42,624 (reported on 76.7% of returns)
Here:
$42,624
State:
$55,245
(% of AGI for various income ranges: 1000.0% for AGIs below $25k, 3171.8% for AGIs $25k-50k, 5811.0% for AGIs $50k-75k, 8906.4% for AGIs $75k-100k, 15302.4% for AGIs $100k-200k, 58856.7% for AGIs over 200k)
Taxable interest for individuals: $1,212 (reported on 21.2% of returns)
This zip code:
$1,212
Indiana:
$1,351
(% of AGI for various income ranges: 10.8% for AGIs below $25k, 15.9% for AGIs $25k-50k, 32.3% for AGIs $50k-75k, 48.5% for AGIs $75k-100k, 81.2% for AGIs $100k-200k, 2383.3% for AGIs over 200k)
Ordinary dividends: $3,943 (reported on 12.7% of returns)
Here:
$3,943
State:
$5,827
(% of AGI for various income ranges: 11.4% for AGIs below $25k, 22.3% for AGIs $25k-50k, 80.7% for AGIs $50k-75k, 84.4% for AGIs $75k-100k, 219.0% for AGIs $100k-200k, 4626.7% for AGIs over 200k)
Net capital gain/loss in AGI: +$10,702 (reported on 11.4% of returns)
Here:
+$10,702
State:
+$17,730
(% of AGI for various income ranges: 5.2% for AGIs below $25k, 13.4% for AGIs $25k-50k, 72.0% for AGIs $50k-75k, 162.9% for AGIs $75k-100k, 470.8% for AGIs $100k-200k, 22233.3% for AGIs over 200k)
Profit/loss from business: +$8,719 (reported on 11.0% of returns)
Here:
+$8,719
State:
+$12,144
(% of AGI for various income ranges: 52.4% for AGIs below $25k, 63.7% for AGIs $25k-50k, 151.2% for AGIs $50k-75k, 276.9% for AGIs $75k-100k, 325.9% for AGIs $100k-200k, 4436.7% for AGIs over 200k)
Taxable individual retirement arrangement distribution: $14,082 (reported on 10.3% of returns)
46012:
$14,082
Indiana:
$18,302
(% of AGI for various income ranges: 46.5% for AGIs below $25k, 98.6% for AGIs $25k-50k, 237.3% for AGIs $50k-75k, 441.3% for AGIs $75k-100k, 712.4% for AGIs $100k-200k, 4660.0% for AGIs over 200k)
Total itemized deductions: $34,009 (reported on 2.5% of returns)
Here:
$34,009
State:
$35,601
(% of AGI for various income ranges: 44.6% for AGIs $25k-50k, 101.2% for AGIs $50k-75k, 226.2% for AGIs $75k-100k, 539.0% for AGIs $100k-200k, 6070.0% for AGIs over 200k)
Charity contributions: $13,905 (reported on 2.2% of returns)
Here:
$13,905
State:
$15,596
(% of AGI for various income ranges: 4.8% for AGIs below $25k, 32.5% for AGIs $50k-75k, 76.2% for AGIs $75k-100k, 225.5% for AGIs $100k-200k, 2520.0% for AGIs over 200k)
Taxes paid: $6,743 (reported on 2.5% of returns)
46012:
$6,743
State:
$7,542
(% of AGI for various income ranges: 4.0% for AGIs $25k-50k, 18.3% for AGIs $50k-75k, 47.6% for AGIs $75k-100k, 135.9% for AGIs $100k-200k, 1070.0% for AGIs over 200k)
Earned income credit: $2,248 (reported on 17.7% of returns)
Here:
$2,248
State:
$2,298
(% of AGI for various income ranges: 91.6% for AGIs below $25k, 57.9% for AGIs $25k-50k, 1.2% for AGIs $50k-75k)
Percentage of individuals using paid preparers for their 2020 taxes: 93.4%
Here:
93%
State:
94%
(% for various income ranges: 92.6% for AGIs below $25k, 94.7% for AGIs $25k-50k, 93.4% for AGIs $50k-75k, 92.6% for AGIs $75k-100k, 94.0% for AGIs $100k-200k, 90.9% for AGIs over 200k)
Averages for the 2012 tax year for zip code 46012, filed in 2013:
Average Adjusted Gross Income (AGI) in 2012: $42,206 (Individual Income Tax Returns)
Here:
$42,206
State:
$52,932
Salary/wage: $33,896 (reported on 84.0% of returns)
Here:
$33,896
State:
$45,173
(% of AGI for various income ranges: 65.5% for AGIs below $25k, 68.5% for AGIs $25k-50k, 68.2% for AGIs $50k-75k, 70.9% for AGIs $75k-100k, 71.9% for AGIs $100k-200k, 44.5% for AGIs over 200k)
Taxable interest for individuals: $1,020 (reported on 27.5% of returns)
This zip code:
$1,020
Indiana:
$1,311
(% of AGI for various income ranges: 0.9% for AGIs below $25k, 0.5% for AGIs $25k-50k, 0.5% for AGIs $50k-75k, 0.5% for AGIs $75k-100k, 0.8% for AGIs $100k-200k, 1.0% for AGIs over 200k)
Ordinary dividends: $2,930 (reported on 15.8% of returns)
Here:
$2,930
State:
$4,690
(% of AGI for various income ranges: 1.0% for AGIs below $25k, 0.9% for AGIs $25k-50k, 1.1% for AGIs $50k-75k, 0.9% for AGIs $75k-100k, 1.2% for AGIs $100k-200k, 2.3% for AGIs over 200k)
Net capital gain/loss in AGI: +$2,251 (reported on 12.0% of returns)
Here:
+$2,251
State:
+$10,406
(% of AGI for various income ranges: 0.2% for AGIs $25k-50k, 0.3% for AGIs $50k-75k, 0.4% for AGIs $75k-100k, 0.9% for AGIs $100k-200k, 4.5% for AGIs over 200k)
Profit/loss from business: +$8,319 (reported on 12.1% of returns)
Here:
+$8,319
State:
+$11,105
(% of AGI for various income ranges: 4.3% for AGIs below $25k, 1.7% for AGIs $25k-50k, 1.7% for AGIs $50k-75k, 2.0% for AGIs $75k-100k, 2.3% for AGIs $100k-200k, 3.9% for AGIs over 200k)
Taxable individual retirement arrangement distribution: $11,769 (reported on 11.3% of returns)
46012:
$11,769
Indiana:
$13,841
(% of AGI for various income ranges: 2.2% for AGIs below $25k, 2.2% for AGIs $25k-50k, 3.1% for AGIs $50k-75k, 3.8% for AGIs $75k-100k, 3.5% for AGIs $100k-200k, 5.4% for AGIs over 200k)
Total itemized deductions: $19,128 (23% of AGI, reported on 21.9% of returns)
Here:
$19,128
State:
$20,913
Here:
22.9% of AGI
State:
18.2% of AGI
(% of AGI for various income ranges: 7.2% for AGIs below $25k, 7.3% for AGIs $25k-50k, 9.7% for AGIs $50k-75k, 10.3% for AGIs $75k-100k, 12.5% for AGIs $100k-200k, 14.9% for AGIs over 200k)
Charity contributions: $5,530 (reported on 17.5% of returns)
Here:
$5,530
State:
$4,697
(% of AGI for various income ranges: 0.8% for AGIs below $25k, 1.2% for AGIs $25k-50k, 2.0% for AGIs $50k-75k, 2.8% for AGIs $75k-100k, 3.4% for AGIs $100k-200k, 4.7% for AGIs over 200k)
Taxes paid: $5,496 (reported on 21.9% of returns)
46012:
$5,496
State:
$7,456
(% of AGI for various income ranges: 0.9% for AGIs below $25k, 1.5% for AGIs $25k-50k, 2.5% for AGIs $50k-75k, 3.1% for AGIs $75k-100k, 4.7% for AGIs $100k-200k, 5.2% for AGIs over 200k)
Earned income credit: $2,035 (reported on 19.6% of returns)
Here:
$2,035
State:
$2,265
(% of AGI for various income ranges: 5.8% for AGIs below $25k, 1.0% for AGIs $25k-50k)
Percentage of individuals using paid preparers for their 2012 taxes: 47.6%
Here:
48%
State:
53%
(% for various income ranges: 43.4% for AGIs below $25k, 48.2% for AGIs $25k-50k, 50.8% for AGIs $50k-75k, 52.7% for AGIs $75k-100k, 56.2% for AGIs $100k-200k, 75.0% for AGIs over 200k)
Averages for the 2004 tax year for zip code 46012, filed in 2005:
Average Adjusted Gross Income (AGI) in 2004: $39,835 (Individual Income Tax Returns)
Here:
$39,835
State:
$44,790
Salary/wage: $33,156 (reported on 86.8% of returns)
Here:
$33,156
State:
$39,615
(% of AGI for various income ranges: 95.2% for AGIs below $10k, 62.7% for AGIs $10k-25k, 70.0% for AGIs $25k-50k, 74.6% for AGIs $50k-75k, 80.4% for AGIs $75k-100k, 68.6% for AGIs over 100k)
Taxable interest for individuals: $1,391 (reported on 45.6% of returns)
This zip code:
$1,391
Indiana:
$1,535
(% of AGI for various income ranges: 3.5% for AGIs below $10k, 3.0% for AGIs $10k-25k, 1.8% for AGIs $25k-50k, 1.2% for AGIs $50k-75k, 1.0% for AGIs $75k-100k, 1.4% for AGIs over 100k)
Taxable dividends: $1,752 (reported on 23.2% of returns)
Here:
$1,752
State:
$2,998
(% of AGI for various income ranges: 1.6% for AGIs below $10k, 1.1% for AGIs $10k-25k, 1.0% for AGIs $25k-50k, 0.8% for AGIs $50k-75k, 0.7% for AGIs $75k-100k, 1.4% for AGIs over 100k)
Net capital gain/loss: +$3,324 (reported on 16.7% of returns)
Here:
+$3,324
State:
+$8,619
(% of AGI for various income ranges: -1.1% for AGIs below $10k, -0.1% for AGIs $10k-25k, 0.3% for AGIs $25k-50k, 1.0% for AGIs $50k-75k, 0.4% for AGIs $75k-100k, 4.4% for AGIs over 100k)
Profit/loss from business: +$9,906 (reported on 12.0% of returns)
Here:
+$9,906
State:
+$10,071
(% of AGI for various income ranges: 3.2% for AGIs below $10k, 2.8% for AGIs $10k-25k, 2.1% for AGIs $25k-50k, 2.0% for AGIs $50k-75k, 2.0% for AGIs $75k-100k, 5.6% for AGIs over 100k)
IRA payment deduction: $2,563 (reported on 1.6% of returns)
46012:
$2,563
Indiana:
$2,840
(% of AGI for various income ranges: 0.1% for AGIs $10k-25k, 0.1% for AGIs $25k-50k, 0.1% for AGIs $50k-75k, 0.1% for AGIs $75k-100k, 0.1% for AGIs over 100k)
Self-employed pension: $13,583 (reported on 0.3% of returns)
Here:
$13,583
Indiana:
$15,305
Total itemized deductions: $15,391 (21% of AGI, reported on 29.5% of returns)
Here:
$15,391
State:
$17,065
Here:
21.3% of AGI
State:
19.5% of AGI
(% of AGI for various income ranges: 10.0% for AGIs below $10k, 8.1% for AGIs $10k-25k, 9.8% for AGIs $25k-50k, 11.5% for AGIs $50k-75k, 13.3% for AGIs $75k-100k, 13.0% for AGIs over 100k)
Charity contributions deductions: $4,126 (5% of AGI, reported on 24.8% of returns)
Here:
$4,126
State:
$3,550
Here:
5.4% of AGI
State:
3.8% of AGI
(% of AGI for various income ranges: 0.8% for AGIs below $10k, 1.4% for AGIs $10k-25k, 1.9% for AGIs $25k-50k, 2.3% for AGIs $50k-75k, 2.8% for AGIs $75k-100k, 3.9% for AGIs over 100k)
Total tax: $5,214 (reported on 76.4% of returns)
46012:
$5,214
State:
$6,914
(% of AGI for various income ranges: 2.1% for AGIs below $10k, 3.7% for AGIs $10k-25k, 6.9% for AGIs $25k-50k, 9.0% for AGIs $50k-75k, 10.8% for AGIs $75k-100k, 16.8% for AGIs over 100k)
Earned income credit: $1,617 (reported on 13.6% of returns)
Here:
$1,617
State:
$1,685
Percentage of individuals using paid preparers for their 2004 taxes: 56.9%
Here:
57%
State:
59%
(% for various income ranges: 47.8% for AGIs below $10k, 59.9% for AGIs $10k-25k, 58.4% for AGIs $25k-50k, 58.7% for AGIs $50k-75k, 57.3% for AGIs $75k-100k, 62.7% for AGIs over 100k)
Likely homosexual households (counted as self-reported same-sex unmarried-partner households)
Lesbian couples: 0.2% of all households
Gay men: 0.0% of all households
Household received Food Stamps/SNAP in the past 12 months: 1,050 Household did not receive Food Stamps/SNAP in the past 12 months: 7,914
Women who had a birth in the past 12 months: 122 (28 now married, 81 unmarried) Women who did not have a birth in the past 12 months: 4,213 (1,388 now married, 2,817 unmarried)
Housing units in zip code 46012 with a mortgage: 3,369 (350 second mortgage, 4 home equity loan, 305 both second mortgage and home equity loan) Houses without a mortgage: 90
Median monthly owner costs for units with a mortgage: $1,049 Median monthly owner costs for units without a mortgage: $421
Residents with income below the poverty level in 2022:
This zip code:
13.4%
Whole state:
12.6%
Residents with income below 50% of the poverty level in 2022:
This zip code:
7.3%
Whole state:
6.3%
Median number of rooms in houses and condos:
Here:
6.1
State:
6.6
Median number of rooms in apartments:
Here:
4.7
State:
4.3
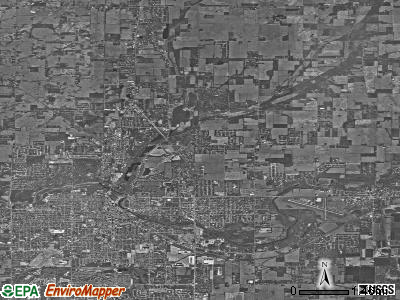
Notable locations in this zip code not listed on our city pages
Notable locations in zip code 46012: Richland Township Volunteer Fire Department (A), Anderson Fire Department Station 7 (B). Display/hide their locations on the map
Churches in zip code 46012 include: Bethany Church (A), Christ Church (B), East Side Church (C), Fairfax Church (D). Display/hide their locations on the map
Streams, rivers, and creeks: Pond Branch (A), Shady Run (B), Pleasant Run Creek (C), Turkey Creek (D), Killbuck Creek (E), Jones Run (F), Fork Creek (G), Florida Brook (H), Del Creek (I). Display/hide their locations on the map
1,738 married couples with children.
1,095 single-parent households (248 men, 847 women).
96.0% of residents of 46012 zip code speak English at home.
2.4% of residents speak Spanish at home (70% very well, 25% well, 5% not well).
0.3% of residents speak other Indo-European language at home (100% very well).
0.9% of residents speak Asian or Pacific Island language at home (46% very well, 36% well, 17% not well).
0.1% of residents speak other language at home (100% very well).
Foreign born population: 435 (2.2%) (67.9% of them are naturalized citizens)
Major facilities with environmental interests located in this zip code:
ABC NACO CORPORATION (705 EAST SCHOOL STREET in ANDERSON, IN)
AIR MAJOR (AIRS/AFS) STATE MASTER (Indiana facility tracking) - CRTK-1946, EPCRA, UST-1141, UNDERGROUND STORAGE TANK PROGRAM CRITERIA AND HAZARDOUS AIR POLLUTANT INVENTORY (Inventory of air pollution sources) Conditionally Exempt Small Quantity Generators, less than 100 kg/month of hazardous waste (Resource Conservation and Recovery Act (tracking hazardous waste)) - notification TRI REPORTER (Tracking of toxic chemicals releasing facilities) Business SIC and NAICS classification: STEEL FOUNDRIES Organizations: ABEX CORP-CAST PRODUCTS GROUP (CONTACT/OPERATOR)
Alternative names: ABEX CORP AMSCO DIV
COMMUNITY HOSPITAL OF ANDERSON (1515 N MADISON AVE in ANDERSON, IN)
AIR MINOR (AIRS/AFS) STATE MASTER (Indiana facility tracking) - CRTK-1916, EPCRA, SPILL-199101125, RELEASE ASSESSMENT, UST-3477, UNDERGROUND STORAGE TANK PROGRAM Small Quantity Generators, between 100 kg and 1000 kg of hazardous waste/month (Resource Conservation and Recovery Act (tracking hazardous waste)) - notification Business SIC classification: GENERAL MEDICAL AND SURGICAL HOSPITALS Organizations: COMMUNITY HOSP OF ANDERSON MADISON CO (CONTACT/OPERATOR)
Alternative names: COMMUNITY HOSP OF ANDERSON & MADISON CO
ANDERSON COLLEGE (1100 E 5TH ST in ANDERSON, IN)
STATE MASTER (Indiana facility tracking) - LUST-199210513, LEAKING STORAGE TANK, UST-1229, UNDERGROUND STORAGE TANK PROGRAM COMPLIANCE ACTIVITY (Tracking inspections of insecticide, fungicide, and rodenticide, and toxic substances) Conditionally Exempt Small Quantity Generators, less than 100 kg/month of hazardous waste (Resource Conservation and Recovery Act (tracking hazardous waste)) - notification Organizations: ANDERSON UNIVERSITY INC (CONTACT/OWNER)
Alternative names: ANDERSON UNIVERSITY
MCQUIK'S OILUBE (524 SR 109 S in ANDERSON, IN)
STATE MASTER (Indiana facility tracking) - CRTK-4232, EPCRA, LUST-199906515, LEAKING STORAGE TANK, UST-4698, UNDERGROUND STORAGE TANK PROGRAM (Resource Conservation and Recovery Act (tracking hazardous waste)) Organizations: QUAKER STATE MINIT LUBE INC (CONTACT/OWNER)
Alternative names: MCQUIKS 9614
BOB MYERS BUICK (2721 N BROADWAY in ANDERSON, IN)
STATE MASTER (Indiana facility tracking) - UST-12665, UNDERGROUND STORAGE TANK PROGRAM Conditionally Exempt Small Quantity Generators, less than 100 kg/month of hazardous waste (Resource Conservation and Recovery Act (tracking hazardous waste)) Organizations: MYERS ROBERT C/MARY JAMERSON (CONTACT/OWNER)
ANDERSON AUTOMOTIVE COLOR INC (2112 E 6TH ST in ANDERSON, IN)
STATE MASTER (Indiana facility tracking) - CRTK-3804, EPCRA Conditionally Exempt Small Quantity Generators, less than 100 kg/month of hazardous waste (Resource Conservation and Recovery Act (tracking hazardous waste)) - notification Organizations: TIM GALBRAITH (CONTACT/OWNER)
PARK PLACE ELEMENTARY SCHOOL (802 E 5TH ST in ANDERSON, IN)
(Geographic Names Information System) (National Center for Education Statistics) - STATE ID-5117 Organizations: ANDERSON COMMUNITY SCHOOL CORP (SCHOOL DISTRICT)
NORTH ANDERSON ELEMENTARY SCH (112 E VINEYARD ST in ANDERSON, IN)
(Geographic Names Information System) (National Center for Education Statistics) - STATE ID-5113 Organizations: ANDERSON COMMUNITY SCHOOL CORP (SCHOOL DISTRICT)
ANDERSON WATER UTILITY LAFAYETTE PLANT (1501 W HARTMAN RD in ANDERSON, IN)
ENFORCEMENT/COMPLIANCE ACTIVITY (Integrated Compliance Information System) STATE MASTER (Indiana facility tracking) - CRTK-1633, EPCRA
NORTH SIDE MIDDLE SCHOOL (1815 INDIANA AVE in ANDERSON, IN)
(National Center for Education Statistics) - STATE ID-5079 Organizations: ANDERSON COMMUNITY SCHOOL CORP (SCHOOL DISTRICT)
ANDERSON CHRY PLY DODGE INC (633 BROADWAY in ANDERSON, IN)
STATE MASTER (Indiana facility tracking) (Resource Conservation and Recovery Act (tracking hazardous waste)) Organizations: WELLS PAYTON (CONTACT/OWNER)
CROSS STREET TANK (210 W CROS ST in ANDERSON, IN)
STATE MASTER (Indiana facility tracking) (Resource Conservation and Recovery Act (tracking hazardous waste)) Organizations: ANDERSON WATER UTILITY (CONTACT/OPERATOR)
RESTING WHEELS MOB. HOME COURT (4315 STATE ROAD 9 NORTH in ANDERSON, IN)
STATE MASTER (Indiana facility tracking) National Pollutant Discharge Elimination System NON-MAJOR (Tracking pollutant discharge elimination systems) - permit Business SIC classification: OPERATORS OF RESIDENTIAL MOBILE HOME SITES Organizations: BRAD SL0AN 15975 (CONTACT/OPERATOR)
, RESTING WHEELS MOBILE HOME CRT (CONTACT/OWNER)
Alternative names: RESTING WHEELS M.H.P.
Housing units lacking complete plumbing facilities: 3.1% Housing units lacking complete kitchen facilities: 4.1%
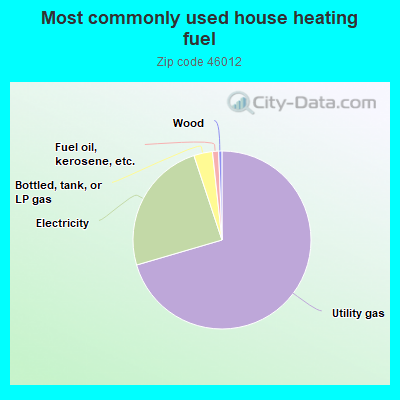
70.4%Utility gas
24.4%Electricity
3.4%Bottled, tank, or LP gas
1.1%Fuel oil, kerosene, etc.
0.6%Wood
Population in 1990: 20,949. Population change in the 1990s: +37 (+0.2%).
Place of birth for U.S.-born residents:
This state: 14,506
Northeast: 237
Midwest: 2,053
South: 1,561
West: 712
57% of the 46012 zip code residents lived in the same house 5 years ago. Out of people who lived in different houses, 64% lived in this county. Out of people who lived in different counties, 50% lived in Indiana.
89% of the 46012 zip code residents lived in the same house 1 year ago. Out of people who lived in different houses, 66% moved from this county. Out of people who lived in different houses, 12% moved from different county within same state. Out of people who lived in different houses, 14% moved from different state. Out of people who lived in different houses, 6% moved from abroad.
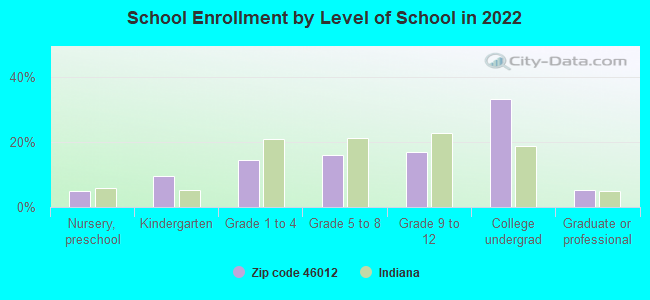
Private vs. public school enrollment:
Students in private schools in grades 1 to 8 (elementary and middle school): 117
Here:
9.9%
Indiana:
14.9%
Students in private schools in grades 9 to 12 (high school): 58
Here:
8.9%
Indiana:
11.4%
Students in private undergraduate colleges: 837
Here:
64.0%
Indiana:
22.3%
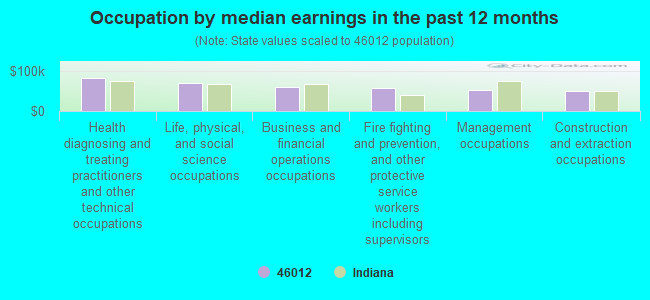
Occupation by median earnings in the past 12 months ($)
83,195Health diagnosing and treating practitioners and other technical occupations
68,757Life, physical, and social science occupations
59,518Business and financial operations occupations
56,289Fire fighting and prevention, and other protective service workers including supervisors
53,391Management occupations
49,120Construction and extraction occupations
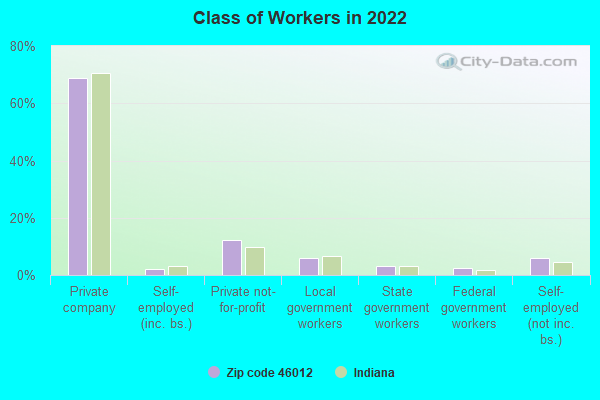
Companies with federal contracts located in this zip code:
XTREME ADS LTD (1508 E 7TH ST in ANDERSON, IN; small business) : $2,237,528 in 10 contractsfrom 2002 to 2006
Contracts for Other Research and Development -- Advanced Development (R&D), Other Research and Development -- Basic Research (R&D), Other Defense -- Operational Systems Development (R&D), Electronic Countermeasures, Counter-Countermeasures and Quick Reaction Capability Equipment, and moreby Navy, Army Signed by year:2000: $0; 2001: $0; 2002: $70,000; 2003: $629,949; 2004: $99,989; 2005: $16,387; 2006: $1,421,203.
Biggest contracts:
$1,279,789 with Navy for Other Research and Development -- Advanced Development (R&D). Signed on 2006-02-13. Completion date: 2006-08-14.
$599,949 with Navy for Other Research and Development -- Basic Research (R&D). Signed on 2003-12-16. Completion date: 2005-12-15.
$99,989 with Navy for Other Defense -- Operational Systems Development (R&D). Signed on 2004-08-25. Completion date: 2005-02-28.
$72,235 with Navy for Electronic Countermeasures, Counter-Countermeasures and Quick Reaction Capability Equipment. Signed on 2006-04-13. Completion date: 2006-07-02.
EAST SIDE JERSEY DAIRY INC (722 BROADWAY ST in ANDERSON, IL) : $1,222,085 in 7 contractsin 2001
Contracts for Dairy Foods and Eggs by Department of Defense Signed by year:2000: $0; 2001: $1,222,085; 2002: $0; 2003: $0; 2004: $0; 2005: $0; 2006: $0.
Biggest contracts:
$296,575 with Department of Defense for Dairy Foods and Eggs. Signed on 2001-09-20. Completion date: 2001-09-09.
$291,139, same as above.Signed on 2001-09-20. Completion date: 2001-09-10.
$217,322, same as above.Signed on 2001-09-20. Completion date: 2001-09-08.
$158,438, same as above.Signed on 2001-09-20. Completion date: 2001-08-31.
Top industries in this zip code by the number of employees in 2005:
Educational Services: Colleges, Universities, and Professional Schools (500-999 employees: 1 establishment)
2002 - 2017 National Fire Incident Reporting System (NFIRS) incidents
Based on the data from the years 2002 - 2017 the average number of fires per year is 34. The highest number of fires - 67 took place in 2007, and the least - 10 in 2014. The data has a declining trend.
When looking into fire subcategories, the most reports belonged to: Structure Fires (47.8%), and Outside Fires (37.7%).
Fire incident types reported to NFIRS in Zip Code 46012


 Nearest zip codes: 46016, 46017, 47334, 46001, 47396, 46013.


 Based on the data from the years 2002 - 2017 the average number of fires per year is 34. The highest number of fires - 67 took place in 2007, and the least - 10 in 2014. The data has a declining trend.
 When looking into fire subcategories, the most reports belonged to: Structure Fires (47.8%), and Outside Fires (37.7%).