Estimated zip code population in 2022: 19,059 Zip code population in 2010: 19,225 Zip code population in 2000: 21,688
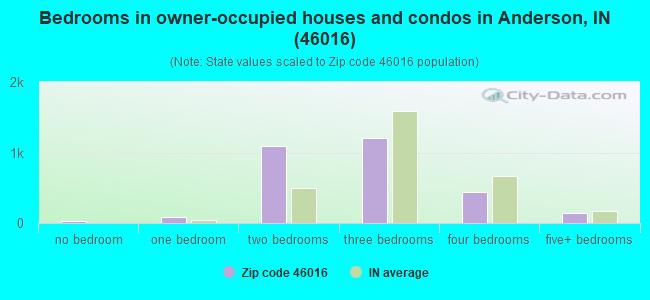
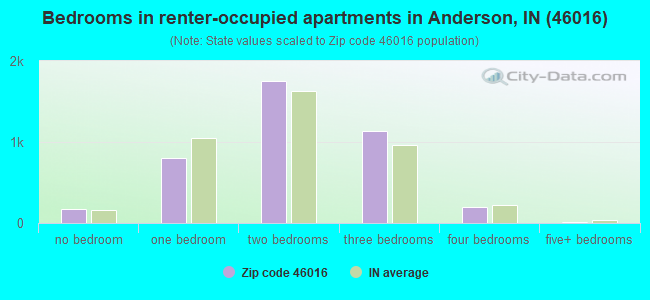
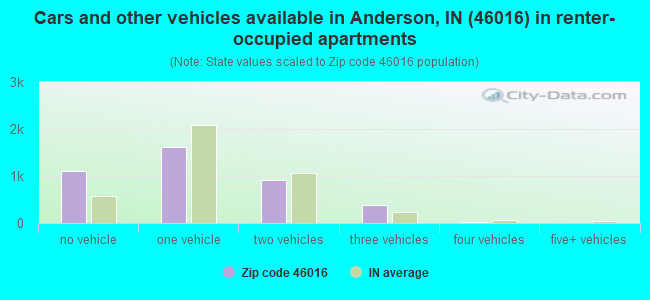
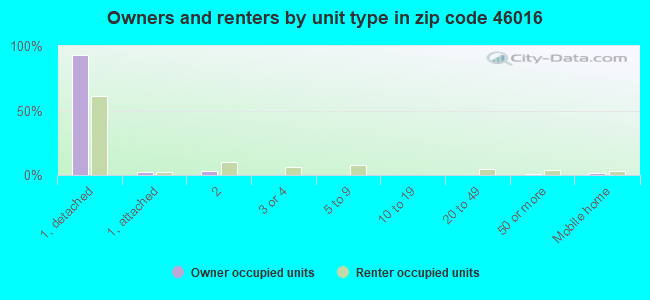
Houses and condos: 9,469 Renter-occupied apartments: 4,070
% of renters here:
58%
State:
29%
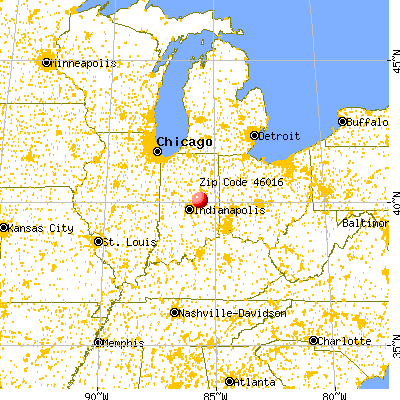
March 2022 cost of living index in zip code 46016: 83.7 (less than average, U.S. average is 100)
Land area: 6.4 sq. mi. Water area: 0.0 sq. mi.
Population density: 2,994 people per square mile
(average).
OSM Map
General Map
Google Map
MSN Map
OSM Map
General Map
Google Map
MSN Map
OSM Map
General Map
Google Map
MSN Map
OSM Map
General Map
Google Map
MSN Map
Please wait while loading the map...
Real estate property taxes paid for housing units in 2022:
This zip code:
0.9% ($673)
Indiana:
0.7% ($1,467)
Median real estate property taxes paid for housing units with mortgages in 2022: $786 (0.9%) Median real estate property taxes paid for housing units with no mortgage in 2022: $580 (1.1%)
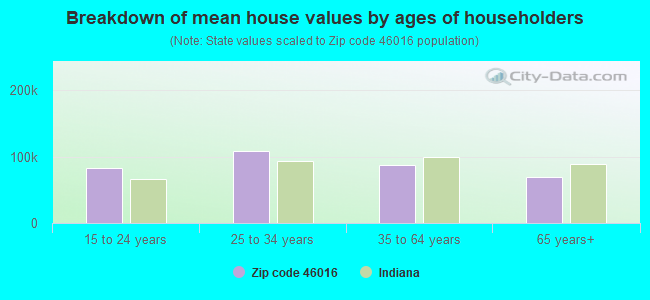
Estimated median house/condo value in 2022: $71,044
46016:
$71,044
Indiana:
$208,700
According to our research of Indiana and other state lists, there were 8 registered sex offenders living in 46016 zip code as of April 26, 2024. The ratio of all residents to sex offenders in zip code 46016 is 2,309 to 1. The ratio of registered sex offenders to all residents in this zip code is much lower than the state average.
Median resident age:
This zip code:
33.9 years
Indiana median age:
38.2 years
Average household size:
This zip code:
2.6 people
Indiana:
2.4 people
Averages for the 2020 tax year for zip code 46016, filed in 2021:
Average Adjusted Gross Income (AGI) in 2020: $28,235 (Individual Income Tax Returns)
Here:
$28,235
State:
$64,978
Salary/wage: $26,404 (reported on 85.6% of returns)
Here:
$26,404
State:
$55,245
(% of AGI for various income ranges: 1107.5% for AGIs below $25k, 3482.3% for AGIs $25k-50k, 6649.0% for AGIs $50k-75k, 9636.7% for AGIs $75k-100k, 15665.0% for AGIs $100k-200k)
Taxable interest for individuals: $313 (reported on 6.2% of returns)
This zip code:
$313
Indiana:
$1,351
(% of AGI for various income ranges: 1.7% for AGIs below $25k, 2.7% for AGIs $25k-50k, 2.6% for AGIs $50k-75k, 2.0% for AGIs $75k-100k, 17.5% for AGIs $100k-200k)
Ordinary dividends: $1,317 (reported on 2.5% of returns)
Here:
$1,317
State:
$5,827
(% of AGI for various income ranges: 2.0% for AGIs below $25k, 4.3% for AGIs $25k-50k, 11.8% for AGIs $50k-75k, 35.0% for AGIs $100k-200k)
Net capital gain/loss in AGI: +$1,400 (reported on 2.3% of returns)
Here:
+$1,400
State:
+$17,730
(% of AGI for various income ranges: 0.2% for AGIs below $25k, 4.1% for AGIs $25k-50k, 10.8% for AGIs $50k-75k, 122.5% for AGIs $100k-200k)
Profit/loss from business: +$6,937 (reported on 10.8% of returns)
Here:
+$6,937
State:
+$12,144
(% of AGI for various income ranges: 81.2% for AGIs below $25k, 57.0% for AGIs $25k-50k, 103.8% for AGIs $50k-75k, 261.3% for AGIs $75k-100k, 915.0% for AGIs $100k-200k)
Taxable individual retirement arrangement distribution: $9,431 (reported on 2.2% of returns)
46016:
$9,431
Indiana:
$18,302
(% of AGI for various income ranges: 8.2% for AGIs below $25k, 21.9% for AGIs $25k-50k, 63.6% for AGIs $50k-75k, 327.3% for AGIs $75k-100k)
Total itemized deductions: $27,375 (reported on 0.5% of returns)
Here:
$27,375
State:
$35,601
(% of AGI for various income ranges: 13.7% for AGIs below $25k, 422.0% for AGIs $75k-100k)
Charity contributions: $7,300 (reported on 0.4% of returns)
Here:
$7,300
State:
$15,596
(% of AGI for various income ranges: 11.3% for AGIs $25k-50k)
Taxes paid: $5,875 (reported on 0.5% of returns)
46016:
$5,875
State:
$7,542
(% of AGI for various income ranges: 1.9% for AGIs below $25k, 114.0% for AGIs $75k-100k)
Earned income credit: $2,473 (reported on 35.9% of returns)
Here:
$2,473
State:
$2,298
(% of AGI for various income ranges: 137.3% for AGIs below $25k, 95.3% for AGIs $25k-50k, 2.2% for AGIs $50k-75k)
Percentage of individuals using paid preparers for their 2020 taxes: 93.8%
Here:
94%
State:
94%
(% for various income ranges: 93.6% for AGIs below $25k, 94.2% for AGIs $25k-50k, 93.8% for AGIs $50k-75k, 95.0% for AGIs $75k-100k, 92.3% for AGIs $100k-200k)
Averages for the 2012 tax year for zip code 46016, filed in 2013:
Average Adjusted Gross Income (AGI) in 2012: $23,488 (Individual Income Tax Returns)
Here:
$23,488
State:
$52,932
Salary/wage: $20,415 (reported on 88.7% of returns)
Here:
$20,415
State:
$45,173
(% of AGI for various income ranges: 75.9% for AGIs below $25k, 81.7% for AGIs $25k-50k, 77.5% for AGIs $50k-75k, 76.7% for AGIs $75k-100k, 58.4% for AGIs $100k-200k)
Taxable interest for individuals: $547 (reported on 9.3% of returns)
This zip code:
$547
Indiana:
$1,311
(% of AGI for various income ranges: 0.2% for AGIs below $25k, 0.2% for AGIs $25k-50k, 0.3% for AGIs $50k-75k, 0.1% for AGIs $75k-100k, 0.1% for AGIs $100k-200k)
Ordinary dividends: $1,793 (reported on 3.8% of returns)
Here:
$1,793
State:
$4,690
(% of AGI for various income ranges: 0.2% for AGIs below $25k, 0.2% for AGIs $25k-50k, 0.5% for AGIs $50k-75k, 1.0% for AGIs $100k-200k)
Net capital gain/loss in AGI: +$753 (reported on 2.4% of returns)
Here:
+$753
State:
+$10,406
(% of AGI for various income ranges: 0.2% for AGIs $25k-50k)
Profit/loss from business: +$8,633 (reported on 9.9% of returns)
Here:
+$8,633
State:
+$11,105
(% of AGI for various income ranges: 7.0% for AGIs below $25k, 1.2% for AGIs $25k-50k, 0.8% for AGIs $50k-75k, 8.9% for AGIs $75k-100k)
Taxable individual retirement arrangement distribution: $8,262 (reported on 3.0% of returns)
46016:
$8,262
Indiana:
$13,841
(% of AGI for various income ranges: 0.7% for AGIs below $25k, 0.9% for AGIs $25k-50k, 1.6% for AGIs $50k-75k, 3.4% for AGIs $75k-100k)
Total itemized deductions: $15,368 (29% of AGI, reported on 5.8% of returns)
Here:
$15,368
State:
$20,913
Here:
28.5% of AGI
State:
18.2% of AGI
(% of AGI for various income ranges: 2.3% for AGIs below $25k, 2.7% for AGIs $25k-50k, 5.8% for AGIs $50k-75k, 6.7% for AGIs $75k-100k, 10.1% for AGIs $100k-200k)
Charity contributions: $3,723 (reported on 4.2% of returns)
Here:
$3,723
State:
$4,697
(% of AGI for various income ranges: 0.2% for AGIs below $25k, 0.5% for AGIs $25k-50k, 1.0% for AGIs $50k-75k, 1.7% for AGIs $75k-100k, 2.4% for AGIs $100k-200k)
Taxes paid: $3,666 (reported on 5.8% of returns)
46016:
$3,666
State:
$7,456
(% of AGI for various income ranges: 0.3% for AGIs below $25k, 0.6% for AGIs $25k-50k, 1.4% for AGIs $50k-75k, 1.9% for AGIs $75k-100k, 3.4% for AGIs $100k-200k)
Earned income credit: $2,504 (reported on 40.9% of returns)
Here:
$2,504
State:
$2,265
(% of AGI for various income ranges: 10.6% for AGIs below $25k, 1.7% for AGIs $25k-50k)
Percentage of individuals using paid preparers for their 2012 taxes: 43.4%
Here:
43%
State:
53%
(% for various income ranges: 42.6% for AGIs below $25k, 43.5% for AGIs $25k-50k, 47.7% for AGIs $50k-75k, 53.8% for AGIs $75k-100k, 50.0% for AGIs $100k-200k)
Averages for the 2004 tax year for zip code 46016, filed in 2005:
Average Adjusted Gross Income (AGI) in 2004: $23,762 (Individual Income Tax Returns)
Here:
$23,762
State:
$44,790
Salary/wage: $21,178 (reported on 91.4% of returns)
Here:
$21,178
State:
$39,615
(% of AGI for various income ranges: 83.8% for AGIs below $10k, 79.7% for AGIs $10k-25k, 82.8% for AGIs $25k-50k, 82.0% for AGIs $50k-75k, 83.6% for AGIs $75k-100k, 76.4% for AGIs over 100k)
Taxable interest for individuals: $838 (reported on 19.3% of returns)
This zip code:
$838
Indiana:
$1,535
(% of AGI for various income ranges: 1.3% for AGIs below $10k, 0.8% for AGIs $10k-25k, 0.6% for AGIs $25k-50k, 0.7% for AGIs $50k-75k, 0.2% for AGIs $75k-100k, 0.3% for AGIs over 100k)
Taxable dividends: $1,258 (reported on 7.3% of returns)
Here:
$1,258
State:
$2,998
(% of AGI for various income ranges: 0.9% for AGIs below $10k, 0.3% for AGIs $10k-25k, 0.3% for AGIs $25k-50k, 0.5% for AGIs $50k-75k, 0.1% for AGIs $75k-100k, 0.5% for AGIs over 100k)
Net capital gain/loss: +$979 (reported on 4.4% of returns)
Here:
+$979
State:
+$8,619
(% of AGI for various income ranges: -0.1% for AGIs below $10k, 0.1% for AGIs $10k-25k, 0.1% for AGIs $25k-50k, 0.5% for AGIs $50k-75k, 0.1% for AGIs $75k-100k, 0.3% for AGIs over 100k)
Profit/loss from business: +$6,318 (reported on 7.1% of returns)
Here:
+$6,318
State:
+$10,071
(% of AGI for various income ranges: 3.2% for AGIs below $10k, 2.0% for AGIs $10k-25k, 1.0% for AGIs $25k-50k, 2.3% for AGIs $50k-75k, 2.5% for AGIs $75k-100k, 3.4% for AGIs over 100k)
IRA payment deduction: $1,927 (reported on 0.5% of returns)
46016:
$1,927
Indiana:
$2,840
Total itemized deductions: $12,592 (24% of AGI, reported on 9.6% of returns)
Here:
$12,592
State:
$17,065
Here:
24.1% of AGI
State:
19.5% of AGI
(% of AGI for various income ranges: 2.3% for AGIs below $10k, 2.7% for AGIs $10k-25k, 4.9% for AGIs $25k-50k, 6.3% for AGIs $50k-75k, 8.1% for AGIs $75k-100k, 11.7% for AGIs over 100k)
Charity contributions deductions: $3,128 (5% of AGI, reported on 7.2% of returns)
Here:
$3,128
State:
$3,550
Here:
5.4% of AGI
State:
3.8% of AGI
(% of AGI for various income ranges: 0.2% for AGIs below $10k, 0.4% for AGIs $10k-25k, 0.8% for AGIs $25k-50k, 1.2% for AGIs $50k-75k, 1.5% for AGIs $75k-100k, 3.0% for AGIs over 100k)
Total tax: $2,746 (reported on 58.9% of returns)
46016:
$2,746
State:
$6,914
(% of AGI for various income ranges: 1.1% for AGIs below $10k, 3.0% for AGIs $10k-25k, 6.3% for AGIs $25k-50k, 9.5% for AGIs $50k-75k, 12.1% for AGIs $75k-100k, 16.6% for AGIs over 100k)
Earned income credit: $1,819 (reported on 32.8% of returns)
Here:
$1,819
State:
$1,685
Percentage of individuals using paid preparers for their 2004 taxes: 60.6%
Here:
61%
State:
59%
(% for various income ranges: 56.4% for AGIs below $10k, 62.3% for AGIs $10k-25k, 61.0% for AGIs $25k-50k, 63.3% for AGIs $50k-75k, 70.2% for AGIs $75k-100k, 59.6% for AGIs over 100k)
Likely homosexual households (counted as self-reported same-sex unmarried-partner households)
Lesbian couples: 0.0% of all households
Gay men: 0.1% of all households
Household received Food Stamps/SNAP in the past 12 months: 2,584 Household did not receive Food Stamps/SNAP in the past 12 months: 4,583
Women who had a birth in the past 12 months: 186 (72 now married, 101 unmarried) Women who did not have a birth in the past 12 months: 4,828 (1,512 now married, 3,305 unmarried)
Housing units in zip code 46016 with a mortgage: 1,502 (101 second mortgage, 45 both second mortgage and home equity loan) Houses without a mortgage: 66
Median monthly owner costs for units with a mortgage: $902 Median monthly owner costs for units without a mortgage: $409
Residents with income below the poverty level in 2022:
This zip code:
29.1%
Whole state:
12.6%
Residents with income below 50% of the poverty level in 2022:
This zip code:
16.2%
Whole state:
6.3%
Median number of rooms in houses and condos:
Here:
6.2
State:
6.6
Median number of rooms in apartments:
Here:
4.8
State:
4.3
Notable locations in this zip code not listed on our city pages
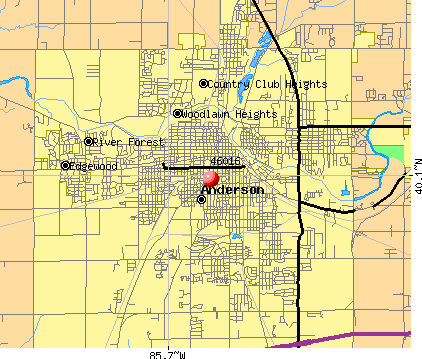
Notable locations in zip code 46016: Anderson Fire Department Station 1 Headquarters (A), Anderson Fire Department (B), Anderson Fire Department Station 3 (C), Anderson Fire Department Station 2 (D), Anderson Fire Department Station 6 (E). Display/hide their locations on the map
Parks in zip code 46016 include: Riley Park (1), Madison Park (2), Stanton Park (3), Horne Park (4), Hubbard Park (5), Fairview Park (6), Denny Field (7). Display/hide their locations on the map
Tourist attraction (not listed on the city page) : Hot Air Corps Inc (816 West 8th Street).
1,248 married couples with children.
2,454 single-parent households (436 men, 2,018 women).
87.3% of residents of 46016 zip code speak English at home.
10.8% of residents speak Spanish at home (52% very well, 34% well, 13% not well, 1% not at all).
0.1% of residents speak other Indo-European language at home (100% very well).
0.8% of residents speak Asian or Pacific Island language at home (73% very well, 16% well, 6% not well, 5% not at all).
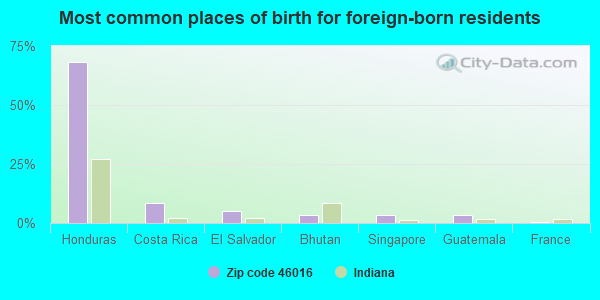
Foreign born population: 790 (4.1%) (33.3% of them are naturalized citizens)
Major facilities with environmental interests located in this zip code:
GUIDE CORP (2915 PENDELTON AVE in ANDERSON, IN)
AIR MAJOR (AIRS/AFS) (Integrated Compliance Information System) - ICIS-05-1987-0501, FORMAL ENFORCEMENT ACTION, ICIS-05-2001-0128, ICIS-05-2000-0610, ICIS-05-2000-0492, STATE MASTER (Indiana facility tracking) - ACES-CP-09500005, AIR PROGRAM, ACES-CP-2008, ACES-OP-09500005, CRTK-381, EPCRA, LUST-199008505, LEAKING STORAGE TANK, LUST-199008576, LUST-199211527, LUST-199707538, SPILL-199010013, RELEASE ASSESSMENT, UST-2011, UNDERGROUND STORAGE TANK PROGRAM COMPLIANCE ACTIVITY (Tracking inspections of insecticide, fungicide, and rodenticide, and toxic substances) CRITERIA AND HAZARDOUS AIR POLLUTANT INVENTORY (Inventory of air pollution sources) National Pollutant Discharge Elimination System NON-MAJOR (Tracking pollutant discharge elimination systems) - permit (Resource Conservation and Recovery Act (tracking hazardous waste)) HAZARDOUS WASTE BIENNIAL REPORTER (Resource Conservation and Recovery Act (tracking hazardous waste)) Large Quantity Generators, more that 1000 kg of hazardous waste/month (Resource Conservation and Recovery Act (tracking hazardous waste)) - notification TSD (Resource Conservation and Recovery Act (tracking hazardous waste)) - notification TRI REPORTER (Tracking of toxic chemicals releasing facilities) Business SIC classification: VEHICULAR LIGHTING EQUIPMENT; MOTOR VEHICLE PARTS AND ACCESSORIES Business NAICS classification: GLASS PRODUCT MANUFACTURING MADE OF PURCHASED GLASS.; VEHICULAR LIGHTING EQUIPMENT MANUFACTURING.; VEHICULAR LIGHTING EQUIPMENT MANUFACTURING.; VEHICULAR LIGHTING EQUIPMENT MANUFACTURING.; ALL OTHER MOTOR VEHICLE PARTS MANUFACTURING. Organizations: GMC GUIDE ANDERSON WEST (CONTACT/OPERATOR)
, GUIDE INDIANA LLC (CONTACT/OWNER)
Alternative names: DELPHI INTERIOR & LIGHTING SYSTEMS, GMC-DELPHI INTERIOR AND LIGHTING SYSTEMS, GMC GUID DIV EAST, GMC GUIDE DIV WEST, GUIDE CORPORATION-ANDERSEN, GUIDE INDIANA L-L.C, INLAND FISHER GUIDE DIV GM CORP, INLAND FISHER GUIDE DIV., GMC
PQ CORPORATION (1900 COLUMBUS AVE in ANDERSON, IN)
AIR MAJOR (AIRS/AFS) STATE MASTER (Indiana facility tracking) - UST-7707, UNDERGROUND STORAGE TANK PROGRAM, ACES-OP-09500027, AIR PROGRAM, CRTK-3194, EPCRA, UST-19578, UNDERGROUND STORAGE TANK PROGRAM, UST-20378, CRITERIA AND HAZARDOUS AIR POLLUTANT INVENTORY (Inventory of air pollution sources) HAZARDOUS WASTE BIENNIAL REPORTER (Resource Conservation and Recovery Act (tracking hazardous waste)) Large Quantity Generators, more that 1000 kg of hazardous waste/month (Resource Conservation and Recovery Act (tracking hazardous waste)) TRI REPORTER (Tracking of toxic chemicals releasing facilities) Business SIC classification: INDUSTRIAL INORGANIC CHEMICALS Business NAICS classification: ALL OTHER BASIC INORGANIC CHEMICAL MANUFACTURING.; ALL OTHER MISCELLANEOUS CHEMICAL PRODUCT AND PREPARATION MANUFACTURING. Organizations: THE PQ CORPORATION (CONTACT/OWNER)
ALAC GARMENT SERVICES INC (233 SYCAMORE ST in ANDERSON, IN)
AIR MAJOR (AIRS/AFS) STATE MASTER (Indiana facility tracking) - UST-859, UNDERGROUND STORAGE TANK PROGRAM CRITERIA AND HAZARDOUS AIR POLLUTANT INVENTORY (Inventory of air pollution sources) HAZARDOUS WASTE BIENNIAL REPORTER (Resource Conservation and Recovery Act (tracking hazardous waste)) Large Quantity Generators, more that 1000 kg of hazardous waste/month (Resource Conservation and Recovery Act (tracking hazardous waste)) - notification Business SIC and NAICS classification: INDUSTRIAL LAUNDERERS Organizations: ALAC SERVICES INC (CONTACT/OPERATOR)
, THOMAS PROCTOR PRES (CONTACT/OWNER)
Alternative names: ALAC SERVICES INC
PRIME BATTERY MANUFACTURING CO INCORPORATED (230 W JACKSON ST in ANDERSON, IN)
SUPERFUND (Superfund database) STATE MASTER (Indiana facility tracking) - CRTK-1255, EPCRA Large Quantity Generators, more that 1000 kg of hazardous waste/month (Resource Conservation and Recovery Act (tracking hazardous waste)) TRI REPORTER (Tracking of toxic chemicals releasing facilities) Business SIC classification: MOTOR VEHICLE PARTS AND ACCESSORIES Organizations: BLOCKSON EDWARD (CONTACT/OWNER)
, ACQUISITION INVESTMENT CORP (CONTACT/OWNER)
ANDERSON COMMUNITY SCHOOL CORP (30 W 11TH ST in ANDERSON, IN)
(Integrated Compliance Information System) - ICIS-05-1985-0198, FORMAL ENFORCEMENT ACTION STATE MASTER (Indiana facility tracking) COMPLIANCE ACTIVITY (Tracking inspections of insecticide, fungicide, and rodenticide, and toxic substances) Business SIC classification: ELEMENTARY AND SECONDARY SCHOOLS Alternative names: ANDERSON COMM SCH
ANDERSON FIRE DEPARTMENT (44 W 5TH ST in ANDERSON, IN)
AIR MONITORING SITE (Airborne pollution emission tracking) STATE MASTER (Indiana facility tracking) - LUST-199901537, LEAKING STORAGE TANK, UST-12370, UNDERGROUND STORAGE TANK PROGRAM National Pollutant Discharge Elimination System NON-MAJOR (Tracking pollutant discharge elimination systems) - permit Business SIC classification: FIRE PROTECTION Organizations: BILL BLOEMER CERT 11406 (CONTACT/OPERATOR)
Alternative names: SITE ID 180950009
PHILLIPS INDUSTRIES INCORPORATED (1515 EAST 22ND STREET in ANDERSON, IN)
AIR MINOR (AIRS/AFS) STATE MASTER (Indiana facility tracking) - ACES-OP-09500064, AIR PROGRAM, CRTK-20165, EPCRA TRANSPORTER (Resource Conservation and Recovery Act (tracking hazardous waste)) Business SIC classification: SCRAP AND WASTE MATERIALS Organizations: INDUSTRIAL REMOVAL INC (CONTACT/OWNER)
Alternative names: INDUSTRIAL REMOVAL INC
MADISON MILLWORK (707 JACKSON ST in ANDERSON, IN)
STATE MASTER (Indiana facility tracking) - UST-18923, UNDERGROUND STORAGE TANK PROGRAM (Resource Conservation and Recovery Act (tracking hazardous waste)) Organizations: GOODYEAR TIRE AND RUBBER CO (CONTACT/OWNER)
Alternative names: GOODYEAR AUTO SERVICE CTR
NU PROCESS CLEANERS INC (930 W 14TH ST in ANDERSON, IN)
STATE MASTER (Indiana facility tracking) - LUST-199902523, LEAKING STORAGE TANK, UST-6256, UNDERGROUND STORAGE TANK PROGRAM (Resource Conservation and Recovery Act (tracking hazardous waste))
CONRAIL SOUTH ANDERSON YARD (MAIN ST & ANDOVER RD in ANDERSON, IN)
STATE MASTER (Indiana facility tracking) - SPILL-198911056, RELEASE ASSESSMENT (Resource Conservation and Recovery Act (tracking hazardous waste)) Organizations: UNKNOWN (CONTACT/OWNER)
DOWN TOWN FULL SERVICE SHELL (114 W 8TH ST in ANDERSON, IN)
STATE MASTER (Indiana facility tracking) - CRTK-4010, EPCRA, LUST-199605512, LEAKING STORAGE TANK, LUST-199907528, UST-154, UNDERGROUND STORAGE TANK PROGRAM (Resource Conservation and Recovery Act (tracking hazardous waste)) Organizations: EQUILON ENTERPRISES LLC (CONTACT/OWNER)
Alternative names: SHELL SVC STA 137223
Q LUBE (529 JACKSON ST in ANDERSON, IN)
STATE MASTER (Indiana facility tracking) - CRTK-4236, EPCRA (Resource Conservation and Recovery Act (tracking hazardous waste)) Organizations: QUAKER STATE MINIT LUBE INC (CONTACT/OWNER)
Alternative names: MCQUIKS 9618
BARBER MFG (1824 BROWN ST in ANDERSON, IN)
STATE MASTER (Indiana facility tracking) - LUST-199504520, LEAKING STORAGE TANK, UST-19244, UNDERGROUND STORAGE TANK PROGRAM Conditionally Exempt Small Quantity Generators, less than 100 kg/month of hazardous waste (Resource Conservation and Recovery Act (tracking hazardous waste)) Organizations: BARBER JOHN (CONTACT/OWNER)
Housing units lacking complete plumbing facilities: 9.3% Housing units lacking complete kitchen facilities: 8.8%
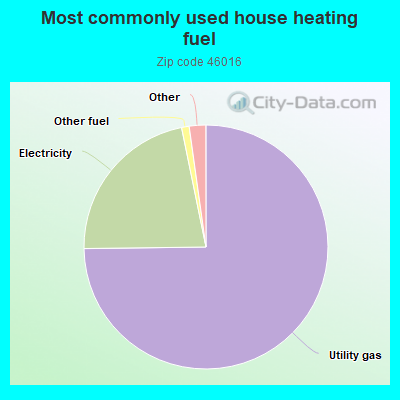
74.8%Utility gas
22.0%Electricity
1.0%Other fuel
0.9%Bottled, tank, or LP gas
0.8%Fuel oil, kerosene, etc.
Population in 1990: 22,838.
Place of birth for U.S.-born residents:
This state: 14,362
Northeast: 212
Midwest: 1,404
South: 1,487
West: 477
49% of the 46016 zip code residents lived in the same house 5 years ago. Out of people who lived in different houses, 74% lived in this county. Out of people who lived in different counties, 50% lived in Indiana.
85% of the 46016 zip code residents lived in the same house 1 year ago. Out of people who lived in different houses, 75% moved from this county. Out of people who lived in different houses, 15% moved from different county within same state. Out of people who lived in different houses, 3% moved from different state. Out of people who lived in different houses, 3% moved from abroad.
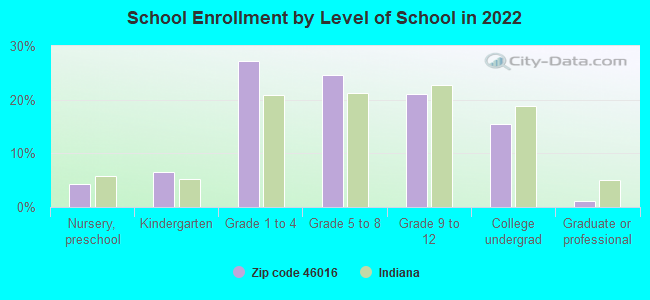
Private vs. public school enrollment:
Students in private schools in grades 1 to 8 (elementary and middle school): 262
Here:
11.1%
Indiana:
14.9%
Students in private schools in grades 9 to 12 (high school): 116
Here:
12.2%
Indiana:
11.4%
Students in private undergraduate colleges: 201
Here:
28.2%
Indiana:
22.3%
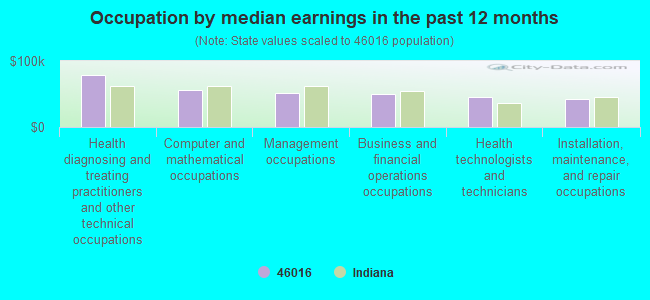
Occupation by median earnings in the past 12 months ($)
79,030Health diagnosing and treating practitioners and other technical occupations
55,396Computer and mathematical occupations
51,395Management occupations
50,411Business and financial operations occupations
45,046Health technologists and technicians
42,455Installation, maintenance, and repair occupations
Companies with federal contracts located in this zip code:
DOCUMENT MANAGEMENT SOLUTIONS (724 W 8TH ST in ANDERSON, IN; small business)
$9,500 with Army for ADP Input/Output and Storage Devices. Signed on 2005-12-12. Completion date: 2006-01-26.
STOTMY STEEN JR (1724 W 23RD STREET in ANDERSON, IN; small business) : $5,600 in 2 contractsin 2003
$5,600 with Army for Snow Removal/Salt Service (also spreading aggregate or other snow melting material). Signed on 2003-11-01. Completion date: 2004-10-31.
$0, same as above.Signed on 2003-11-01. Completion date: 2004-10-31.
Top industries in this zip code by the number of employees in 2005:
Health Care and Social Assistance: General Medical and Surgical Hospitals (over 1000 employees: 1 establishment)
2003 - 2018 National Fire Incident Reporting System (NFIRS) incidents
According to the data from the years 2003 - 2018 the average number of fires per year is 51. The highest number of fire incidents - 371 took place in 2004, and the least - 0 in 2014. The data has a declining trend.
When looking into fire subcategories, the most incidents belonged to: Other (68.4%), and Outside Fires (15.6%).
Fire incident types reported to NFIRS in Zip Code 46016


 Nearest zip codes: 46013, 46017, 46012, 46011, 46064, 46056.


 According to the data from the years 2003 - 2018 the average number of fires per year is 51. The highest number of fire incidents - 371 took place in 2004, and the least - 0 in 2014. The data has a declining trend.
 When looking into fire subcategories, the most incidents belonged to: Other (68.4%), and Outside Fires (15.6%).