Estimated zip code population in 2022: 17,764 Zip code population in 2010: 16,770 Zip code population in 2000: 17,230
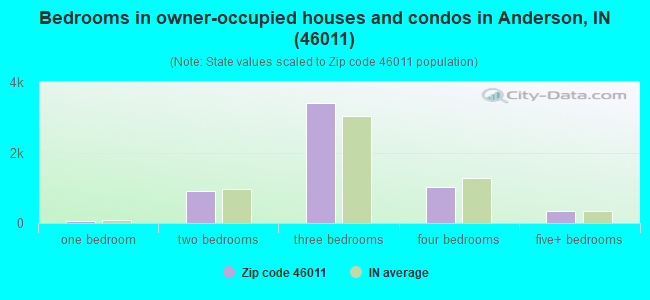
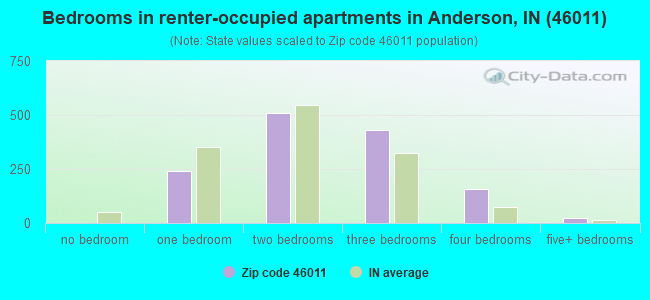
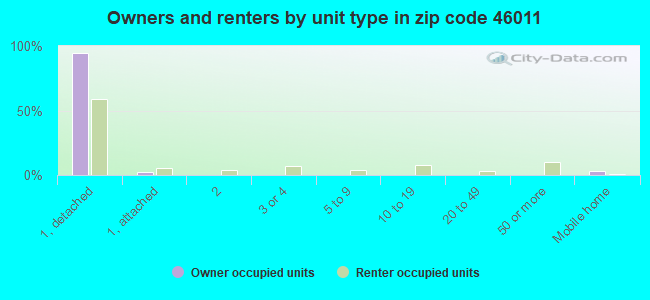
Houses and condos: 7,546 Renter-occupied apartments: 1,367
% of renters here:
19%
State:
29%
March 2022 cost of living index in zip code 46011: 84.9 (less than average, U.S. average is 100)
Land area: 74.7 sq. mi. Water area: 0.1 sq. mi.
Population density: 238 people per square mile
(very low).
OSM Map
General Map
Google Map
MSN Map
OSM Map
General Map
Google Map
MSN Map
OSM Map
General Map
Google Map
MSN Map
OSM Map
General Map
Google Map
MSN Map
Please wait while loading the map...
Real estate property taxes paid for housing units in 2022:
This zip code:
0.7% ($1,277)
Indiana:
0.7% ($1,467)
Median real estate property taxes paid for housing units with mortgages in 2022: $1,319 (0.7%) Median real estate property taxes paid for housing units with no mortgage in 2022: $1,233 (0.8%)
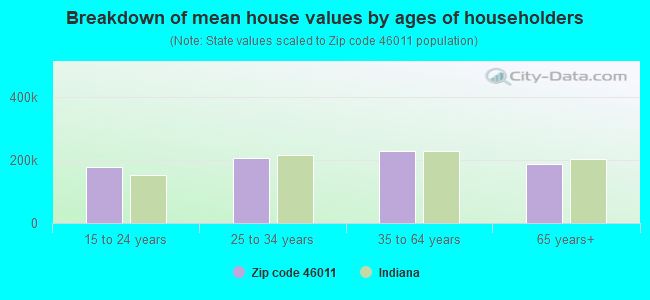
Estimated median house/condo value in 2022: $177,781
46011:
$177,781
Indiana:
$208,700
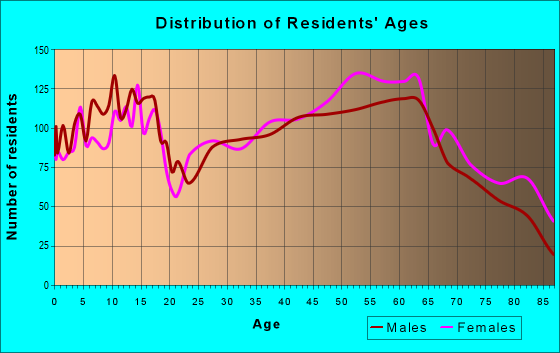
Median resident age:
This zip code:
43.5 years
Indiana median age:
38.2 years
Average household size:
This zip code:
2.4 people
Indiana:
2.4 people
Averages for the 2020 tax year for zip code 46011, filed in 2021:
Average Adjusted Gross Income (AGI) in 2020: $59,534 (Individual Income Tax Returns)
Here:
$59,534
State:
$64,978
Salary/wage: $51,073 (reported on 77.7% of returns)
Here:
$51,073
State:
$55,245
(% of AGI for various income ranges: 975.1% for AGIs below $25k, 3233.2% for AGIs $25k-50k, 6190.8% for AGIs $50k-75k, 8649.5% for AGIs $75k-100k, 16501.7% for AGIs $100k-200k, 64391.7% for AGIs over 200k)
Taxable interest for individuals: $998 (reported on 24.4% of returns)
This zip code:
$998
Indiana:
$1,351
(% of AGI for various income ranges: 10.2% for AGIs below $25k, 21.9% for AGIs $25k-50k, 25.8% for AGIs $50k-75k, 41.0% for AGIs $75k-100k, 91.0% for AGIs $100k-200k, 620.0% for AGIs over 200k)
Ordinary dividends: $5,344 (reported on 15.8% of returns)
Here:
$5,344
State:
$5,827
(% of AGI for various income ranges: 18.6% for AGIs below $25k, 35.8% for AGIs $25k-50k, 63.0% for AGIs $50k-75k, 105.8% for AGIs $75k-100k, 373.0% for AGIs $100k-200k, 4045.0% for AGIs over 200k)
Net capital gain/loss in AGI: +$23,608 (reported on 13.9% of returns)
Here:
+$23,608
State:
+$17,730
(% of AGI for various income ranges: 10.5% for AGIs below $25k, 28.7% for AGIs $25k-50k, 56.4% for AGIs $50k-75k, 149.7% for AGIs $75k-100k, 563.8% for AGIs $100k-200k, 35760.0% for AGIs over 200k)
Profit/loss from business: +$11,995 (reported on 12.1% of returns)
Here:
+$11,995
State:
+$12,144
(% of AGI for various income ranges: 59.5% for AGIs below $25k, 96.3% for AGIs $25k-50k, 156.9% for AGIs $50k-75k, 281.7% for AGIs $75k-100k, 638.7% for AGIs $100k-200k, 3230.0% for AGIs over 200k)
Taxable individual retirement arrangement distribution: $15,414 (reported on 10.4% of returns)
46011:
$15,414
Indiana:
$18,302
(% of AGI for various income ranges: 44.3% for AGIs below $25k, 99.3% for AGIs $25k-50k, 202.8% for AGIs $50k-75k, 382.3% for AGIs $75k-100k, 733.5% for AGIs $100k-200k, 3008.3% for AGIs over 200k)
Total itemized deductions: $34,685 (reported on 4.1% of returns)
Here:
$34,685
State:
$35,601
(% of AGI for various income ranges: 41.5% for AGIs below $25k, 57.3% for AGIs $25k-50k, 119.9% for AGIs $50k-75k, 231.5% for AGIs $75k-100k, 535.7% for AGIs $100k-200k, 6776.7% for AGIs over 200k)
Charity contributions: $15,596 (reported on 3.4% of returns)
Here:
$15,596
State:
$15,596
(% of AGI for various income ranges: 12.7% for AGIs $25k-50k, 32.5% for AGIs $50k-75k, 62.2% for AGIs $75k-100k, 182.5% for AGIs $100k-200k, 3855.0% for AGIs over 200k)
Taxes paid: $6,974 (reported on 4.1% of returns)
46011:
$6,974
State:
$7,542
(% of AGI for various income ranges: 4.5% for AGIs below $25k, 7.5% for AGIs $25k-50k, 22.4% for AGIs $50k-75k, 52.2% for AGIs $75k-100k, 140.8% for AGIs $100k-200k, 1228.3% for AGIs over 200k)
Earned income credit: $2,308 (reported on 15.1% of returns)
Here:
$2,308
State:
$2,298
(% of AGI for various income ranges: 90.4% for AGIs below $25k, 62.9% for AGIs $25k-50k, 1.8% for AGIs $50k-75k)
Percentage of individuals using paid preparers for their 2020 taxes: 92.8%
Here:
93%
State:
94%
(% for various income ranges: 91.4% for AGIs below $25k, 93.5% for AGIs $25k-50k, 93.9% for AGIs $50k-75k, 92.9% for AGIs $75k-100k, 92.7% for AGIs $100k-200k, 95.0% for AGIs over 200k)
Averages for the 2012 tax year for zip code 46011, filed in 2013:
Average Adjusted Gross Income (AGI) in 2012: $55,842 (Individual Income Tax Returns)
Here:
$55,842
State:
$52,932
Salary/wage: $39,580 (reported on 82.8% of returns)
Here:
$39,580
State:
$45,173
(% of AGI for various income ranges: 62.3% for AGIs below $25k, 68.2% for AGIs $25k-50k, 69.6% for AGIs $50k-75k, 67.9% for AGIs $75k-100k, 68.2% for AGIs $100k-200k, 26.2% for AGIs over 200k)
Taxable interest for individuals: $1,368 (reported on 30.3% of returns)
This zip code:
$1,368
Indiana:
$1,311
(% of AGI for various income ranges: 0.9% for AGIs below $25k, 0.7% for AGIs $25k-50k, 0.5% for AGIs $50k-75k, 0.7% for AGIs $75k-100k, 0.7% for AGIs $100k-200k, 0.9% for AGIs over 200k)
Ordinary dividends: $4,893 (reported on 18.6% of returns)
Here:
$4,893
State:
$4,690
(% of AGI for various income ranges: 1.1% for AGIs below $25k, 1.1% for AGIs $25k-50k, 1.2% for AGIs $50k-75k, 1.2% for AGIs $75k-100k, 2.3% for AGIs $100k-200k, 2.1% for AGIs over 200k)
Net capital gain/loss in AGI: +$16,405 (reported on 13.5% of returns)
Here:
+$16,405
State:
+$10,406
(% of AGI for various income ranges: 0.4% for AGIs $50k-75k, 0.5% for AGIs $75k-100k, 1.8% for AGIs $100k-200k, 15.7% for AGIs over 200k)
Profit/loss from business: +$11,130 (reported on 12.5% of returns)
Here:
+$11,130
State:
+$11,105
(% of AGI for various income ranges: 5.5% for AGIs below $25k, 1.5% for AGIs $25k-50k, 1.4% for AGIs $50k-75k, 2.2% for AGIs $75k-100k, 2.4% for AGIs $100k-200k, 3.2% for AGIs over 200k)
Taxable individual retirement arrangement distribution: $13,595 (reported on 13.6% of returns)
46011:
$13,595
Indiana:
$13,841
(% of AGI for various income ranges: 3.0% for AGIs below $25k, 2.6% for AGIs $25k-50k, 3.3% for AGIs $50k-75k, 4.0% for AGIs $75k-100k, 4.6% for AGIs $100k-200k, 2.2% for AGIs over 200k)
Self-employment retirement plans: $27,700 (reported on 0.2% of returns)
46011:
$27,700
Indiana:
$21,482
Total itemized deductions: $20,156 (17% of AGI, reported on 26.8% of returns)
Here:
$20,156
State:
$20,913
Here:
17.5% of AGI
State:
18.2% of AGI
(% of AGI for various income ranges: 7.4% for AGIs below $25k, 8.1% for AGIs $25k-50k, 9.1% for AGIs $50k-75k, 9.9% for AGIs $75k-100k, 12.7% for AGIs $100k-200k, 9.1% for AGIs over 200k)
Charity contributions: $5,308 (reported on 21.2% of returns)
Here:
$5,308
State:
$4,697
(% of AGI for various income ranges: 0.9% for AGIs below $25k, 1.2% for AGIs $25k-50k, 1.6% for AGIs $50k-75k, 1.9% for AGIs $75k-100k, 2.8% for AGIs $100k-200k, 2.6% for AGIs over 200k)
Taxes paid: $6,995 (reported on 26.6% of returns)
46011:
$6,995
State:
$7,456
(% of AGI for various income ranges: 1.2% for AGIs below $25k, 1.9% for AGIs $25k-50k, 2.6% for AGIs $50k-75k, 3.1% for AGIs $75k-100k, 5.1% for AGIs $100k-200k, 4.2% for AGIs over 200k)
Earned income credit: $2,228 (reported on 16.3% of returns)
Here:
$2,228
State:
$2,265
(% of AGI for various income ranges: 5.9% for AGIs below $25k, 1.0% for AGIs $25k-50k)
Percentage of individuals using paid preparers for their 2012 taxes: 51.0%
Here:
51%
State:
53%
(% for various income ranges: 45.8% for AGIs below $25k, 49.5% for AGIs $25k-50k, 53.3% for AGIs $50k-75k, 59.0% for AGIs $75k-100k, 58.1% for AGIs $100k-200k, 81.2% for AGIs over 200k)
Averages for the 2004 tax year for zip code 46011, filed in 2005:
Average Adjusted Gross Income (AGI) in 2004: $48,622 (Individual Income Tax Returns)
Here:
$48,622
State:
$44,790
Salary/wage: $39,505 (reported on 85.5% of returns)
Here:
$39,505
State:
$39,615
(% of AGI for various income ranges: 112.4% for AGIs below $10k, 61.4% for AGIs $10k-25k, 70.8% for AGIs $25k-50k, 73.4% for AGIs $50k-75k, 78.6% for AGIs $75k-100k, 62.0% for AGIs over 100k)
Taxable interest for individuals: $1,864 (reported on 47.8% of returns)
This zip code:
$1,864
Indiana:
$1,535
(% of AGI for various income ranges: 6.8% for AGIs below $10k, 3.2% for AGIs $10k-25k, 1.7% for AGIs $25k-50k, 1.4% for AGIs $50k-75k, 1.4% for AGIs $75k-100k, 2.0% for AGIs over 100k)
Taxable dividends: $3,996 (reported on 26.2% of returns)
Here:
$3,996
State:
$2,998
(% of AGI for various income ranges: 6.5% for AGIs below $10k, 1.6% for AGIs $10k-25k, 1.2% for AGIs $25k-50k, 1.4% for AGIs $50k-75k, 1.4% for AGIs $75k-100k, 3.5% for AGIs over 100k)
Net capital gain/loss: +$5,368 (reported on 19.9% of returns)
Here:
+$5,368
State:
+$8,619
(% of AGI for various income ranges: -0.9% for AGIs below $10k, 0.4% for AGIs $10k-25k, 0.2% for AGIs $25k-50k, 0.8% for AGIs $50k-75k, 1.2% for AGIs $75k-100k, 5.2% for AGIs over 100k)
Profit/loss from business: +$12,021 (reported on 12.3% of returns)
Here:
+$12,021
State:
+$10,071
(% of AGI for various income ranges: 8.6% for AGIs below $10k, 2.3% for AGIs $10k-25k, 1.8% for AGIs $25k-50k, 1.5% for AGIs $50k-75k, 2.6% for AGIs $75k-100k, 4.9% for AGIs over 100k)
IRA payment deduction: $2,949 (reported on 1.7% of returns)
46011:
$2,949
Indiana:
$2,840
(% of AGI for various income ranges: 0.1% for AGIs $10k-25k, 0.1% for AGIs $25k-50k, 0.1% for AGIs $50k-75k, 0.1% for AGIs $75k-100k, 0.1% for AGIs over 100k)
Self-employed pension: $11,226 (reported on 0.7% of returns)
Here:
$11,226
Indiana:
$15,305
Total itemized deductions: $17,273 (20% of AGI, reported on 35.1% of returns)
Here:
$17,273
State:
$17,065
Here:
20.4% of AGI
State:
19.5% of AGI
(% of AGI for various income ranges: 19.4% for AGIs below $10k, 11.4% for AGIs $10k-25k, 10.0% for AGIs $25k-50k, 11.5% for AGIs $50k-75k, 13.1% for AGIs $75k-100k, 14.2% for AGIs over 100k)
Charity contributions deductions: $4,443 (5% of AGI, reported on 29.3% of returns)
Here:
$4,443
State:
$3,550
Here:
4.9% of AGI
State:
3.8% of AGI
(% of AGI for various income ranges: 1.1% for AGIs below $10k, 1.3% for AGIs $10k-25k, 1.5% for AGIs $25k-50k, 2.1% for AGIs $50k-75k, 2.4% for AGIs $75k-100k, 4.2% for AGIs over 100k)
Total tax: $7,092 (reported on 78.3% of returns)
46011:
$7,092
State:
$6,914
(% of AGI for various income ranges: 2.4% for AGIs below $10k, 3.7% for AGIs $10k-25k, 6.9% for AGIs $25k-50k, 9.0% for AGIs $50k-75k, 10.9% for AGIs $75k-100k, 17.8% for AGIs over 100k)
Earned income credit: $1,623 (reported on 11.3% of returns)
Here:
$1,623
State:
$1,685
Percentage of individuals using paid preparers for their 2004 taxes: 59.6%
Here:
60%
State:
59%
(% for various income ranges: 47.2% for AGIs below $10k, 60.9% for AGIs $10k-25k, 61.8% for AGIs $25k-50k, 62.0% for AGIs $50k-75k, 58.6% for AGIs $75k-100k, 70.2% for AGIs over 100k)
Likely homosexual households (counted as self-reported same-sex unmarried-partner households)
Lesbian couples: 0.2% of all households
Gay men: 0.0% of all households
Household received Food Stamps/SNAP in the past 12 months: 737 Household did not receive Food Stamps/SNAP in the past 12 months: 6,328
Women who had a birth in the past 12 months: 240 (171 now married, 69 unmarried) Women who did not have a birth in the past 12 months: 3,551 (1,833 now married, 1,723 unmarried)
Housing units in zip code 46011 with a mortgage: 3,779 (575 second mortgage, 29 home equity loan, 504 both second mortgage and home equity loan) Houses without a mortgage: 113
Median monthly owner costs for units with a mortgage: $1,178 Median monthly owner costs for units without a mortgage: $469
Residents with income below the poverty level in 2022:
This zip code:
11.1%
Whole state:
12.6%
Residents with income below 50% of the poverty level in 2022:
This zip code:
7.3%
Whole state:
6.3%
Median number of rooms in houses and condos:
Here:
6.7
State:
6.6
Median number of rooms in apartments:
Here:
4.8
State:
4.3
Notable locations in this zip code not listed on our city pages
Notable locations in zip code 46011: Grandview Country Club (A), Shuter Sunset Farms (B), Edgewood Country Club (C), Edgewood Fire Department (D), Frankton Volunteer Fire Department Station 2 (E), Anderson Fire Department Station 4 (F). Display/hide their locations on the map
Churches in zip code 46011 include: Bailey Chapel (A), Beall Chapel (B), Bethel Church (C), Ironwood Church (D), Cloverdale Church (E), Mount Hope Church (F), Old German Church (G), Park Road Church (H), Elm Grove Church (I). Display/hide their locations on the map
In group quarters: 430 (-1 institutionalized population)
Size of family households: 2,482 2-persons, 1,273 3-persons, 650 4-persons, 348 5-persons, 61 6-persons, 189 7-or-more-persons
Size of nonfamily households: 1,739 1-person, 289 2-persons, 37 3-persons
2,760 married couples with children.
479 single-parent households (110 men, 369 women).
96.3% of residents of 46011 zip code speak English at home.
2.7% of residents speak Spanish at home (69% very well, 18% well, 14% not well).
0.4% of residents speak other Indo-European language at home (76% very well, 16% well, 8% not well).
0.3% of residents speak Asian or Pacific Island language at home (33% very well, 23% well, 44% not well).
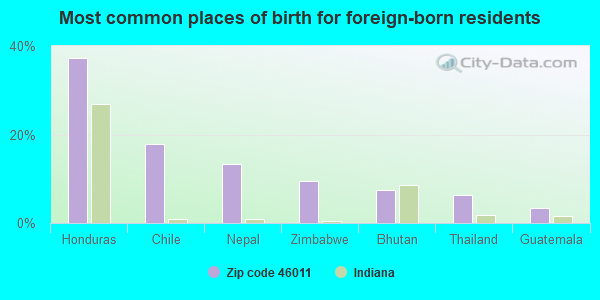
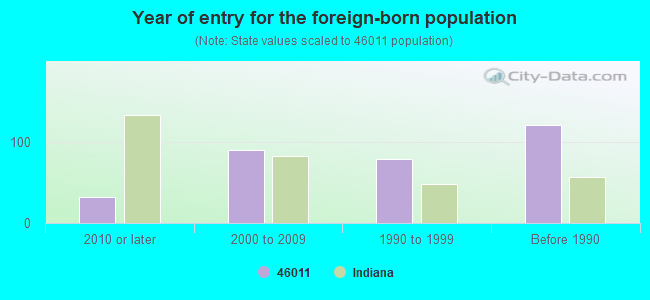
Foreign born population: 241 (1.4%) (43.0% of them are naturalized citizens)
This zip code:
1.4%
Whole state:
6.1%
37%Honduras
18%Chile
13%Nepal
10%Zimbabwe
7%Bhutan
6%Thailand
3%Guatemala
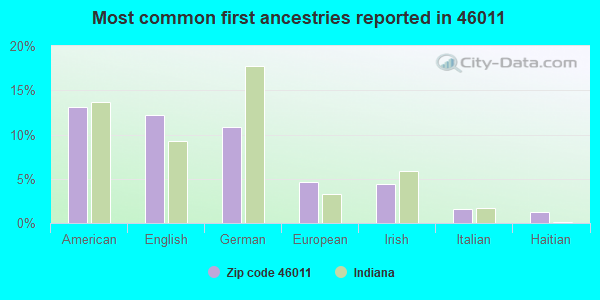
13%American
12%English
11%German
5%European
4%Irish
2%Italian
1%Haitian
Year of entry for the foreign-born population
322010 or later
902000 to 2009
791990 to 1999
121Before 1990
Major facilities with environmental interests located in this zip code:
ANDERSON MUNICIPAL SEWAGE TREATMENT PLANTS (2801 GENE GUSTIN WAY in ANDERSON, IN)
ENFORCEMENT/COMPLIANCE ACTIVITY (Integrated Compliance Information System) - ICIS-05-2000-0630, FORMAL ENFORCEMENT ACTION (Integrated Compliance Information System) - ICIS-05-2000-0630, FORMAL ENFORCEMENT ACTION STATE MASTER (Indiana facility tracking) - UST-893, UNDERGROUND STORAGE TANK PROGRAM, CRTK-474, EPCRA National Pollutant Discharge Elimination System MAJOR (Tracking pollutant discharge elimination systems) - permit - ICIS-, ENFORCEMENT/COMPLIANCE ACTIVITY, ICIS-05-2000-0630, FORMAL ENFORCEMENT ACTION Business SIC classification: SEWERAGE SYSTEMS Organizations: RANDY HAMILTON 14702 (CONTACT/OPERATOR)
, ANDERSON WWTP (CONTACT/OWNER)
Alternative names: ANDERSON MUNICIPAL STP, ANDERSON S.T.P., ANDERSON WWTP
MCLAIN TRUCKING INC (2425 WALTON ST in ANDERSON, IN)
STATE MASTER (Indiana facility tracking) - UST-5881, UNDERGROUND STORAGE TANK PROGRAM (Resource Conservation and Recovery Act (tracking hazardous waste))
ANDERSON ST DEPT SITE 1 (550 BAXTER RD in ANDERSON, IN)
STATE MASTER (Indiana facility tracking) - LUST-199812515, LEAKING STORAGE TANK, UST-926, UNDERGROUND STORAGE TANK PROGRAM (Resource Conservation and Recovery Act (tracking hazardous waste)) Alternative names: ANDERSON CITY OF STREET DEPT
ANDERSON WTR UTILITY SITE 2 (550 BAXTER RD in ANDERSON, IN)
STATE MASTER (Indiana facility tracking) - CRTK-8164, EPCRA, LUST-199812516, LEAKING STORAGE TANK, UST-9890, UNDERGROUND STORAGE TANK PROGRAM (Resource Conservation and Recovery Act (tracking hazardous waste)) Organizations: ANDERSON CITY OF (CONTACT/OWNER)
Alternative names: ANDERSON WATER UTILITY
CLARK OIL #1790 (2717 NICHOL AVE in ANDERSON, IN)
STATE MASTER (Indiana facility tracking) - CRTK-8784, EPCRA, UST-2940, UNDERGROUND STORAGE TANK PROGRAM (Resource Conservation and Recovery Act (tracking hazardous waste)) Organizations: CLARK RETAIL ENTERPRISES INC (CONTACT/OWNER)
Alternative names: CLARK STORE 1790
MARATHON CAR WASH (2833 NICHOL AVE in ANDERSON, IN)
STATE MASTER (Indiana facility tracking) - CRTK-9467, EPCRA, LUST-199303504, LEAKING STORAGE TANK, UST-5467, UNDERGROUND STORAGE TANK PROGRAM (Resource Conservation and Recovery Act (tracking hazardous waste)) Organizations: MARATHON OIL CO (CONTACT/OWNER)
Alternative names: MARATHON OIL CO UNIT 2505
MARATHON SERVICE STATION 2196 (922 E 8TH ST in ANDERSON, IN)
STATE MASTER (Indiana facility tracking) - LUST-199108542, LEAKING STORAGE TANK, UST-5432, UNDERGROUND STORAGE TANK PROGRAM (Resource Conservation and Recovery Act (tracking hazardous waste)) Organizations: MARATHON OIL CO (CONTACT/OWNER)
Alternative names: MARATHON UNIT 2196
AMERITECH GARAGE (2712 ECKHOUSE ST in ANDERSON, IN)
STATE MASTER (Indiana facility tracking) - UST-3890, UNDERGROUND STORAGE TANK PROGRAM, CRTK-769, EPCRA, LUST-199301527, LEAKING STORAGE TANK Conditionally Exempt Small Quantity Generators, less than 100 kg/month of hazardous waste (Resource Conservation and Recovery Act (tracking hazardous waste)) - notification Organizations: IN BELL TELEPHONE CO INC (CONTACT/OWNER)
Alternative names: INDIANA BELL TELEPHONE CO N16115
AT & T ANDERSON RADIO TOWER (3712 ECKHOUSE ST in ANDERSON, IN)
STATE MASTER (Indiana facility tracking) - CRTK-6768, EPCRA, LUST-199212518, LEAKING STORAGE TANK, UST-985, UNDERGROUND STORAGE TANK PROGRAM Conditionally Exempt Small Quantity Generators, less than 100 kg/month of hazardous waste (Resource Conservation and Recovery Act (tracking hazardous waste)) - notification Organizations: AT & T CORP. (CONTACT/OWNER)
Alternative names: AT&T CORP
COCA COLA BOTTLING CO (3200 E 38TH in ANDERSON, IN)
STATE MASTER (Indiana facility tracking) - CRTK-2253, EPCRA, LUST-199109542, LEAKING STORAGE TANK, UST-3473, UNDERGROUND STORAGE TANK PROGRAM Conditionally Exempt Small Quantity Generators, less than 100 kg/month of hazardous waste (Resource Conservation and Recovery Act (tracking hazardous waste)) - notification Organizations: COCA COLA ENTERPRISES INC (CONTACT/OWNER)
Alternative names: COCA COLA BOTTLING CO ANDERSON
MADISON COUNTY HIGHWAY GARAGE (2830 W EIGHTH ST in ANDERSON, IN)
STATE MASTER (Indiana facility tracking) - CRTK-6707, EPCRA, LUST-198908012, LEAKING STORAGE TANK, UST-5804, UNDERGROUND STORAGE TANK PROGRAM Conditionally Exempt Small Quantity Generators, less than 100 kg/month of hazardous waste (Resource Conservation and Recovery Act (tracking hazardous waste))
MORGAN-FENNER ELEMENTARY SCHOOL (2010 BRENTWOOD DR in ANDERSON, IN)
(National Center for Education Statistics) - STATE ID-5129 Organizations: ANDERSON COMMUNITY SCHOOL CORP (SCHOOL DISTRICT)
NEW FUTURES LEARNING CENTER (2001 ASHBOURNE RD in ANDERSON, IN)
(National Center for Education Statistics) - STATE ID-5084 Organizations: ANDERSON COMMUNITY SCHOOL CORP (SCHOOL DISTRICT)
Housing units lacking complete plumbing facilities: 2.1% Housing units lacking complete kitchen facilities: 1.8%
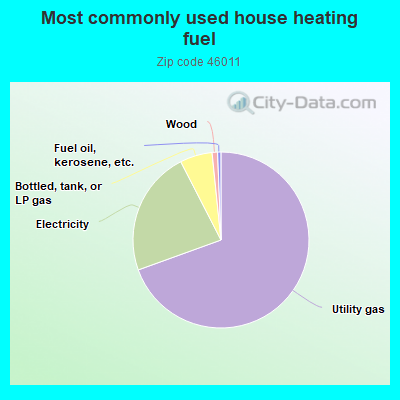
69.0%Utility gas
22.8%Electricity
5.9%Bottled, tank, or LP gas
1.0%Wood
0.6%Fuel oil, kerosene, etc.
Population in 1990: 17,280.
Place of birth for U.S.-born residents:
This state: 12,804
Northeast: 413
Midwest: 1,783
South: 1,884
West: 429
63% of the 46011 zip code residents lived in the same house 5 years ago. Out of people who lived in different houses, 76% lived in this county. Out of people who lived in different counties, 50% lived in Indiana.
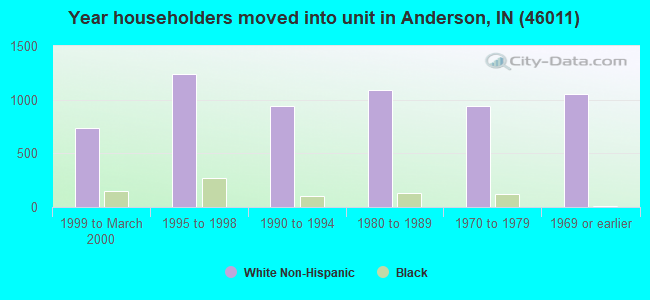
91% of the 46011 zip code residents lived in the same house 1 year ago. Out of people who lived in different houses, 60% moved from this county. Out of people who lived in different houses, 25% moved from different county within same state. Out of people who lived in different houses, 15% moved from different state. Out of people who lived in different houses, 0% moved from abroad.
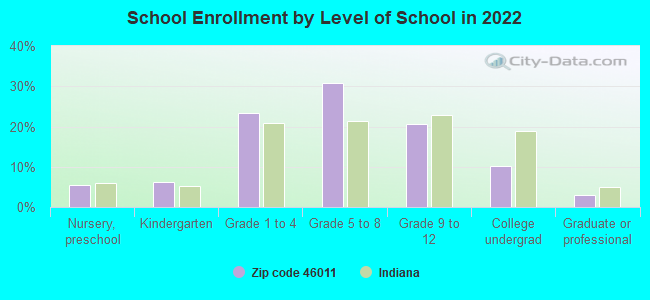
Private vs. public school enrollment:
Students in private schools in grades 1 to 8 (elementary and middle school): 253
Here:
13.7%
Indiana:
14.9%
Students in private schools in grades 9 to 12 (high school): 159
Here:
22.7%
Indiana:
11.4%
Students in private undergraduate colleges: 123
Here:
35.1%
Indiana:
22.3%
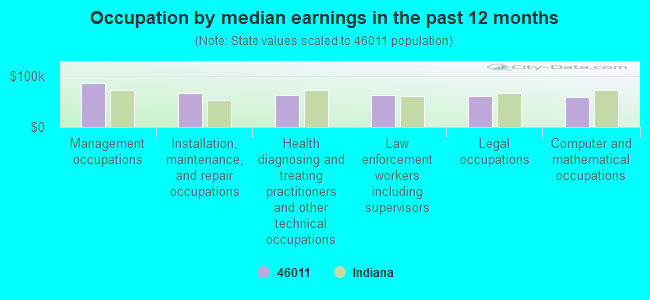
Occupation by median earnings in the past 12 months ($)
86,263Management occupations
67,218Installation, maintenance, and repair occupations
63,673Health diagnosing and treating practitioners and other technical occupations
63,184Law enforcement workers including supervisors
61,571Legal occupations
59,523Computer and mathematical occupations
Companies with federal contracts located in this zip code:
BOANERGS, INC (3044 WEST 18TH STREET in ANDERSON, IN; small business) : $6,225 in 5 contractsfrom 2003 to 2004
Contracts for Landscaping/Groundskeeping Services by Army Signed by year:2000: $0; 2001: $0; 2002: $0; 2003: $3,047; 2004: $3,178; 2005: $0; 2006: $0.
Biggest contracts:
$2,933 with Army for Landscaping/Groundskeeping Services. Signed on 2004-03-21. Completion date: 2004-03-31.
$2,887, same as above.Signed on 2003-03-08. Completion date: 2004-03-31.
$245, same as above.Signed on 2004-11-03. Completion date: 2005-03-31.
$160, same as above.Signed on 2003-12-31. Completion date: 2004-03-31.
DOVEY CORPORATION (3220 W 25TH ST in ANDERSON, IN; small business) : $285 in 2 contractsin 2004
$6,129 with Army for Miscellaneous Special Industry Machinery. Signed on 2004-09-22. Completion date: 2004-10-29.
-$5,844 with Air Force for Motor Vehicle Maintenance and Repair Shop Specialized Equipment. Signed on 2004-12-14. Completion date: 2004-09-24.
Top industries in this zip code by the number of employees in 2005:
Health Care and Social Assistance: General Medical and Surgical Hospitals (over 1000 employees: 1 establishment)
Health Care and Social Assistance: Nursing Care Facilities (100-249: 2, 20-49: 1)
2002 - 2018 National Fire Incident Reporting System (NFIRS) incidents
Based on the data from the years 2002 - 2018 the average number of fires per year is 32. The highest number of fires - 54 took place in 2011, and the least - 9 in 2014. The data has a declining trend.
When looking into fire subcategories, the most reports belonged to: Outside Fires (45.0%), and Structure Fires (42.2%).
Fire incident types reported to NFIRS in Zip Code 46011


 Nearest zip codes: 46016, 46044, 46051, 46013, 46012, 46063.


 Based on the data from the years 2002 - 2018 the average number of fires per year is 32. The highest number of fires - 54 took place in 2011, and the least - 9 in 2014. The data has a declining trend.
 When looking into fire subcategories, the most reports belonged to: Outside Fires (45.0%), and Structure Fires (42.2%).