Estimated zip code population in 2022: 2,705 Zip code population in 2010: 2,965 Zip code population in 2000: 2,976
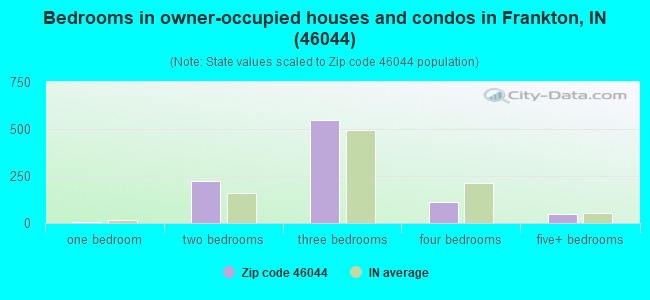
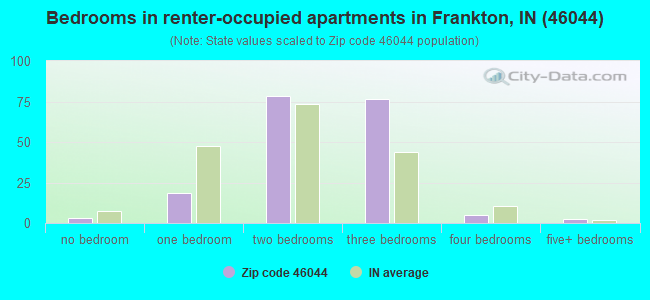
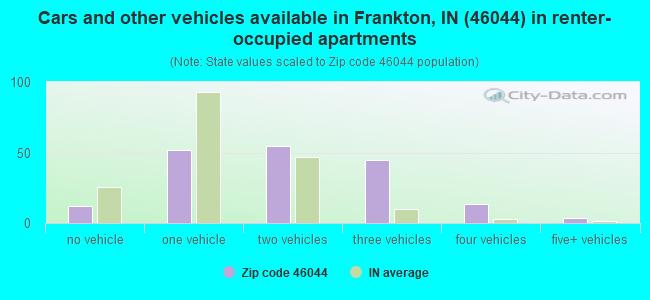
Houses and condos: 1,170 Renter-occupied apartments: 185
% of renters here:
17%
State:
29%
March 2022 cost of living index in zip code 46044: 85.1 (less than average, U.S. average is 100)
Land area: 21.9 sq. mi. Water area: 0.0 sq. mi.
Population density: 124 people per square mile
(very low).
OSM Map
General Map
Google Map
MSN Map
OSM Map
General Map
Google Map
MSN Map
OSM Map
General Map
Google Map
MSN Map
OSM Map
General Map
Google Map
MSN Map
Please wait while loading the map...
Real estate property taxes paid for housing units in 2022:
This zip code:
0.7% ($1,096)
Indiana:
0.7% ($1,467)
Median real estate property taxes paid for housing units with mortgages in 2022: $1,184 (0.7%) Median real estate property taxes paid for housing units with no mortgage in 2022: $920 (0.7%)
Business Search- 14 Million verified businesses
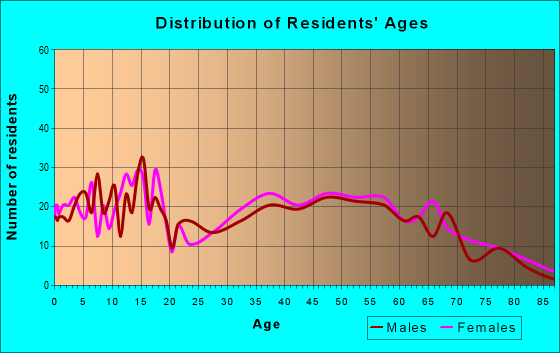
Males: 1,322
(48.9%)
Females: 1,383
(51.1%)
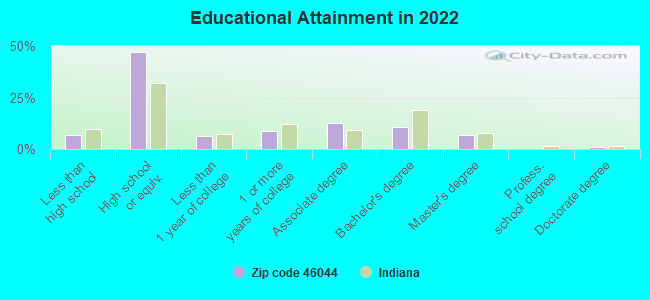
For population 25 years and over in 46044:
High school or higher: 92.1%
Bachelor's degree or higher: 18.1%
Graduate or professional degree: 7.7%
Unemployed: 1.5%
Mean travel time to work (commute): 31.2 minutes
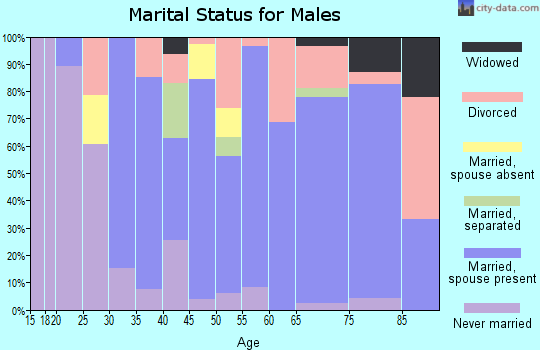
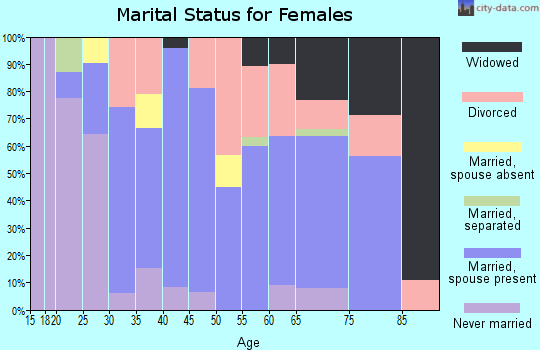
For population 15 years and over in 46044:
Never married: 23.9%
Now married: 58.6%
Separated: 0.6%
Widowed: 6.4%
Divorced: 10.5%
Zip code 46044 compared to state average:
Unemployed percentage below state average.
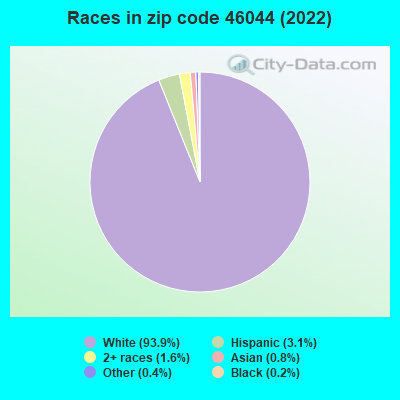
Black race population percentage significantly below state average.
Hispanic race population percentage below state average.
Median age significantly above state average.
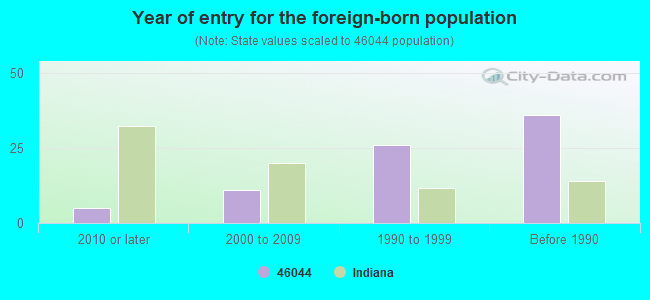
Foreign-born population percentage significantly below state average.
Renting percentage below state average.
Length of stay since moving in significantly above state average.
Number of college students below state average.
Percentage of population with a bachelor's degree or higher below state average.
Estimated median house/condo value in 2022: $159,708
46044:
$159,708
Indiana:
$208,700
Median resident age:
This zip code:
46.8 years
Indiana median age:
38.2 years
Average household size:
This zip code:
2.4 people
Indiana:
2.4 people
Averages for the 2020 tax year for zip code 46044, filed in 2021:
Average Adjusted Gross Income (AGI) in 2020: $54,642 (Individual Income Tax Returns)
Here:
$54,642
State:
$64,978
Salary/wage: $53,246 (reported on 80.8% of returns)
Here:
$53,246
State:
$55,245
(% of AGI for various income ranges: 973.5% for AGIs below $25k, 3410.3% for AGIs $25k-50k, 6475.0% for AGIs $50k-75k, 10062.5% for AGIs $75k-100k, 15529.2% for AGIs $100k-200k)
Taxable interest for individuals: $412 (reported on 21.9% of returns)
This zip code:
$412
Indiana:
$1,351
(% of AGI for various income ranges: 14.7% for AGIs below $25k, 8.5% for AGIs $25k-50k, 3.9% for AGIs $50k-75k, 15.0% for AGIs $75k-100k, 24.2% for AGIs $100k-200k)
Ordinary dividends: $1,433 (reported on 10.3% of returns)
Here:
$1,433
State:
$5,827
(% of AGI for various income ranges: 4.4% for AGIs below $25k, 7.9% for AGIs $25k-50k, 13.3% for AGIs $50k-75k, 44.2% for AGIs $75k-100k, 80.8% for AGIs $100k-200k)
Net capital gain/loss in AGI: +$9,255 (reported on 7.5% of returns)
Here:
+$9,255
State:
+$17,730
(% of AGI for various income ranges: 9.1% for AGIs $25k-50k, 51.7% for AGIs $50k-75k, 745.8% for AGIs $100k-200k)
Profit/loss from business: +$6,086 (reported on 9.6% of returns)
Here:
+$6,086
State:
+$12,144
(% of AGI for various income ranges: 35.6% for AGIs below $25k, 3.9% for AGIs $25k-50k, 219.4% for AGIs $50k-75k, 269.2% for AGIs $100k-200k)
Taxable individual retirement arrangement distribution: $10,150 (reported on 8.2% of returns)
46044:
$10,150
Indiana:
$18,302
(% of AGI for various income ranges: 96.5% for AGIs below $25k, 229.4% for AGIs $50k-75k, 397.5% for AGIs $100k-200k)
Total itemized deductions: $69,500 (reported on 2.1% of returns)
Here:
$69,500
State:
$35,601
(% of AGI for various income ranges: 1737.5% for AGIs $75k-100k)
Charity contributions: $24,500 (reported on 1.4% of returns)
Here:
$24,500
State:
$15,596
(% of AGI for various income ranges: 408.3% for AGIs $75k-100k)
Taxes paid: $8,000 (reported on 2.1% of returns)
46044:
$8,000
State:
$7,542
(% of AGI for various income ranges: 200.0% for AGIs $100k-200k)
Earned income credit: $2,145 (reported on 13.7% of returns)
Here:
$2,145
State:
$2,298
(% of AGI for various income ranges: 67.6% for AGIs below $25k, 60.3% for AGIs $25k-50k)
Percentage of individuals using paid preparers for their 2020 taxes: 94.5%
Here:
95%
State:
94%
(% for various income ranges: 93.5% for AGIs below $25k, 94.9% for AGIs $25k-50k, 91.7% for AGIs $50k-75k, 94.1% for AGIs $75k-100k, 100.0% for AGIs $100k-200k, 100.0% for AGIs over 200k)
Averages for the 2012 tax year for zip code 46044, filed in 2013:
Average Adjusted Gross Income (AGI) in 2012: $46,424 (Individual Income Tax Returns)
Here:
$46,424
State:
$52,932
Salary/wage: $40,068 (reported on 87.1% of returns)
Here:
$40,068
State:
$45,173
(% of AGI for various income ranges: 61.7% for AGIs below $25k, 72.9% for AGIs $25k-50k, 79.0% for AGIs $50k-75k, 84.5% for AGIs $75k-100k, 73.3% for AGIs $100k-200k)
Taxable interest for individuals: $670 (reported on 26.6% of returns)
This zip code:
$670
Indiana:
$1,311
(% of AGI for various income ranges: 0.7% for AGIs below $25k, 0.4% for AGIs $25k-50k, 0.2% for AGIs $50k-75k, 0.6% for AGIs $100k-200k)
Ordinary dividends: $2,000 (reported on 11.5% of returns)
Here:
$2,000
State:
$4,690
(% of AGI for various income ranges: 0.6% for AGIs below $25k, 0.2% for AGIs $25k-50k, 0.2% for AGIs $50k-75k, 1.2% for AGIs $100k-200k)
Net capital gain/loss in AGI: +$10,056 (reported on 6.5% of returns)
Here:
+$10,056
State:
+$10,406
(% of AGI for various income ranges: 0.7% for AGIs $25k-50k, 4.4% for AGIs $100k-200k)
Profit/loss from business: +$6,031 (reported on 11.5% of returns)
Here:
+$6,031
State:
+$11,105
(% of AGI for various income ranges: 5.5% for AGIs below $25k, 1.4% for AGIs $25k-50k, 1.3% for AGIs $50k-75k, 2.2% for AGIs $75k-100k)
Taxable individual retirement arrangement distribution: $8,292 (reported on 9.4% of returns)
46044:
$8,292
Indiana:
$13,841
(% of AGI for various income ranges: 1.6% for AGIs below $25k, 2.2% for AGIs $25k-50k, 2.1% for AGIs $50k-75k, 3.5% for AGIs $75k-100k)
Total itemized deductions: $17,510 (20% of AGI, reported on 22.3% of returns)
Here:
$17,510
State:
$20,913
Here:
19.9% of AGI
State:
18.2% of AGI
(% of AGI for various income ranges: 6.6% for AGIs $25k-50k, 9.6% for AGIs $50k-75k, 7.7% for AGIs $75k-100k, 12.0% for AGIs $100k-200k)
Charity contributions: $4,017 (reported on 17.3% of returns)
Here:
$4,017
State:
$4,697
(% of AGI for various income ranges: 0.9% for AGIs $25k-50k, 1.2% for AGIs $50k-75k, 1.2% for AGIs $75k-100k, 2.8% for AGIs $100k-200k)
Taxes paid: $6,023 (reported on 22.3% of returns)
46044:
$6,023
State:
$7,456
(% of AGI for various income ranges: 1.5% for AGIs $25k-50k, 2.7% for AGIs $50k-75k, 2.8% for AGIs $75k-100k, 5.1% for AGIs $100k-200k)
Earned income credit: $2,050 (reported on 17.3% of returns)
Here:
$2,050
State:
$2,265
(% of AGI for various income ranges: 5.3% for AGIs below $25k, 1.1% for AGIs $25k-50k)
Percentage of individuals using paid preparers for their 2012 taxes: 52.5%
Here:
53%
State:
53%
(% for various income ranges: 46.2% for AGIs below $25k, 52.6% for AGIs $25k-50k, 58.3% for AGIs $50k-75k, 58.3% for AGIs $75k-100k, 61.5% for AGIs $100k-200k)
Averages for the 2004 tax year for zip code 46044, filed in 2005:
Average Adjusted Gross Income (AGI) in 2004: $39,699 (Individual Income Tax Returns)
Here:
$39,699
State:
$44,790
Salary/wage: $34,621 (reported on 90.7% of returns)
Here:
$34,621
State:
$39,615
(% of AGI for various income ranges: 95.8% for AGIs below $10k, 64.1% for AGIs $10k-25k, 77.9% for AGIs $25k-50k, 82.5% for AGIs $50k-75k, 86.4% for AGIs $75k-100k, 74.6% for AGIs over 100k)
Taxable interest for individuals: $883 (reported on 40.9% of returns)
This zip code:
$883
Indiana:
$1,535
(% of AGI for various income ranges: 6.6% for AGIs below $10k, 1.8% for AGIs $10k-25k, 0.9% for AGIs $25k-50k, 0.3% for AGIs $50k-75k, 0.2% for AGIs $75k-100k, 1.4% for AGIs over 100k)
Taxable dividends: $561 (reported on 18.1% of returns)
Here:
$561
State:
$2,998
(% of AGI for various income ranges: 0.9% for AGIs below $10k, 0.5% for AGIs $10k-25k, 0.2% for AGIs $25k-50k, 0.1% for AGIs $50k-75k, 0.2% for AGIs $75k-100k, 0.4% for AGIs over 100k)
Net capital gain/loss: +$1,732 (reported on 8.8% of returns)
Here:
+$1,732
State:
+$8,619
(% of AGI for various income ranges: 0.7% for AGIs below $10k, 0.3% for AGIs $10k-25k, 0.2% for AGIs $25k-50k, 0.0% for AGIs $50k-75k, -0.1% for AGIs $75k-100k, 1.7% for AGIs over 100k)
Profit/loss from business: +$2,915 (reported on 11.7% of returns)
Here:
+$2,915
State:
+$10,071
(% of AGI for various income ranges: 10.6% for AGIs below $10k, 2.0% for AGIs $10k-25k, 1.3% for AGIs $25k-50k, 0.8% for AGIs $50k-75k, -0.4% for AGIs over 100k)
Total itemized deductions: $13,463 (19% of AGI, reported on 25.4% of returns)
Here:
$13,463
State:
$17,065
Here:
19.0% of AGI
State:
19.5% of AGI
(% of AGI for various income ranges: 6.7% for AGIs $10k-25k, 6.8% for AGIs $25k-50k, 8.6% for AGIs $50k-75k, 10.9% for AGIs $75k-100k, 10.9% for AGIs over 100k)
Charity contributions deductions: $2,853 (4% of AGI, reported on 19.9% of returns)
Here:
$2,853
State:
$3,550
Here:
3.9% of AGI
State:
3.8% of AGI
(% of AGI for various income ranges: 0.6% for AGIs $10k-25k, 0.9% for AGIs $25k-50k, 1.3% for AGIs $50k-75k, 2.2% for AGIs $75k-100k, 2.1% for AGIs over 100k)
Total tax: $4,704 (reported on 77.2% of returns)
46044:
$4,704
State:
$6,914
(% of AGI for various income ranges: 2.2% for AGIs below $10k, 3.4% for AGIs $10k-25k, 6.6% for AGIs $25k-50k, 8.8% for AGIs $50k-75k, 10.3% for AGIs $75k-100k, 15.9% for AGIs over 100k)
Earned income credit: $1,541 (reported on 13.2% of returns)
Here:
$1,541
State:
$1,685
Percentage of individuals using paid preparers for their 2004 taxes: 62.0%
Here:
62%
State:
59%
(% for various income ranges: 52.5% for AGIs below $10k, 65.5% for AGIs $10k-25k, 63.3% for AGIs $25k-50k, 65.5% for AGIs $50k-75k, 62.4% for AGIs $75k-100k, 63.9% for AGIs over 100k)
Household received Food Stamps/SNAP in the past 12 months: 73 Household did not receive Food Stamps/SNAP in the past 12 months: 1,043
Women who had a birth in the past 12 months: 7 (0 now married, 6 unmarried) Women who did not have a birth in the past 12 months: 640 (351 now married, 289 unmarried)
Housing units in zip code 46044 with a mortgage: 534 (59 second mortgage, 2 home equity loan, 53 both second mortgage and home equity loan) Houses without a mortgage: 37
Median monthly owner costs for units with a mortgage: $1,006 Median monthly owner costs for units without a mortgage: $457
Residents with income below the poverty level in 2022:
This zip code:
8.0%
Whole state:
12.6%
Residents with income below 50% of the poverty level in 2022:
This zip code:
3.0%
Whole state:
6.3%
Median number of rooms in houses and condos:
Here:
6.3
State:
6.6
Median number of rooms in apartments:
Here:
5.0
State:
4.3
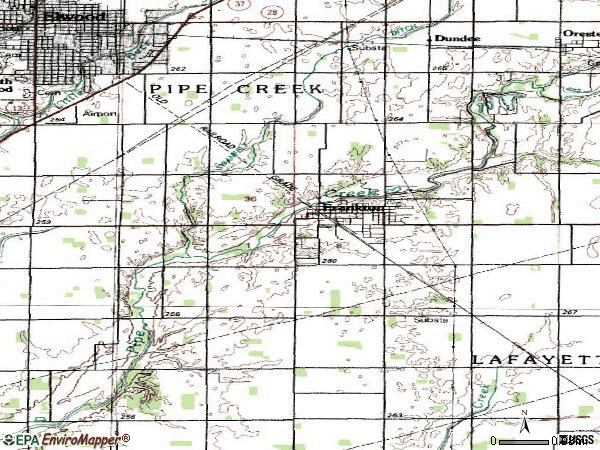
Notable locations in this zip code not listed on our city pages
Cemeteries: Neese Cemetery (1), Prewett Cemetery (2), Howard Cemetery (3), Independent Order of Odd Fellows Cemetery (4), Sigler Cemetery (5). Display/hide their locations on the map
Size of family households: 418 2-persons, 153 3-persons, 141 4-persons, 82 5-persons, 9 6-persons, 1 7-or-more-persons
Size of nonfamily households: 288 1-person, 21 2-persons, 3 7-or-more-persons
370 married couples with children.
132 single-parent households (61 men, 71 women).
96.6% of residents of 46044 zip code speak English at home.
1.4% of residents speak Spanish at home (72% very well, 28% well).
0.5% of residents speak other Indo-European language at home (79% very well, 21% well).
0.9% of residents speak Asian or Pacific Island language at home (32% very well, 68% well).
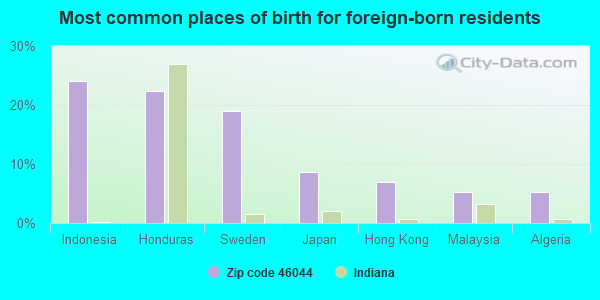
Foreign born population: 59 (2.2%) (83.7% of them are naturalized citizens)
This zip code:
2.2%
Whole state:
6.1%
24%Indonesia
22%Honduras
19%Sweden
9%Japan
7%Hong Kong
5%Malaysia
5%Algeria
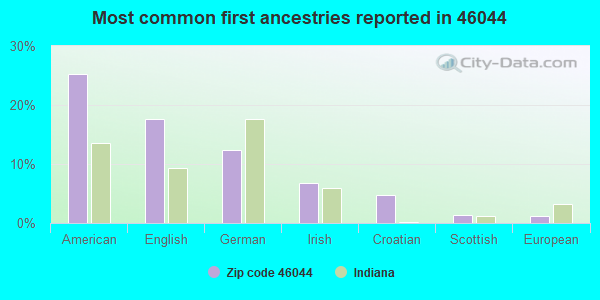
25%American
18%English
12%German
7%Irish
5%Croatian
1%Scottish
1%European
Year of entry for the foreign-born population
52010 or later
112000 to 2009
261990 to 1999
36Before 1990
Facilities with environmental interests located in this zip code:
CERDEN & SON INC (105 N PARK ST in FRANKTON, IN)
STATE MASTER (Indiana facility tracking) - LUST-199504543, LEAKING STORAGE TANK, UST-9748, UNDERGROUND STORAGE TANK PROGRAM, CRTK-2027, EPCRA Conditionally Exempt Small Quantity Generators, less than 100 kg/month of hazardous waste (Resource Conservation and Recovery Act (tracking hazardous waste)) - notification Organizations: CIRDEN JACK (CONTACT/OWNER)
Alternative names: CIRDEN & SON INC
MIAMI CAMPGROUND (8851 W 400 N in FRANKTON, IN)
(Integrated Compliance Information System) - ICIS-05-1997-0571, FORMAL ENFORCEMENT ACTION, ICIS-05-1997-0693, STATE MASTER (Indiana facility tracking)
SHUTER SUNSET FARMS INC. (7400 NORTH 400 WEST in FRANKTON, IN)
ENFORCEMENT/COMPLIANCE ACTIVITY (Integrated Compliance Information System)
Housing units lacking complete plumbing facilities: 0.6% Housing units lacking complete kitchen facilities: 0.7%
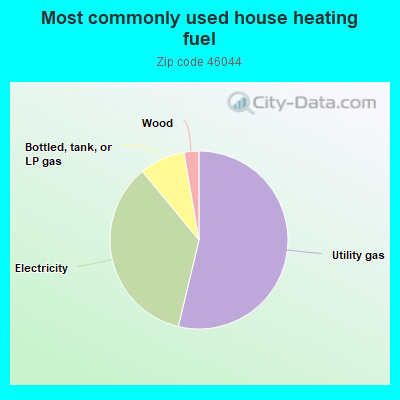
53.9%Utility gas
35.4%Electricity
8.3%Bottled, tank, or LP gas
2.7%Wood
Population in 1990: 3,723.
Place of birth for U.S.-born residents:
This state: 2,188
Northeast: 8
Midwest: 135
South: 217
West: 54
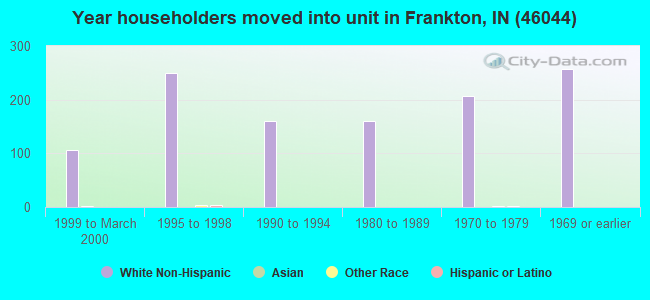
69% of the 46044 zip code residents lived in the same house 5 years ago. Out of people who lived in different houses, 80% lived in this county. Out of people who lived in different counties, 50% lived in Indiana.
94% of the 46044 zip code residents lived in the same house 1 year ago. Out of people who lived in different houses, 74% moved from this county. Out of people who lived in different houses, 26% moved from different state. Out of people who lived in different houses, 3% moved from abroad.
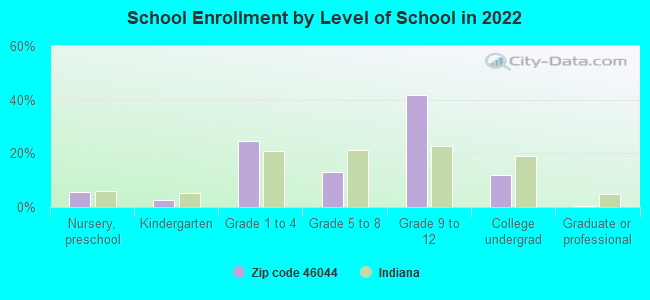
Private vs. public school enrollment:
Students in private schools in grades 1 to 8 (elementary and middle school): 8
Here:
3.9%
Indiana:
14.9%
Students in private schools in grades 9 to 12 (high school): 47
Here:
19.6%
Indiana:
11.4%
Students in private undergraduate colleges: 7
Here:
11.0%
Indiana:
22.3%
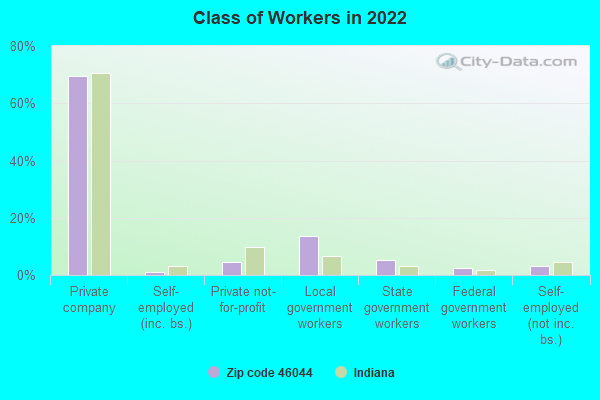
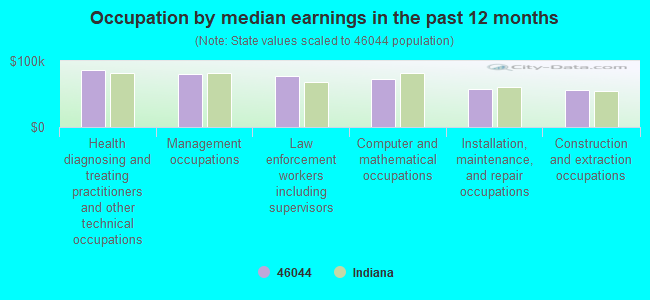
Occupation by median earnings in the past 12 months ($)
86,753Health diagnosing and treating practitioners and other technical occupations
79,994Management occupations
76,777Law enforcement workers including supervisors
72,607Computer and mathematical occupations
57,861Installation, maintenance, and repair occupations
56,000Construction and extraction occupations
Top industries in this zip code by the number of employees in 2005:
Other Services (except Public Administration): Religious Organizations (10-19 employees: 1 establishment, 5-9 employees: 2 establishments)
Construction: New Single-Family Housing Construction (except Operative Builders) (5-9: 1, 1-4: 1)
Accommodation and Food Services: Snack and Nonalcoholic Beverage Bars (5-9: 1)
Other Services (except Public Administration): Commercial and Industrial Machinery and Equipment (except Automotive and Electronic) Repair and Maintenance (5-9: 1)
Construction: Masonry Contractors (5-9: 1)
Health Care and Social Assistance: Offices of Dentists (5-9: 1)
Construction: Roofing Contractors (5-9: 1)
Fatal accident statistics in 2014:
Fatal accident count: 1
Vehicles involved in fatal accidents: 2
Fatal accidents caused by drunken drivers: 0
Fatalities: 1
Persons involved in fatal accidents: 2
Pedestrians involved in fatal accidents: 0
Home Mortgage Disclosure Act Aggregated Statistics For Year 2009 (Based on 1 full and 6 partial tracts)
A) FHA, FSA/RHS & VA Home Purchase Loans
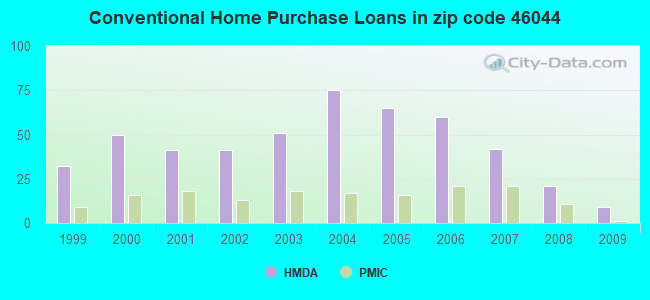
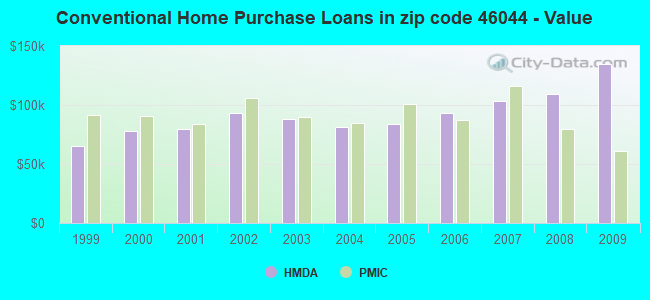
B) Conventional Home Purchase Loans
C) Refinancings
D) Home Improvement Loans
F) Non-occupant Loans on < 5 Family Dwellings (A B C & D)
G) Loans On Manufactured Home Dwelling (A B C & D)
Number
Average Value
Number
Average Value
Number
Average Value
Number
Average Value
Number
Average Value
Number
Average Value
LOANS ORIGINATED
21
$83,005
9
$134,582
86
$116,848
10
$35,408
3
$80,663
3
$83,160
APPLICATIONS APPROVED, NOT ACCEPTED
0
$0
0
$0
12
$104,297
1
$31,740
0
$0
0
$0
APPLICATIONS DENIED
9
$87,108
2
$111,115
52
$101,932
3
$30,103
0
$0
2
$117,875
APPLICATIONS WITHDRAWN
2
$95,320
1
$207,620
29
$105,194
1
$119,790
1
$30,520
0
$0
FILES CLOSED FOR INCOMPLETENESS
1
$87,000
0
$0
4
$70,095
1
$110,360
0
$0
0
$0
Aggregated Statistics For Year 2008 (Based on 1 full and 6 partial tracts)
A) FHA, FSA/RHS & VA Home Purchase Loans
B) Conventional Home Purchase Loans
C) Refinancings
D) Home Improvement Loans
F) Non-occupant Loans on < 5 Family Dwellings (A B C & D)
G) Loans On Manufactured Home Dwelling (A B C & D)
Number
Average Value
Number
Average Value
Number
Average Value
Number
Average Value
Number
Average Value
Number
Average Value
LOANS ORIGINATED
25
$94,408
21
$109,340
54
$107,525
10
$43,167
4
$57,235
7
$78,426
APPLICATIONS APPROVED, NOT ACCEPTED
2
$110,000
3
$94,130
11
$125,519
3
$27,667
0
$0
2
$133,890
APPLICATIONS DENIED
7
$85,630
6
$51,940
56
$102,426
12
$26,992
4
$40,655
6
$53,117
APPLICATIONS WITHDRAWN
0
$0
1
$73,590
25
$133,310
1
$55,770
0
$0
0
$0
FILES CLOSED FOR INCOMPLETENESS
1
$100,000
1
$146,750
6
$104,478
0
$0
1
$45,000
0
$0
Aggregated Statistics For Year 2007 (Based on 1 full and 6 partial tracts)
A) FHA, FSA/RHS & VA Home Purchase Loans
B) Conventional Home Purchase Loans
C) Refinancings
D) Home Improvement Loans
E) Loans on Dwellings For 5+ Families
F) Non-occupant Loans on < 5 Family Dwellings (A B C & D)
G) Loans On Manufactured Home Dwelling (A B C & D)
Number
Average Value
Number
Average Value
Number
Average Value
Number
Average Value
Number
Average Value
Number
Average Value
Number
Average Value
LOANS ORIGINATED
9
$84,629
42
$103,098
80
$99,224
19
$41,135
1
$308,180
14
$74,523
7
$86,591
APPLICATIONS APPROVED, NOT ACCEPTED
2
$104,525
6
$77,038
19
$92,212
6
$32,780
0
$0
2
$46,035
2
$83,050
APPLICATIONS DENIED
1
$70,450
7
$87,591
72
$103,718
21
$32,125
0
$0
6
$81,343
5
$74,354
APPLICATIONS WITHDRAWN
1
$92,940
5
$194,872
24
$100,262
4
$59,190
0
$0
2
$79,165
0
$0
FILES CLOSED FOR INCOMPLETENESS
0
$0
0
$0
8
$105,296
1
$49,900
0
$0
2
$102,725
0
$0
Aggregated Statistics For Year 2006 (Based on 1 full and 6 partial tracts)
A) FHA, FSA/RHS & VA Home Purchase Loans
B) Conventional Home Purchase Loans
C) Refinancings
D) Home Improvement Loans
F) Non-occupant Loans on < 5 Family Dwellings (A B C & D)
G) Loans On Manufactured Home Dwelling (A B C & D)
Number
Average Value
Number
Average Value
Number
Average Value
Number
Average Value
Number
Average Value
Number
Average Value
LOANS ORIGINATED
11
$87,655
60
$93,458
96
$95,922
23
$28,663
10
$61,875
4
$59,252
APPLICATIONS APPROVED, NOT ACCEPTED
2
$93,500
4
$120,318
16
$92,263
4
$51,212
1
$79,830
3
$93,333
APPLICATIONS DENIED
1
$213,920
13
$84,675
89
$98,496
15
$39,098
4
$62,002
4
$88,392
APPLICATIONS WITHDRAWN
1
$21,130
8
$104,662
50
$96,045
3
$51,760
2
$95,285
2
$56,505
FILES CLOSED FOR INCOMPLETENESS
0
$0
5
$89,284
12
$139,662
0
$0
2
$72,000
0
$0
Aggregated Statistics For Year 2005 (Based on 1 full and 6 partial tracts)
A) FHA, FSA/RHS & VA Home Purchase Loans
B) Conventional Home Purchase Loans
C) Refinancings
D) Home Improvement Loans
F) Non-occupant Loans on < 5 Family Dwellings (A B C & D)
G) Loans On Manufactured Home Dwelling (A B C & D)
Number
Average Value
Number
Average Value
Number
Average Value
Number
Average Value
Number
Average Value
Number
Average Value
LOANS ORIGINATED
9
$86,063
65
$83,750
125
$90,116
22
$34,668
11
$54,085
8
$82,918
APPLICATIONS APPROVED, NOT ACCEPTED
1
$79,800
4
$70,378
20
$87,560
4
$33,525
3
$44,603
1
$94,940
APPLICATIONS DENIED
2
$79,670
17
$80,286
98
$93,252
12
$41,894
3
$55,213
8
$69,882
APPLICATIONS WITHDRAWN
1
$44,610
9
$87,260
51
$102,530
6
$123,475
3
$68,793
2
$55,690
FILES CLOSED FOR INCOMPLETENESS
1
$94,510
4
$112,525
29
$108,727
1
$46,260
1
$65,160
1
$67,940
Aggregated Statistics For Year 2004 (Based on 1 full and 6 partial tracts)
A) FHA, FSA/RHS & VA Home Purchase Loans
B) Conventional Home Purchase Loans
C) Refinancings
D) Home Improvement Loans
F) Non-occupant Loans on < 5 Family Dwellings (A B C & D)
G) Loans On Manufactured Home Dwelling (A B C & D)
Number
Average Value
Number
Average Value
Number
Average Value
Number
Average Value
Number
Average Value
Number
Average Value
LOANS ORIGINATED
18
$102,532
75
$81,348
141
$95,474
16
$26,356
7
$59,874
9
$66,273
APPLICATIONS APPROVED, NOT ACCEPTED
0
$0
2
$84,520
36
$91,656
1
$77,250
0
$0
6
$73,343
APPLICATIONS DENIED
4
$94,015
17
$56,102
85
$89,932
14
$37,483
2
$58,925
18
$58,069
APPLICATIONS WITHDRAWN
4
$135,170
3
$69,310
51
$84,171
2
$106,350
1
$199,820
1
$95,080
FILES CLOSED FOR INCOMPLETENESS
0
$0
3
$55,013
21
$107,580
2
$27,555
1
$73,380
0
$0
Aggregated Statistics For Year 2003 (Based on 1 full and 6 partial tracts)
A) FHA, FSA/RHS & VA Home Purchase Loans
B) Conventional Home Purchase Loans
C) Refinancings
D) Home Improvement Loans
F) Non-occupant Loans on < 5 Family Dwellings (A B C & D)
Number
Average Value
Number
Average Value
Number
Average Value
Number
Average Value
Number
Average Value
LOANS ORIGINATED
19
$100,605
51
$88,552
304
$93,172
19
$34,009
19
$59,758
APPLICATIONS APPROVED, NOT ACCEPTED
1
$83,270
7
$64,484
38
$88,575
4
$34,805
2
$64,880
APPLICATIONS DENIED
3
$113,507
5
$66,436
78
$88,553
10
$19,062
2
$79,960
APPLICATIONS WITHDRAWN
1
$92,160
11
$79,789
49
$90,806
1
$66,270
6
$61,060
FILES CLOSED FOR INCOMPLETENESS
0
$0
1
$96,740
13
$96,579
1
$20,590
0
$0
Aggregated Statistics For Year 2002 (Based on 1 full and 6 partial tracts)
A) FHA, FSA/RHS & VA Home Purchase Loans
B) Conventional Home Purchase Loans
C) Refinancings
D) Home Improvement Loans
F) Non-occupant Loans on < 5 Family Dwellings (A B C & D)
Number
Average Value
Number
Average Value
Number
Average Value
Number
Average Value
Number
Average Value
LOANS ORIGINATED
24
$91,586
41
$93,640
213
$90,858
17
$33,226
10
$72,987
APPLICATIONS APPROVED, NOT ACCEPTED
2
$65,575
7
$57,390
32
$94,788
3
$32,533
0
$0
APPLICATIONS DENIED
4
$90,578
14
$61,922
71
$87,016
9
$15,717
3
$41,333
APPLICATIONS WITHDRAWN
2
$77,350
2
$61,535
51
$91,689
1
$84,130
0
$0
FILES CLOSED FOR INCOMPLETENESS
0
$0
4
$82,162
21
$76,999
2
$32,345
1
$72,000
Aggregated Statistics For Year 2001 (Based on 1 full and 6 partial tracts)
A) FHA, FSA/RHS & VA Home Purchase Loans
B) Conventional Home Purchase Loans
C) Refinancings
D) Home Improvement Loans
F) Non-occupant Loans on < 5 Family Dwellings (A B C & D)
Number
Average Value
Number
Average Value
Number
Average Value
Number
Average Value
Number
Average Value
LOANS ORIGINATED
21
$85,416
41
$79,317
211
$81,928
28
$24,448
7
$52,137
APPLICATIONS APPROVED, NOT ACCEPTED
2
$82,995
7
$67,270
42
$69,461
11
$34,829
4
$49,405
APPLICATIONS DENIED
2
$94,710
19
$42,248
103
$73,143
15
$20,695
3
$27,700
APPLICATIONS WITHDRAWN
1
$56,350
2
$123,390
39
$77,232
3
$28,277
1
$69,670
FILES CLOSED FOR INCOMPLETENESS
1
$52,700
1
$71,350
13
$80,428
4
$70,500
0
$0
Aggregated Statistics For Year 2000 (Based on 1 full and 6 partial tracts)
A) FHA, FSA/RHS & VA Home Purchase Loans
B) Conventional Home Purchase Loans
C) Refinancings
D) Home Improvement Loans
F) Non-occupant Loans on < 5 Family Dwellings (A B C & D)
Number
Average Value
Number
Average Value
Number
Average Value
Number
Average Value
Number
Average Value
LOANS ORIGINATED
19
$87,214
50
$78,217
85
$72,265
30
$14,518
5
$54,010
APPLICATIONS APPROVED, NOT ACCEPTED
3
$74,280
9
$50,531
31
$61,371
7
$19,550
0
$0
APPLICATIONS DENIED
1
$66,460
21
$46,980
57
$65,345
18
$22,182
3
$63,757
APPLICATIONS WITHDRAWN
0
$0
8
$77,050
22
$71,006
4
$23,662
2
$29,555
FILES CLOSED FOR INCOMPLETENESS
0
$0
2
$113,700
6
$57,703
1
$9,000
0
$0
Aggregated Statistics For Year 1999 (Based on 1 full and 3 partial tracts)
A) FHA, FSA/RHS & VA Home Purchase Loans
B) Conventional Home Purchase Loans
C) Refinancings
D) Home Improvement Loans
F) Non-occupant Loans on < 5 Family Dwellings (A B C & D)
2002 - 2014 National Fire Incident Reporting System (NFIRS) incidents
Based on the data from the years 2002 - 2014 the average number of fire incidents per year is 21. The highest number of fire incidents - 40 took place in 2011, and the least - 1 in 2014. The data has a declining trend.
When looking into fire subcategories, the most incidents belonged to: Outside Fires (49.6%), and Structure Fires (39.6%).
Fire incident types reported to NFIRS in Zip Code 46044


 Nearest zip codes: 46011, 46063, 46036, 46001, 46016, 46051.


 Based on the data from the years 2002 - 2014 the average number of fire incidents per year is 21. The highest number of fire incidents - 40 took place in 2011, and the least - 1 in 2014. The data has a declining trend.
 When looking into fire subcategories, the most incidents belonged to: Outside Fires (49.6%), and Structure Fires (39.6%).