Estimated zip code population in 2022: 5,952 Zip code population in 2010: 6,025 Zip code population in 2000: 6,392
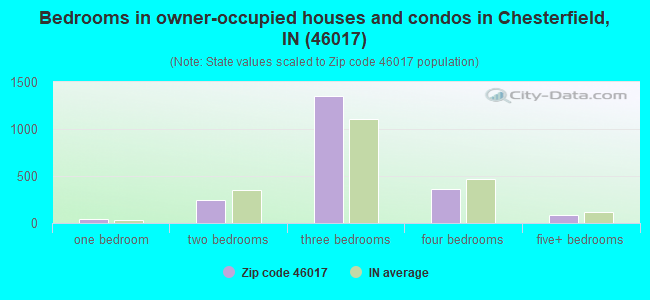
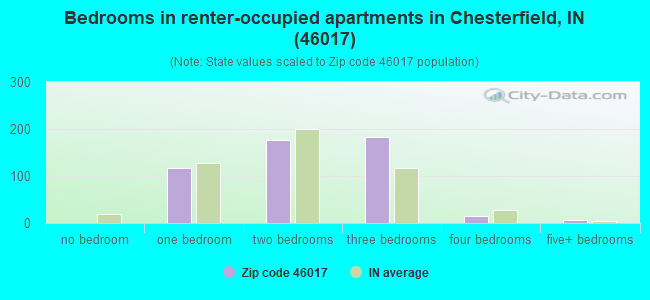
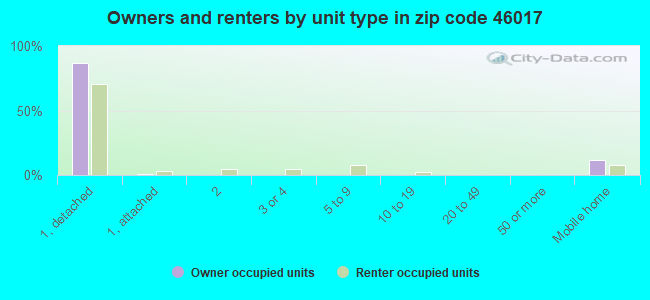
Houses and condos: 2,686 Renter-occupied apartments: 499
% of renters here:
19%
State:
29%
March 2022 cost of living index in zip code 46017: 84.2 (less than average, U.S. average is 100)
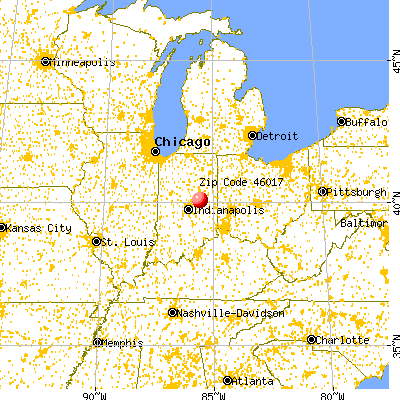
Land area: 17.3 sq. mi. Water area: 0.0 sq. mi.
Population density: 344 people per square mile
(very low).
OSM Map
General Map
Google Map
MSN Map
OSM Map
General Map
Google Map
MSN Map
OSM Map
General Map
Google Map
MSN Map
OSM Map
General Map
Google Map
MSN Map
Please wait while loading the map...
Real estate property taxes paid for housing units in 2022:
This zip code:
0.6% ($915)
Indiana:
0.7% ($1,467)
Median real estate property taxes paid for housing units with mortgages in 2022: $975 (0.6%) Median real estate property taxes paid for housing units with no mortgage in 2022: $750 (0.7%)
Business Search- 14 Million verified businesses
Males: 2,966
(49.8%)
Females: 2,985
(50.2%)
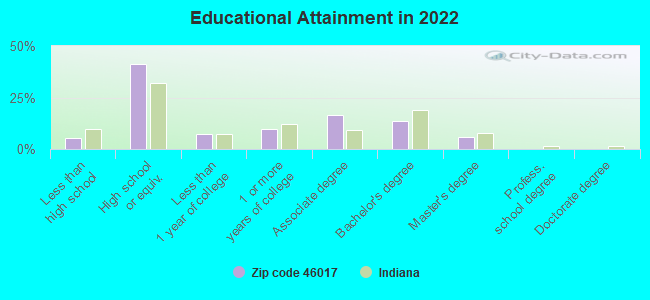
For population 25 years and over in 46017:
High school or higher: 94.3%
Bachelor's degree or higher: 19.8%
Graduate or professional degree: 6.0%
Unemployed: 3.5%
Mean travel time to work (commute): 21.5 minutes
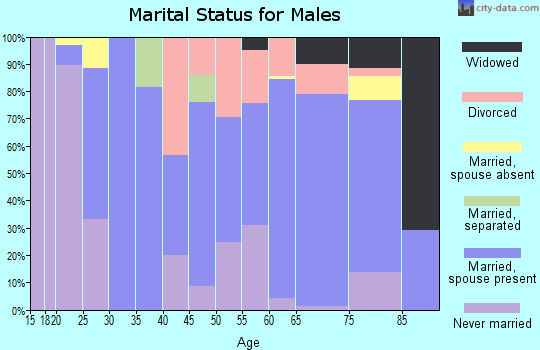
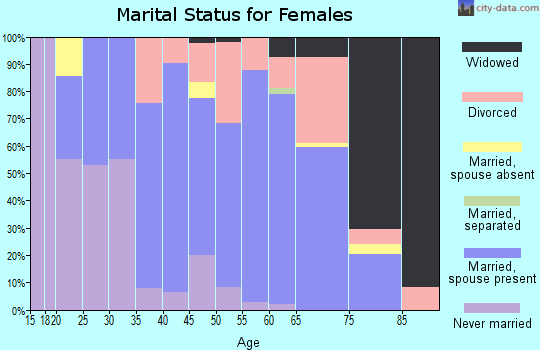
For population 15 years and over in 46017:
Never married: 24.0%
Now married: 50.9%
Separated: 0.1%
Widowed: 6.1%
Divorced: 18.8%
Zip code 46017 compared to state average:
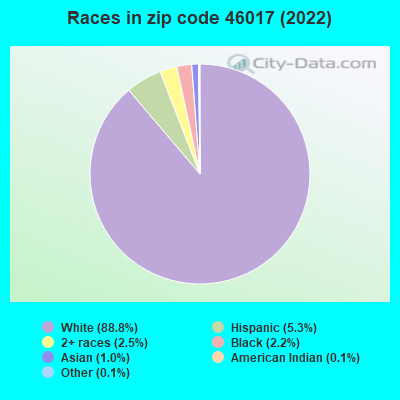
Black race population percentage significantly below state average.
Median age above state average.
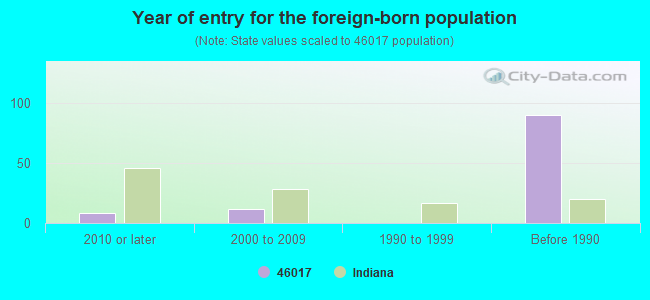
Foreign-born population percentage significantly below state average.
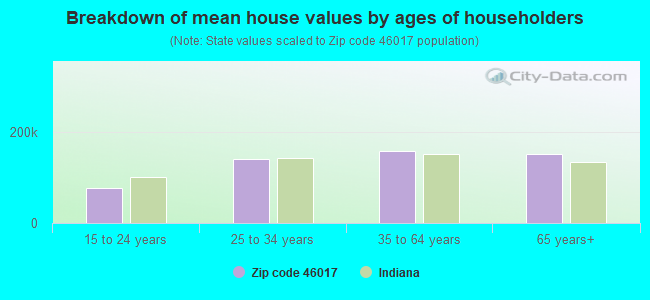
Estimated median house/condo value in 2022: $152,660
46017:
$152,660
Indiana:
$208,700
According to our research of Indiana and other state lists, there were 5 registered sex offenders living in 46017 zip code as of April 27, 2024. The ratio of all residents to sex offenders in zip code 46017 is 1,177 to 1. The ratio of registered sex offenders to all residents in this zip code is lower than the state average.
Median resident age:
This zip code:
45.6 years
Indiana median age:
38.2 years
Average household size:
This zip code:
2.3 people
Indiana:
2.4 people
Averages for the 2020 tax year for zip code 46017, filed in 2021:
Average Adjusted Gross Income (AGI) in 2020: $48,127 (Individual Income Tax Returns)
Here:
$48,127
State:
$64,978
Salary/wage: $44,161 (reported on 78.8% of returns)
Here:
$44,161
State:
$55,245
(% of AGI for various income ranges: 1033.3% for AGIs below $25k, 3308.2% for AGIs $25k-50k, 5807.3% for AGIs $50k-75k, 9182.9% for AGIs $75k-100k, 14677.8% for AGIs $100k-200k)
Taxable interest for individuals: $1,110 (reported on 20.3% of returns)
This zip code:
$1,110
Indiana:
$1,351
(% of AGI for various income ranges: 11.6% for AGIs below $25k, 11.4% for AGIs $25k-50k, 17.8% for AGIs $50k-75k, 65.7% for AGIs $75k-100k, 87.8% for AGIs $100k-200k)
Ordinary dividends: $2,364 (reported on 10.8% of returns)
Here:
$2,364
State:
$5,827
(% of AGI for various income ranges: 11.6% for AGIs below $25k, 13.4% for AGIs $25k-50k, 27.0% for AGIs $50k-75k, 50.5% for AGIs $75k-100k, 210.6% for AGIs $100k-200k)
Net capital gain/loss in AGI: +$3,863 (reported on 8.8% of returns)
Here:
+$3,863
State:
+$17,730
(% of AGI for various income ranges: 2.7% for AGIs below $25k, 19.5% for AGIs $25k-50k, 31.9% for AGIs $50k-75k, 81.9% for AGIs $75k-100k, 326.1% for AGIs $100k-200k)
Profit/loss from business: +$8,579 (reported on 11.1% of returns)
Here:
+$8,579
State:
+$12,144
(% of AGI for various income ranges: 60.6% for AGIs below $25k, 83.4% for AGIs $25k-50k, 18.4% for AGIs $50k-75k, 253.3% for AGIs $75k-100k, 665.0% for AGIs $100k-200k)
Taxable individual retirement arrangement distribution: $13,296 (reported on 8.2% of returns)
46017:
$13,296
Indiana:
$18,302
(% of AGI for various income ranges: 41.0% for AGIs below $25k, 68.8% for AGIs $25k-50k, 192.4% for AGIs $50k-75k, 334.8% for AGIs $75k-100k, 588.9% for AGIs $100k-200k)
Total itemized deductions: $27,762 (reported on 2.6% of returns)
Here:
$27,762
State:
$35,601
(% of AGI for various income ranges: 337.3% for AGIs $50k-75k, 540.6% for AGIs $100k-200k)
Charity contributions: $9,700 (reported on 2.0% of returns)
Here:
$9,700
State:
$15,596
(% of AGI for various income ranges: 27.0% for AGIs $25k-50k, 212.2% for AGIs $100k-200k)
Taxes paid: $5,562 (reported on 2.6% of returns)
46017:
$5,562
State:
$7,542
(% of AGI for various income ranges: 53.0% for AGIs $50k-75k, 138.3% for AGIs $100k-200k)
Earned income credit: $2,102 (reported on 18.0% of returns)
Here:
$2,102
State:
$2,298
(% of AGI for various income ranges: 84.5% for AGIs below $25k, 61.5% for AGIs $25k-50k)
Percentage of individuals using paid preparers for their 2020 taxes: 94.1%
Here:
94%
State:
94%
(% for various income ranges: 91.9% for AGIs below $25k, 95.5% for AGIs $25k-50k, 95.7% for AGIs $50k-75k, 93.1% for AGIs $75k-100k, 96.3% for AGIs $100k-200k, 100.0% for AGIs over 200k)
Averages for the 2012 tax year for zip code 46017, filed in 2013:
Average Adjusted Gross Income (AGI) in 2012: $40,551 (Individual Income Tax Returns)
Here:
$40,551
State:
$52,932
Salary/wage: $32,930 (reported on 85.9% of returns)
Here:
$32,930
State:
$45,173
(% of AGI for various income ranges: 61.2% for AGIs below $25k, 74.1% for AGIs $25k-50k, 74.1% for AGIs $50k-75k, 75.2% for AGIs $75k-100k, 61.5% for AGIs $100k-200k)
Taxable interest for individuals: $836 (reported on 25.6% of returns)
This zip code:
$836
Indiana:
$1,311
(% of AGI for various income ranges: 1.0% for AGIs below $25k, 0.5% for AGIs $25k-50k, 0.4% for AGIs $50k-75k, 0.3% for AGIs $75k-100k, 0.6% for AGIs $100k-200k)
Ordinary dividends: $1,985 (reported on 13.1% of returns)
Here:
$1,985
State:
$4,690
(% of AGI for various income ranges: 1.0% for AGIs below $25k, 0.4% for AGIs $25k-50k, 0.6% for AGIs $50k-75k, 0.6% for AGIs $75k-100k, 0.7% for AGIs $100k-200k)
Net capital gain/loss in AGI: +$970 (reported on 10.1% of returns)
Here:
+$970
State:
+$10,406
(% of AGI for various income ranges: 0.3% for AGIs $50k-75k, 0.4% for AGIs $75k-100k, 0.7% for AGIs $100k-200k)
Profit/loss from business: +$9,526 (reported on 11.4% of returns)
Here:
+$9,526
State:
+$11,105
(% of AGI for various income ranges: 5.2% for AGIs below $25k, 1.5% for AGIs $25k-50k, 2.2% for AGIs $50k-75k, 1.0% for AGIs $75k-100k, 4.3% for AGIs $100k-200k)
Taxable individual retirement arrangement distribution: $11,614 (reported on 9.4% of returns)
46017:
$11,614
Indiana:
$13,841
(% of AGI for various income ranges: 2.6% for AGIs below $25k, 2.0% for AGIs $25k-50k, 2.1% for AGIs $50k-75k, 2.5% for AGIs $75k-100k, 4.2% for AGIs $100k-200k)
Total itemized deductions: $18,141 (23% of AGI, reported on 18.9% of returns)
Here:
$18,141
State:
$20,913
Here:
23.2% of AGI
State:
18.2% of AGI
(% of AGI for various income ranges: 5.7% for AGIs below $25k, 7.0% for AGIs $25k-50k, 7.1% for AGIs $50k-75k, 9.6% for AGIs $75k-100k, 11.7% for AGIs $100k-200k)
Charity contributions: $3,250 (reported on 13.5% of returns)
Here:
$3,250
State:
$4,697
(% of AGI for various income ranges: 0.5% for AGIs below $25k, 0.6% for AGIs $25k-50k, 0.9% for AGIs $50k-75k, 1.6% for AGIs $75k-100k, 1.6% for AGIs $100k-200k)
Taxes paid: $5,395 (reported on 18.9% of returns)
46017:
$5,395
State:
$7,456
(% of AGI for various income ranges: 0.9% for AGIs below $25k, 1.5% for AGIs $25k-50k, 1.9% for AGIs $50k-75k, 3.2% for AGIs $75k-100k, 4.4% for AGIs $100k-200k)
Earned income credit: $2,289 (reported on 18.2% of returns)
Here:
$2,289
State:
$2,265
(% of AGI for various income ranges: 6.0% for AGIs below $25k, 0.9% for AGIs $25k-50k)
Percentage of individuals using paid preparers for their 2012 taxes: 46.8%
Here:
47%
State:
53%
(% for various income ranges: 44.3% for AGIs below $25k, 49.4% for AGIs $25k-50k, 44.2% for AGIs $50k-75k, 48.1% for AGIs $75k-100k, 57.9% for AGIs $100k-200k)
Averages for the 2004 tax year for zip code 46017, filed in 2005:
Average Adjusted Gross Income (AGI) in 2004: $39,081 (Individual Income Tax Returns)
Here:
$39,081
State:
$44,790
Salary/wage: $33,249 (reported on 89.6% of returns)
Here:
$33,249
State:
$39,615
(% of AGI for various income ranges: 125.4% for AGIs below $10k, 61.8% for AGIs $10k-25k, 74.7% for AGIs $25k-50k, 78.9% for AGIs $50k-75k, 83.4% for AGIs $75k-100k, 73.9% for AGIs over 100k)
Taxable interest for individuals: $1,020 (reported on 42.0% of returns)
This zip code:
$1,020
Indiana:
$1,535
(% of AGI for various income ranges: 5.6% for AGIs below $10k, 2.0% for AGIs $10k-25k, 1.1% for AGIs $25k-50k, 1.1% for AGIs $50k-75k, 0.6% for AGIs $75k-100k, 0.7% for AGIs over 100k)
Taxable dividends: $948 (reported on 19.6% of returns)
Here:
$948
State:
$2,998
(% of AGI for various income ranges: 1.3% for AGIs below $10k, 0.8% for AGIs $10k-25k, 0.5% for AGIs $25k-50k, 0.3% for AGIs $50k-75k, 0.3% for AGIs $75k-100k, 0.5% for AGIs over 100k)
Net capital gain/loss: +$2,888 (reported on 12.1% of returns)
Here:
+$2,888
State:
+$8,619
(% of AGI for various income ranges: -2.7% for AGIs below $10k, -0.1% for AGIs $10k-25k, 0.2% for AGIs $25k-50k, 0.3% for AGIs $50k-75k, 0.7% for AGIs $75k-100k, 3.3% for AGIs over 100k)
Profit/loss from business: +$6,032 (reported on 11.5% of returns)
Here:
+$6,032
State:
+$10,071
(% of AGI for various income ranges: 5.0% for AGIs below $10k, 3.4% for AGIs $10k-25k, 1.5% for AGIs $25k-50k, 1.5% for AGIs $50k-75k, 1.0% for AGIs $75k-100k, 2.0% for AGIs over 100k)
IRA payment deduction: $2,886 (reported on 1.2% of returns)
46017:
$2,886
Indiana:
$2,840
Total itemized deductions: $14,145 (20% of AGI, reported on 26.3% of returns)
Here:
$14,145
State:
$17,065
Here:
20.3% of AGI
State:
19.5% of AGI
(% of AGI for various income ranges: 7.4% for AGIs below $10k, 5.8% for AGIs $10k-25k, 8.2% for AGIs $25k-50k, 9.5% for AGIs $50k-75k, 12.0% for AGIs $75k-100k, 11.3% for AGIs over 100k)
Charity contributions deductions: $3,005 (4% of AGI, reported on 20.7% of returns)
Here:
$3,005
State:
$3,550
Here:
4.1% of AGI
State:
3.8% of AGI
(% of AGI for various income ranges: 0.9% for AGIs $10k-25k, 1.0% for AGIs $25k-50k, 1.3% for AGIs $50k-75k, 2.3% for AGIs $75k-100k, 2.6% for AGIs over 100k)
Total tax: $4,877 (reported on 77.5% of returns)
46017:
$4,877
State:
$6,914
(% of AGI for various income ranges: 2.4% for AGIs below $10k, 3.7% for AGIs $10k-25k, 6.8% for AGIs $25k-50k, 9.2% for AGIs $50k-75k, 10.7% for AGIs $75k-100k, 16.5% for AGIs over 100k)
Earned income credit: $1,504 (reported on 13.8% of returns)
Here:
$1,504
State:
$1,685
Percentage of individuals using paid preparers for their 2004 taxes: 55.8%
Here:
56%
State:
59%
(% for various income ranges: 44.0% for AGIs below $10k, 58.7% for AGIs $10k-25k, 57.3% for AGIs $25k-50k, 59.4% for AGIs $50k-75k, 57.9% for AGIs $75k-100k, 60.3% for AGIs over 100k)
Likely homosexual households (counted as self-reported same-sex unmarried-partner households)
Lesbian couples: 0.0% of all households
Gay men: 0.1% of all households
Household received Food Stamps/SNAP in the past 12 months: 228 Household did not receive Food Stamps/SNAP in the past 12 months: 2,343
Women who had a birth in the past 12 months: 96 (20 now married, 65 unmarried) Women who did not have a birth in the past 12 months: 1,098 (533 now married, 566 unmarried)
Housing units in zip code 46017 with a mortgage: 1,258 (114 second mortgage, 108 both second mortgage and home equity loan) Houses without a mortgage: 92
Median monthly owner costs for units with a mortgage: $1,127 Median monthly owner costs for units without a mortgage: $432
Residents with income below the poverty level in 2022:
This zip code:
14.3%
Whole state:
12.6%
Residents with income below 50% of the poverty level in 2022:
This zip code:
8.2%
Whole state:
6.3%
Median number of rooms in houses and condos:
Here:
6.2
State:
6.6
Median number of rooms in apartments:
Here:
4.9
State:
4.3
Notable locations in this zip code not listed on our city pages
353 married couples with children.
473 single-parent households (72 men, 401 women).
96.5% of residents of 46017 zip code speak English at home.
1.9% of residents speak Spanish at home (100% very well).
0.9% of residents speak Asian or Pacific Island language at home (24% very well, 71% well, 6% not well).
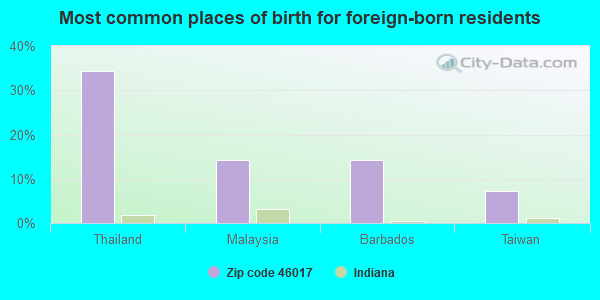
Foreign born population: 71 (1.2%) (72.9% of them are naturalized citizens)
This zip code:
1.2%
Whole state:
6.1%
34%Thailand
14%Malaysia
14%Barbados
7%Taiwan
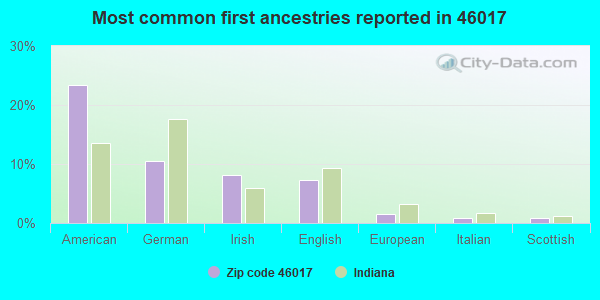
23%American
11%German
8%Irish
7%English
2%European
1%Italian
1%Scottish
Year of entry for the foreign-born population
82010 or later
122000 to 2009
01990 to 1999
90Before 1990
Facilities with environmental interests located in this zip code:
DELCO REMY AMERICA - LIBERTY PK (330 INDUSTRIAL DR in CHESTERFIELD, IN)
STATE MASTER (Indiana facility tracking) (Resource Conservation and Recovery Act (tracking hazardous waste)) Organizations: ANDERSON DEVELOPMENT LLC (CONTACT/OWNER)
MCQUIKS 9640 (ST RD 32 in CHESTERFIELD, IN)
STATE MASTER (Indiana facility tracking) (Resource Conservation and Recovery Act (tracking hazardous waste)) Organizations: WILLIS GARY (CONTACT/OWNER)
PRECISION TRANSMISSION (2040 ST RD 109 S in ANDERSON, IN)
STATE MASTER (Indiana facility tracking) USED OIL PROGRAM (Resource Conservation and Recovery Act (tracking hazardous waste)) Organizations: PUTNAM TOM (CONTACT/OWNER)
RILEY AND SONS AUTO (2394 E 400 S in ANDERSON, IN)
STATE MASTER (Indiana facility tracking) Conditionally Exempt Small Quantity Generators, less than 100 kg/month of hazardous waste (Resource Conservation and Recovery Act (tracking hazardous waste)) - notification Organizations: RILEY TIM (CONTACT/OWNER)
Housing units lacking complete plumbing facilities: 1.7% Housing units lacking complete kitchen facilities: 1.3%
75.5%Utility gas
21.6%Electricity
2.4%Bottled, tank, or LP gas
Population in 1990: 6,038. Population change in the 1990s: +354 (+5.9%).
Place of birth for U.S.-born residents:
This state: 4,805
Northeast: 60
Midwest: 428
South: 321
West: 186
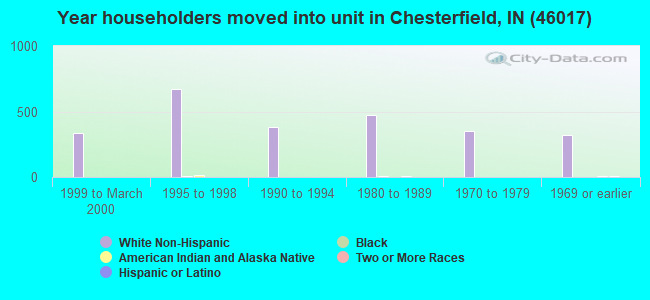
61% of the 46017 zip code residents lived in the same house 5 years ago. Out of people who lived in different houses, 75% lived in this county. Out of people who lived in different counties, 50% lived in Indiana.
89% of the 46017 zip code residents lived in the same house 1 year ago. Out of people who lived in different houses, 65% moved from this county. Out of people who lived in different houses, 28% moved from different county within same state. Out of people who lived in different houses, 5% moved from different state.
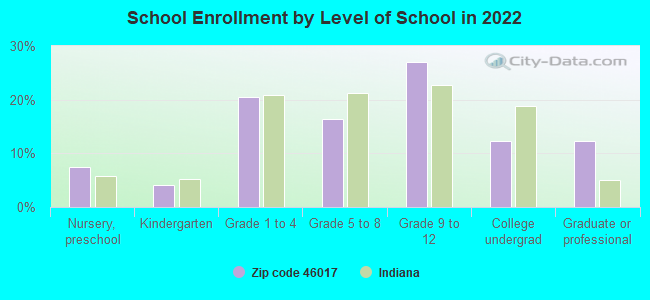
Private vs. public school enrollment:
Students in private schools in grades 1 to 8 (elementary and middle school): 12
Here:
3.3%
Indiana:
14.9%
Students in private schools in grades 9 to 12 (high school): 10
Here:
3.5%
Indiana:
11.4%
Students in private undergraduate colleges:
Here:
0.0%
Indiana:
22.3%
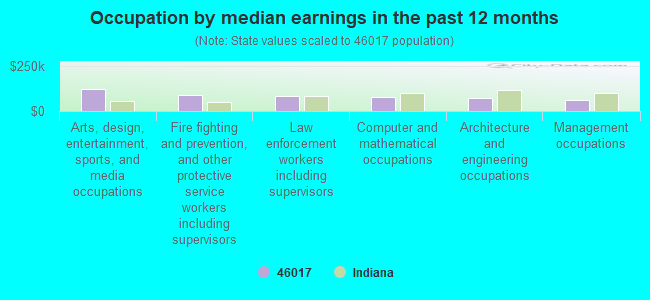
Occupation by median earnings in the past 12 months ($)
122,826Arts, design, entertainment, sports, and media occupations
90,339Fire fighting and prevention, and other protective service workers including supervisors
80,365Law enforcement workers including supervisors
76,738Computer and mathematical occupations
73,729Architecture and engineering occupations
61,757Management occupations
Top industries in this zip code by the number of employees in 2005:
Health Care and Social Assistance: Nursing Care Facilities (50-99 employees: 1 establishment)
Health Care and Social Assistance: Ambulance Services (20-49: 2)
Administrative and Support and Waste Management and Remediation Services: Landscaping Services (20-49: 1, 1-4: 6)
Real Estate and Rental and Leasing: Formal Wear and Costume Rental (20-49: 1, 1-4: 1)
Other Services (except Public Administration): Automotive Body, Paint, and Interior Repair and Maintenance (20-49: 1, 1-4: 1)
Other Services (except Public Administration): Religious Organizations (10-19: 1, 5-9: 1, 1-4: 5)
People in group quarters in 2010:
51 people in nursing facilities/skilled-nursing facilities
8 people in group homes intended for adults
7 people in correctional facilities intended for juveniles
People in group quarters in 2000:
66 people in unknown juvenile institutions
56 people in nursing homes
15 people in homes for abused, dependent, and neglected children
Fatal accident statistics in 2014:
Fatal accident count: 1
Vehicles involved in fatal accidents: 1
Fatal accidents caused by drunken drivers: 0
Fatalities: 1
Persons involved in fatal accidents: 2
Pedestrians involved in fatal accidents: 0
Fatal accident statistics in 2011:
Fatal accident count: 1
Vehicles involved in fatal accidents: 1
Fatal accidents caused by drunken drivers: 0
Fatalities: 1
Persons involved in fatal accidents: 4
Pedestrians involved in fatal accidents: 0
Home Mortgage Disclosure Act Aggregated Statistics For Year 2009 (Based on 2 full and 2 partial tracts)
A) FHA, FSA/RHS & VA Home Purchase Loans
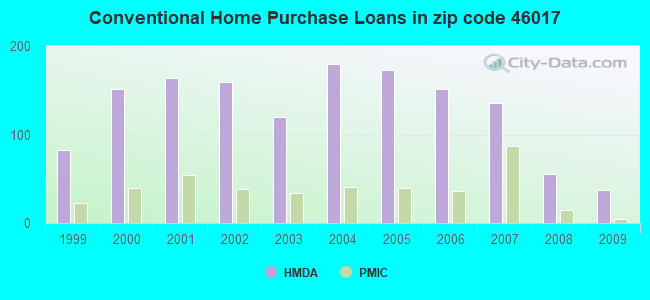
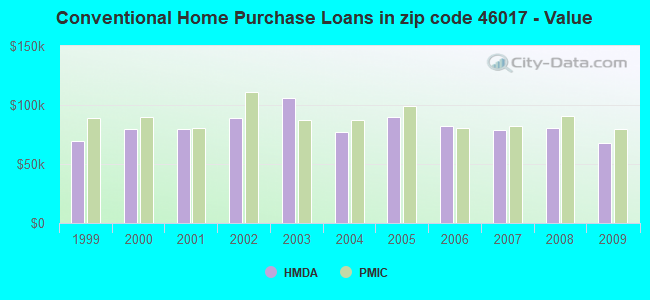
B) Conventional Home Purchase Loans
C) Refinancings
D) Home Improvement Loans
F) Non-occupant Loans on < 5 Family Dwellings (A B C & D)
G) Loans On Manufactured Home Dwelling (A B C & D)
Number
Average Value
Number
Average Value
Number
Average Value
Number
Average Value
Number
Average Value
Number
Average Value
LOANS ORIGINATED
76
$79,437
37
$67,879
228
$105,494
16
$33,052
16
$74,649
6
$60,222
APPLICATIONS APPROVED, NOT ACCEPTED
2
$31,810
4
$62,238
32
$109,437
1
$8,520
0
$0
4
$27,678
APPLICATIONS DENIED
8
$69,185
6
$69,182
80
$111,406
19
$8,328
0
$0
1
$45,010
APPLICATIONS WITHDRAWN
14
$100,517
1
$63,260
35
$98,980
3
$26,320
0
$0
0
$0
FILES CLOSED FOR INCOMPLETENESS
0
$0
1
$133,830
9
$122,336
0
$0
0
$0
0
$0
Aggregated Statistics For Year 2008 (Based on 2 full and 2 partial tracts)
A) FHA, FSA/RHS & VA Home Purchase Loans
B) Conventional Home Purchase Loans
C) Refinancings
D) Home Improvement Loans
F) Non-occupant Loans on < 5 Family Dwellings (A B C & D)
G) Loans On Manufactured Home Dwelling (A B C & D)
Number
Average Value
Number
Average Value
Number
Average Value
Number
Average Value
Number
Average Value
Number
Average Value
LOANS ORIGINATED
43
$90,930
55
$80,552
149
$92,180
16
$10,386
17
$57,342
10
$32,605
APPLICATIONS APPROVED, NOT ACCEPTED
1
$120,440
2
$145,990
14
$112,062
5
$26,456
1
$70,560
0
$0
APPLICATIONS DENIED
9
$81,858
21
$84,698
118
$97,384
36
$26,436
7
$40,901
8
$47,902
APPLICATIONS WITHDRAWN
6
$61,552
9
$71,679
52
$115,403
6
$21,340
4
$83,350
0
$0
FILES CLOSED FOR INCOMPLETENESS
1
$92,460
4
$61,135
5
$95,382
0
$0
2
$77,255
0
$0
Aggregated Statistics For Year 2007 (Based on 2 full and 2 partial tracts)
A) FHA, FSA/RHS & VA Home Purchase Loans
B) Conventional Home Purchase Loans
C) Refinancings
D) Home Improvement Loans
E) Loans on Dwellings For 5+ Families
F) Non-occupant Loans on < 5 Family Dwellings (A B C & D)
G) Loans On Manufactured Home Dwelling (A B C & D)
Number
Average Value
Number
Average Value
Number
Average Value
Number
Average Value
Number
Average Value
Number
Average Value
Number
Average Value
LOANS ORIGINATED
20
$90,604
136
$78,467
209
$94,035
41
$24,001
2
$824,025
22
$51,959
12
$63,097
APPLICATIONS APPROVED, NOT ACCEPTED
3
$99,127
16
$88,503
50
$98,855
7
$12,670
0
$0
1
$94,890
0
$0
APPLICATIONS DENIED
1
$154,510
35
$81,263
147
$91,464
62
$41,843
0
$0
8
$64,362
6
$18,902
APPLICATIONS WITHDRAWN
0
$0
7
$77,514
59
$92,268
9
$73,153
0
$0
2
$77,255
0
$0
FILES CLOSED FOR INCOMPLETENESS
0
$0
3
$80,670
16
$140,099
0
$0
0
$0
0
$0
0
$0
Aggregated Statistics For Year 2006 (Based on 2 full and 2 partial tracts)
A) FHA, FSA/RHS & VA Home Purchase Loans
B) Conventional Home Purchase Loans
C) Refinancings
D) Home Improvement Loans
F) Non-occupant Loans on < 5 Family Dwellings (A B C & D)
G) Loans On Manufactured Home Dwelling (A B C & D)
Number
Average Value
Number
Average Value
Number
Average Value
Number
Average Value
Number
Average Value
Number
Average Value
LOANS ORIGINATED
33
$100,116
151
$82,450
212
$87,266
31
$33,317
28
$57,470
11
$68,727
APPLICATIONS APPROVED, NOT ACCEPTED
0
$0
14
$64,108
50
$85,492
14
$24,412
2
$49,270
1
$32,850
APPLICATIONS DENIED
3
$86,533
50
$75,929
206
$90,488
42
$32,913
16
$81,391
9
$38,486
APPLICATIONS WITHDRAWN
4
$69,625
24
$64,773
111
$97,184
4
$47,908
0
$0
4
$38,628
FILES CLOSED FOR INCOMPLETENESS
0
$0
8
$67,826
47
$112,146
0
$0
0
$0
0
$0
Aggregated Statistics For Year 2005 (Based on 2 full and 2 partial tracts)
A) FHA, FSA/RHS & VA Home Purchase Loans
B) Conventional Home Purchase Loans
C) Refinancings
D) Home Improvement Loans
F) Non-occupant Loans on < 5 Family Dwellings (A B C & D)
G) Loans On Manufactured Home Dwelling (A B C & D)
Number
Average Value
Number
Average Value
Number
Average Value
Number
Average Value
Number
Average Value
Number
Average Value
LOANS ORIGINATED
34
$84,309
173
$89,929
295
$85,878
47
$34,183
21
$70,373
11
$65,202
APPLICATIONS APPROVED, NOT ACCEPTED
0
$0
19
$94,713
64
$91,241
11
$29,325
2
$47,710
0
$0
APPLICATIONS DENIED
4
$69,082
34
$68,732
225
$91,622
34
$30,984
9
$103,658
5
$53,774
APPLICATIONS WITHDRAWN
1
$144,780
25
$80,614
111
$106,610
11
$121,449
6
$55,172
1
$31,630
FILES CLOSED FOR INCOMPLETENESS
0
$0
5
$103,654
49
$111,242
2
$54,745
1
$98,540
0
$0
Aggregated Statistics For Year 2004 (Based on 2 full and 2 partial tracts)
A) FHA, FSA/RHS & VA Home Purchase Loans
B) Conventional Home Purchase Loans
C) Refinancings
D) Home Improvement Loans
E) Loans on Dwellings For 5+ Families
F) Non-occupant Loans on < 5 Family Dwellings (A B C & D)
G) Loans On Manufactured Home Dwelling (A B C & D)
Number
Average Value
Number
Average Value
Number
Average Value
Number
Average Value
Number
Average Value
Number
Average Value
Number
Average Value
LOANS ORIGINATED
51
$85,635
180
$77,381
402
$87,179
49
$33,598
1
$60,830
35
$44,072
9
$57,586
APPLICATIONS APPROVED, NOT ACCEPTED
5
$63,380
31
$53,319
85
$96,572
12
$11,951
0
$0
4
$50,792
6
$53,148
APPLICATIONS DENIED
8
$66,944
30
$56,558
185
$98,044
27
$26,011
0
$0
14
$53,526
17
$37,422
APPLICATIONS WITHDRAWN
4
$95,435
7
$146,869
117
$101,595
5
$32,604
0
$0
6
$49,700
0
$0
FILES CLOSED FOR INCOMPLETENESS
2
$76,540
2
$193,440
39
$102,527
4
$25,845
0
$0
0
$0
0
$0
Aggregated Statistics For Year 2003 (Based on 2 full and 2 partial tracts)
A) FHA, FSA/RHS & VA Home Purchase Loans
B) Conventional Home Purchase Loans
C) Refinancings
D) Home Improvement Loans
F) Non-occupant Loans on < 5 Family Dwellings (A B C & D)
Number
Average Value
Number
Average Value
Number
Average Value
Number
Average Value
Number
Average Value
LOANS ORIGINATED
45
$94,202
120
$105,631
811
$91,209
37
$26,835
36
$60,489
APPLICATIONS APPROVED, NOT ACCEPTED
8
$72,175
10
$88,933
67
$90,021
15
$19,236
3
$33,193
APPLICATIONS DENIED
7
$85,210
17
$56,746
216
$79,020
32
$16,409
10
$118,765
APPLICATIONS WITHDRAWN
2
$142,950
18
$76,781
130
$95,627
4
$6,958
5
$73,240
FILES CLOSED FOR INCOMPLETENESS
0
$0
8
$64,559
19
$92,810
2
$39,760
2
$109,495
Aggregated Statistics For Year 2002 (Based on 2 full and 2 partial tracts)
A) FHA, FSA/RHS & VA Home Purchase Loans
B) Conventional Home Purchase Loans
C) Refinancings
D) Home Improvement Loans
F) Non-occupant Loans on < 5 Family Dwellings (A B C & D)
Number
Average Value
Number
Average Value
Number
Average Value
Number
Average Value
Number
Average Value
LOANS ORIGINATED
77
$88,221
159
$88,594
530
$93,223
40
$17,858
26
$61,704
APPLICATIONS APPROVED, NOT ACCEPTED
1
$143,560
21
$59,460
85
$86,123
7
$17,011
5
$44,284
APPLICATIONS DENIED
5
$79,106
45
$57,429
167
$73,350
58
$13,637
6
$42,965
APPLICATIONS WITHDRAWN
3
$79,937
8
$96,532
105
$91,963
8
$9,644
0
$0
FILES CLOSED FOR INCOMPLETENESS
2
$63,615
7
$83,121
32
$90,269
0
$0
0
$0
Aggregated Statistics For Year 2001 (Based on 2 full and 2 partial tracts)
A) FHA, FSA/RHS & VA Home Purchase Loans
B) Conventional Home Purchase Loans
C) Refinancings
D) Home Improvement Loans
F) Non-occupant Loans on < 5 Family Dwellings (A B C & D)
Number
Average Value
Number
Average Value
Number
Average Value
Number
Average Value
Number
Average Value
LOANS ORIGINATED
85
$84,065
164
$80,004
607
$90,313
77
$14,741
29
$54,072
APPLICATIONS APPROVED, NOT ACCEPTED
0
$0
31
$61,522
77
$67,825
19
$46,653
1
$62,050
APPLICATIONS DENIED
5
$69,368
113
$43,129
204
$76,858
60
$18,409
6
$54,493
APPLICATIONS WITHDRAWN
5
$92,120
14
$108,451
106
$93,148
18
$16,327
2
$38,765
FILES CLOSED FOR INCOMPLETENESS
1
$110,710
1
$115,580
18
$85,094
0
$0
0
$0
Aggregated Statistics For Year 2000 (Based on 2 full and 2 partial tracts)
A) FHA, FSA/RHS & VA Home Purchase Loans
B) Conventional Home Purchase Loans
C) Refinancings
D) Home Improvement Loans
F) Non-occupant Loans on < 5 Family Dwellings (A B C & D)
Number
Average Value
Number
Average Value
Number
Average Value
Number
Average Value
Number
Average Value
LOANS ORIGINATED
86
$79,918
151
$79,592
204
$81,536
93
$14,949
23
$46,088
APPLICATIONS APPROVED, NOT ACCEPTED
1
$114,360
22
$76,036
64
$68,154
30
$17,932
0
$0
APPLICATIONS DENIED
4
$77,268
97
$41,910
128
$70,236
57
$11,309
2
$39,760
APPLICATIONS WITHDRAWN
3
$79,247
15
$80,161
65
$69,886
14
$20,506
0
$0
FILES CLOSED FOR INCOMPLETENESS
0
$0
2
$78,525
35
$67,446
0
$0
1
$96,110
Aggregated Statistics For Year 1999 (Based on 1 full and 1 partial tracts)
A) FHA, FSA/RHS & VA Home Purchase Loans
B) Conventional Home Purchase Loans
C) Refinancings
D) Home Improvement Loans
F) Non-occupant Loans on < 5 Family Dwellings (A B C & D)
Detailed PMIC statistics for the following Tracts:0112.00
, 0113.00
2002 - 2018 National Fire Incident Reporting System (NFIRS) incidents
Based on the data from the years 2002 - 2018 the average number of fires per year is 43. The highest number of fires - 71 took place in 2007, and the least - 6 in 2018. The data has a declining trend.
When looking into fire subcategories, the most reports belonged to: Structure Fires (51.8%), and Outside Fires (28.6%).
Fire incident types reported to NFIRS in Zip Code 46017


 Nearest zip codes: 46013, 46016, 46012, 46056, 47334, 47356.


 Based on the data from the years 2002 - 2018 the average number of fires per year is 43. The highest number of fires - 71 took place in 2007, and the least - 6 in 2018. The data has a declining trend.
 When looking into fire subcategories, the most reports belonged to: Structure Fires (51.8%), and Outside Fires (28.6%).