Estimated zip code population in 2022: 40,144
Zip code population in 2010: 34,889
Zip code population in 2000: 29,067
Houses and condos: 15,054
Renter-occupied apartments: 2,023
% of renters here:
14%State:
29%
March 2022 cost of living index in zip code 46033: 89.6
(less than average, U.S. average is 100)
Land area: 17.1
sq. mi.
Water area: 0.5
sq. mi.
Population density: 2,342 people per square mile (low).
OSM Map
General Map
Google Map
MSN Map
OSM Map
General Map
Google Map
MSN Map
OSM Map
General Map
Google Map
MSN Map
OSM Map
General Map
Google Map
MSN Map
Please wait while loading the map...
Real estate property taxes paid for housing units in 2022:
This zip code:
0.8% ($3,926)Indiana:
0.7% ($1,467)
Median real estate property taxes paid for housing units with mortgages in 2022: $4,093 (0.8%)
Median real estate property taxes paid for housing units with no mortgage in 2022: $3,744 (0.9%)
Profiles of local businesses
Business Search - 14 Million verified businesses
Males: 19,194 Females: 20,949
For population 25 years and over in 46033:
High school or higher: 101.7%Bachelor's degree or higher: 75.3%Graduate or professional degree: 31.3%Unemployed: 1.6%Mean travel time to work (commute): 25.0 minutes
For population 15 years and over in 46033:
Never married: 19.5%Now married: 71.8%Separated: 0.7%Widowed: 2.9%Divorced: 5.1%
Zip code 46033 compared to state average:
Median household income above state average. Median house value significantly above state average. Unemployed percentage below state average. Black race population percentage significantly below state average. Foreign-born population percentage above state average. Renting percentage below state average. Length of stay since moving in above state average. Number of rooms per house significantly above state average. House age significantly below state average. Percentage of population with a bachelor's degree or higher significantly above state average. 32,104 80.0% White 3,421 8.5% Asian 2,137 5.3% Hispanic or Latino 1,330 3.3% Two or more races 733 1.8% Black 361 0.9% Some other race 56 0.1% American Indian
Data:
Median household income ($)
Median household income (% change since 2000)
Household income diversity
Ratio of average income to average house value (%)
Ratio of average income to average rent
Median household income ($) - White
Median household income ($) - Black or African American
Median household income ($) - Asian
Median household income ($) - Hispanic or Latino
Median household income ($) - American Indian and Alaska Native
Median household income ($) - Multirace
Median household income ($) - Other Race
Median household income for houses/condos with a mortgage ($)
Median household income for apartments without a mortgage ($)
Races - White alone (%)
Races - White alone (% change since 2000)
Races - Black alone (%)
Races - Black alone (% change since 2000)
Races - American Indian alone (%)
Races - American Indian alone (% change since 2000)
Races - Asian alone (%)
Races - Asian alone (% change since 2000)
Races - Hispanic (%)
Races - Hispanic (% change since 2000)
Races - Native Hawaiian and Other Pacific Islander alone (%)
Races - Native Hawaiian and Other Pacific Islander alone (% change since 2000)
Races - Two or more races (%)
Races - Two or more races (% change since 2000)
Races - Other race alone (%)
Races - Other race alone (% change since 2000)
Racial diversity
Unemployment (%)
Unemployment (% change since 2000)
Unemployment (%) - White
Unemployment (%) - Black or African American
Unemployment (%) - Asian
Unemployment (%) - Hispanic or Latino
Unemployment (%) - American Indian and Alaska Native
Unemployment (%) - Multirace
Unemployment (%) - Other Race
Population density (people per square mile)
Population - Males (%)
Population - Females (%)
Population - Males (%) - White
Population - Males (%) - Black or African American
Population - Males (%) - Asian
Population - Males (%) - Hispanic or Latino
Population - Males (%) - American Indian and Alaska Native
Population - Males (%) - Multirace
Population - Males (%) - Other Race
Population - Females (%) - White
Population - Females (%) - Black or African American
Population - Females (%) - Asian
Population - Females (%) - Hispanic or Latino
Population - Females (%) - American Indian and Alaska Native
Population - Females (%) - Multirace
Population - Females (%) - Other Race
Coronavirus confirmed cases (Apr 27, 2024)
Deaths caused by coronavirus (Apr 27, 2024)
Coronavirus confirmed cases (per 100k population) (Apr 27, 2024)
Deaths caused by coronavirus (per 100k population) (Apr 27, 2024)
Daily increase in number of cases (Apr 27, 2024)
Weekly increase in number of cases (Apr 27, 2024)
Cases doubled (in days) (Apr 27, 2024)
Hospitalized patients (Apr 18, 2022)
Negative test results (Apr 18, 2022)
Total test results (Apr 18, 2022)
COVID Vaccine doses distributed (per 100k population) (Sep 19, 2023)
COVID Vaccine doses administered (per 100k population) (Sep 19, 2023)
COVID Vaccine doses distributed (Sep 19, 2023)
COVID Vaccine doses administered (Sep 19, 2023)
Likely homosexual households (%)
Likely homosexual households (% change since 2000)
Likely homosexual households - Lesbian couples (%)
Likely homosexual households - Lesbian couples (% change since 2000)
Likely homosexual households - Gay men (%)
Likely homosexual households - Gay men (% change since 2000)
Cost of living index
Median gross rent ($)
Median contract rent ($)
Median monthly housing costs ($)
Median house or condo value ($)
Median house or condo value ($ change since 2000)
Mean house or condo value by units in structure - 1, detached ($)
Mean house or condo value by units in structure - 1, attached ($)
Mean house or condo value by units in structure - 2 ($)
Mean house or condo value by units in structure by units in structure - 3 or 4 ($)
Mean house or condo value by units in structure - 5 or more ($)
Mean house or condo value by units in structure - Boat, RV, van, etc. ($)
Mean house or condo value by units in structure - Mobile home ($)
Median house or condo value ($) - White
Median house or condo value ($) - Black or African American
Median house or condo value ($) - Asian
Median house or condo value ($) - Hispanic or Latino
Median house or condo value ($) - American Indian and Alaska Native
Median house or condo value ($) - Multirace
Median house or condo value ($) - Other Race
Median resident age
Resident age diversity
Median resident age - Males
Median resident age - Females
Median resident age - White
Median resident age - Black or African American
Median resident age - Asian
Median resident age - Hispanic or Latino
Median resident age - American Indian and Alaska Native
Median resident age - Multirace
Median resident age - Other Race
Median resident age - Males - White
Median resident age - Males - Black or African American
Median resident age - Males - Asian
Median resident age - Males - Hispanic or Latino
Median resident age - Males - American Indian and Alaska Native
Median resident age - Males - Multirace
Median resident age - Males - Other Race
Median resident age - Females - White
Median resident age - Females - Black or African American
Median resident age - Females - Asian
Median resident age - Females - Hispanic or Latino
Median resident age - Females - American Indian and Alaska Native
Median resident age - Females - Multirace
Median resident age - Females - Other Race
Commute - mean travel time to work (minutes)
Travel time to work - Less than 5 minutes (%)
Travel time to work - Less than 5 minutes (% change since 2000)
Travel time to work - 5 to 9 minutes (%)
Travel time to work - 5 to 9 minutes (% change since 2000)
Travel time to work - 10 to 19 minutes (%)
Travel time to work - 10 to 19 minutes (% change since 2000)
Travel time to work - 20 to 29 minutes (%)
Travel time to work - 20 to 29 minutes (% change since 2000)
Travel time to work - 30 to 39 minutes (%)
Travel time to work - 30 to 39 minutes (% change since 2000)
Travel time to work - 40 to 59 minutes (%)
Travel time to work - 40 to 59 minutes (% change since 2000)
Travel time to work - 60 to 89 minutes (%)
Travel time to work - 60 to 89 minutes (% change since 2000)
Travel time to work - 90 or more minutes (%)
Travel time to work - 90 or more minutes (% change since 2000)
Marital status - Never married (%)
Marital status - Now married (%)
Marital status - Separated (%)
Marital status - Widowed (%)
Marital status - Divorced (%)
Median family income ($)
Median family income (% change since 2000)
Median non-family income ($)
Median non-family income (% change since 2000)
Median per capita income ($)
Median per capita income (% change since 2000)
Median family income ($) - White
Median family income ($) - Black or African American
Median family income ($) - Asian
Median family income ($) - Hispanic or Latino
Median family income ($) - American Indian and Alaska Native
Median family income ($) - Multirace
Median family income ($) - Other Race
Median year house/condo built
Median year apartment built
Year house built - Built 2005 or later (%)
Year house built - Built 2000 to 2004 (%)
Year house built - Built 1990 to 1999 (%)
Year house built - Built 1980 to 1989 (%)
Year house built - Built 1970 to 1979 (%)
Year house built - Built 1960 to 1969 (%)
Year house built - Built 1950 to 1959 (%)
Year house built - Built 1940 to 1949 (%)
Year house built - Built 1939 or earlier (%)
Average household size
Household density (households per square mile)
Average household size - White
Average household size - Black or African American
Average household size - Asian
Average household size - Hispanic or Latino
Average household size - American Indian and Alaska Native
Average household size - Multirace
Average household size - Other Race
Occupied housing units (%)
Vacant housing units (%)
Owner occupied housing units (%)
Renter occupied housing units (%)
Vacancy status - For rent (%)
Vacancy status - For sale only (%)
Vacancy status - Rented or sold, not occupied (%)
Vacancy status - For seasonal, recreational, or occasional use (%)
Vacancy status - For migrant workers (%)
Vacancy status - Other vacant (%)
Residents with income below the poverty level (%)
Residents with income below 50% of the poverty level (%)
Children below poverty level (%)
Poor families by family type - Married-couple family (%)
Poor families by family type - Male, no wife present (%)
Poor families by family type - Female, no husband present (%)
Poverty status for native-born residents (%)
Poverty status for foreign-born residents (%)
Poverty among high school graduates not in families (%)
Poverty among people who did not graduate high school not in families (%)
Residents with income below the poverty level (%) - White
Residents with income below the poverty level (%) - Black or African American
Residents with income below the poverty level (%) - Asian
Residents with income below the poverty level (%) - Hispanic or Latino
Residents with income below the poverty level (%) - American Indian and Alaska Native
Residents with income below the poverty level (%) - Multirace
Residents with income below the poverty level (%) - Other Race
Air pollution - Air Quality Index (AQI)
Air pollution - CO
Air pollution - NO2
Air pollution - SO2
Air pollution - Ozone
Air pollution - PM10
Air pollution - PM25
Air pollution - Pb
Crime - Murders per 100,000 population
Crime - Rapes per 100,000 population
Crime - Robberies per 100,000 population
Crime - Assaults per 100,000 population
Crime - Burglaries per 100,000 population
Crime - Thefts per 100,000 population
Crime - Auto thefts per 100,000 population
Crime - Arson per 100,000 population
Crime - City-data.com crime index
Crime - Violent crime index
Crime - Property crime index
Crime - Murders per 100,000 population (5 year average)
Crime - Rapes per 100,000 population (5 year average)
Crime - Robberies per 100,000 population (5 year average)
Crime - Assaults per 100,000 population (5 year average)
Crime - Burglaries per 100,000 population (5 year average)
Crime - Thefts per 100,000 population (5 year average)
Crime - Auto thefts per 100,000 population (5 year average)
Crime - Arson per 100,000 population (5 year average)
Crime - City-data.com crime index (5 year average)
Crime - Violent crime index (5 year average)
Crime - Property crime index (5 year average)
1996 Presidential Elections Results (%) - Democratic Party (Clinton)
1996 Presidential Elections Results (%) - Republican Party (Dole)
1996 Presidential Elections Results (%) - Other
2000 Presidential Elections Results (%) - Democratic Party (Gore)
2000 Presidential Elections Results (%) - Republican Party (Bush)
2000 Presidential Elections Results (%) - Other
2004 Presidential Elections Results (%) - Democratic Party (Kerry)
2004 Presidential Elections Results (%) - Republican Party (Bush)
2004 Presidential Elections Results (%) - Other
2008 Presidential Elections Results (%) - Democratic Party (Obama)
2008 Presidential Elections Results (%) - Republican Party (McCain)
2008 Presidential Elections Results (%) - Other
2012 Presidential Elections Results (%) - Democratic Party (Obama)
2012 Presidential Elections Results (%) - Republican Party (Romney)
2012 Presidential Elections Results (%) - Other
2016 Presidential Elections Results (%) - Democratic Party (Clinton)
2016 Presidential Elections Results (%) - Republican Party (Trump)
2016 Presidential Elections Results (%) - Other
2020 Presidential Elections Results (%) - Democratic Party (Biden)
2020 Presidential Elections Results (%) - Republican Party (Trump)
2020 Presidential Elections Results (%) - Other
Ancestries Reported - Arab (%)
Ancestries Reported - Czech (%)
Ancestries Reported - Danish (%)
Ancestries Reported - Dutch (%)
Ancestries Reported - English (%)
Ancestries Reported - French (%)
Ancestries Reported - French Canadian (%)
Ancestries Reported - German (%)
Ancestries Reported - Greek (%)
Ancestries Reported - Hungarian (%)
Ancestries Reported - Irish (%)
Ancestries Reported - Italian (%)
Ancestries Reported - Lithuanian (%)
Ancestries Reported - Norwegian (%)
Ancestries Reported - Polish (%)
Ancestries Reported - Portuguese (%)
Ancestries Reported - Russian (%)
Ancestries Reported - Scotch-Irish (%)
Ancestries Reported - Scottish (%)
Ancestries Reported - Slovak (%)
Ancestries Reported - Subsaharan African (%)
Ancestries Reported - Swedish (%)
Ancestries Reported - Swiss (%)
Ancestries Reported - Ukrainian (%)
Ancestries Reported - United States (%)
Ancestries Reported - Welsh (%)
Ancestries Reported - West Indian (%)
Ancestries Reported - Other (%)
Educational Attainment - No schooling completed (%)
Educational Attainment - Less than high school (%)
Educational Attainment - High school or equivalent (%)
Educational Attainment - Less than 1 year of college (%)
Educational Attainment - 1 or more years of college (%)
Educational Attainment - Associate degree (%)
Educational Attainment - Bachelor's degree (%)
Educational Attainment - Master's degree (%)
Educational Attainment - Professional school degree (%)
Educational Attainment - Doctorate degree (%)
School Enrollment - Nursery, preschool (%)
School Enrollment - Kindergarten (%)
School Enrollment - Grade 1 to 4 (%)
School Enrollment - Grade 5 to 8 (%)
School Enrollment - Grade 9 to 12 (%)
School Enrollment - College undergrad (%)
School Enrollment - Graduate or professional (%)
School Enrollment - Not enrolled in school (%)
School enrollment - Public schools (%)
School enrollment - Private schools (%)
School enrollment - Not enrolled (%)
Median number of rooms in houses and condos
Median number of rooms in apartments
Housing units lacking complete plumbing facilities (%)
Housing units lacking complete kitchen facilities (%)
Density of houses
Urban houses (%)
Rural houses (%)
Households with people 60 years and over (%)
Households with people 65 years and over (%)
Households with people 75 years and over (%)
Households with one or more nonrelatives (%)
Households with no nonrelatives (%)
Population in households (%)
Family households (%)
Nonfamily households (%)
Population in families (%)
Family households with own children (%)
Median number of bedrooms in owner occupied houses
Mean number of bedrooms in owner occupied houses
Median number of bedrooms in renter occupied houses
Mean number of bedrooms in renter occupied houses
Median number of vehichles in owner occupied houses
Mean number of vehichles in owner occupied houses
Median number of vehichles in renter occupied houses
Mean number of vehichles in renter occupied houses
Mortgage status - with mortgage (%)
Mortgage status - with second mortgage (%)
Mortgage status - with home equity loan (%)
Mortgage status - with both second mortgage and home equity loan (%)
Mortgage status - without a mortgage (%)
Average family size
Average family size - White
Average family size - Black or African American
Average family size - Asian
Average family size - Hispanic or Latino
Average family size - American Indian and Alaska Native
Average family size - Multirace
Average family size - Other Race
Geographical mobility - Same house 1 year ago (%)
Geographical mobility - Moved within same county (%)
Geographical mobility - Moved from different county within same state (%)
Geographical mobility - Moved from different state (%)
Geographical mobility - Moved from abroad (%)
Place of birth - Born in state of residence (%)
Place of birth - Born in other state (%)
Place of birth - Native, outside of US (%)
Place of birth - Foreign born (%)
Housing units in structures - 1, detached (%)
Housing units in structures - 1, attached (%)
Housing units in structures - 2 (%)
Housing units in structures - 3 or 4 (%)
Housing units in structures - 5 to 9 (%)
Housing units in structures - 10 to 19 (%)
Housing units in structures - 20 to 49 (%)
Housing units in structures - 50 or more (%)
Housing units in structures - Mobile home (%)
Housing units in structures - Boat, RV, van, etc. (%)
House/condo owner moved in on average (years ago)
Renter moved in on average (years ago)
Year householder moved into unit - Moved in 1999 to March 2000 (%)
Year householder moved into unit - Moved in 1995 to 1998 (%)
Year householder moved into unit - Moved in 1990 to 1994 (%)
Year householder moved into unit - Moved in 1980 to 1989 (%)
Year householder moved into unit - Moved in 1970 to 1979 (%)
Year householder moved into unit - Moved in 1969 or earlier (%)
Means of transportation to work - Drove car alone (%)
Means of transportation to work - Carpooled (%)
Means of transportation to work - Public transportation (%)
Means of transportation to work - Bus or trolley bus (%)
Means of transportation to work - Streetcar or trolley car (%)
Means of transportation to work - Subway or elevated (%)
Means of transportation to work - Railroad (%)
Means of transportation to work - Ferryboat (%)
Means of transportation to work - Taxicab (%)
Means of transportation to work - Motorcycle (%)
Means of transportation to work - Bicycle (%)
Means of transportation to work - Walked (%)
Means of transportation to work - Other means (%)
Working at home (%)
Industry diversity
Most Common Industries - Agriculture, forestry, fishing and hunting, and mining (%)
Most Common Industries - Agriculture, forestry, fishing and hunting (%)
Most Common Industries - Mining, quarrying, and oil and gas extraction (%)
Most Common Industries - Construction (%)
Most Common Industries - Manufacturing (%)
Most Common Industries - Wholesale trade (%)
Most Common Industries - Retail trade (%)
Most Common Industries - Transportation and warehousing, and utilities (%)
Most Common Industries - Transportation and warehousing (%)
Most Common Industries - Utilities (%)
Most Common Industries - Information (%)
Most Common Industries - Finance and insurance, and real estate and rental and leasing (%)
Most Common Industries - Finance and insurance (%)
Most Common Industries - Real estate and rental and leasing (%)
Most Common Industries - Professional, scientific, and management, and administrative and waste management services (%)
Most Common Industries - Professional, scientific, and technical services (%)
Most Common Industries - Management of companies and enterprises (%)
Most Common Industries - Administrative and support and waste management services (%)
Most Common Industries - Educational services, and health care and social assistance (%)
Most Common Industries - Educational services (%)
Most Common Industries - Health care and social assistance (%)
Most Common Industries - Arts, entertainment, and recreation, and accommodation and food services (%)
Most Common Industries - Arts, entertainment, and recreation (%)
Most Common Industries - Accommodation and food services (%)
Most Common Industries - Other services, except public administration (%)
Most Common Industries - Public administration (%)
Occupation diversity
Most Common Occupations - Management, business, science, and arts occupations (%)
Most Common Occupations - Management, business, and financial occupations (%)
Most Common Occupations - Management occupations (%)
Most Common Occupations - Business and financial operations occupations (%)
Most Common Occupations - Computer, engineering, and science occupations (%)
Most Common Occupations - Computer and mathematical occupations (%)
Most Common Occupations - Architecture and engineering occupations (%)
Most Common Occupations - Life, physical, and social science occupations (%)
Most Common Occupations - Education, legal, community service, arts, and media occupations (%)
Most Common Occupations - Community and social service occupations (%)
Most Common Occupations - Legal occupations (%)
Most Common Occupations - Education, training, and library occupations (%)
Most Common Occupations - Arts, design, entertainment, sports, and media occupations (%)
Most Common Occupations - Healthcare practitioners and technical occupations (%)
Most Common Occupations - Health diagnosing and treating practitioners and other technical occupations (%)
Most Common Occupations - Health technologists and technicians (%)
Most Common Occupations - Service occupations (%)
Most Common Occupations - Healthcare support occupations (%)
Most Common Occupations - Protective service occupations (%)
Most Common Occupations - Fire fighting and prevention, and other protective service workers including supervisors (%)
Most Common Occupations - Law enforcement workers including supervisors (%)
Most Common Occupations - Food preparation and serving related occupations (%)
Most Common Occupations - Building and grounds cleaning and maintenance occupations (%)
Most Common Occupations - Personal care and service occupations (%)
Most Common Occupations - Sales and office occupations (%)
Most Common Occupations - Sales and related occupations (%)
Most Common Occupations - Office and administrative support occupations (%)
Most Common Occupations - Natural resources, construction, and maintenance occupations (%)
Most Common Occupations - Farming, fishing, and forestry occupations (%)
Most Common Occupations - Construction and extraction occupations (%)
Most Common Occupations - Installation, maintenance, and repair occupations (%)
Most Common Occupations - Production, transportation, and material moving occupations (%)
Most Common Occupations - Production occupations (%)
Most Common Occupations - Transportation occupations (%)
Most Common Occupations - Material moving occupations (%)
People in Group quarters - Institutionalized population (%)
People in Group quarters - Correctional institutions (%)
People in Group quarters - Federal prisons and detention centers (%)
People in Group quarters - Halfway houses (%)
People in Group quarters - Local jails and other confinement facilities (including police lockups) (%)
People in Group quarters - Military disciplinary barracks (%)
People in Group quarters - State prisons (%)
People in Group quarters - Other types of correctional institutions (%)
People in Group quarters - Nursing homes (%)
People in Group quarters - Hospitals/wards, hospices, and schools for the handicapped (%)
People in Group quarters - Hospitals/wards and hospices for chronically ill (%)
People in Group quarters - Hospices or homes for chronically ill (%)
People in Group quarters - Military hospitals or wards for chronically ill (%)
People in Group quarters - Other hospitals or wards for chronically ill (%)
People in Group quarters - Hospitals or wards for drug/alcohol abuse (%)
People in Group quarters - Mental (Psychiatric) hospitals or wards (%)
People in Group quarters - Schools, hospitals, or wards for the mentally retarded (%)
People in Group quarters - Schools, hospitals, or wards for the physically handicapped (%)
People in Group quarters - Institutions for the deaf (%)
People in Group quarters - Institutions for the blind (%)
People in Group quarters - Orthopedic wards and institutions for the physically handicapped (%)
People in Group quarters - Wards in general hospitals for patients who have no usual home elsewhere (%)
People in Group quarters - Wards in military hospitals for patients who have no usual home elsewhere (%)
People in Group quarters - Juvenile institutions (%)
People in Group quarters - Long-term care (%)
People in Group quarters - Homes for abused, dependent, and neglected children (%)
People in Group quarters - Residential treatment centers for emotionally disturbed children (%)
People in Group quarters - Training schools for juvenile delinquents (%)
People in Group quarters - Short-term care, detention or diagnostic centers for delinquent children (%)
People in Group quarters - Type of juvenile institution unknown (%)
People in Group quarters - Noninstitutionalized population (%)
People in Group quarters - College dormitories (includes college quarters off campus) (%)
People in Group quarters - Military quarters (%)
People in Group quarters - On base (%)
People in Group quarters - Barracks, unaccompanied personnel housing (UPH), (Enlisted/Officer), ;and similar group living quarters for military personnel (%)
People in Group quarters - Transient quarters for temporary residents (%)
People in Group quarters - Military ships (%)
People in Group quarters - Group homes (%)
People in Group quarters - Homes or halfway houses for drug/alcohol abuse (%)
People in Group quarters - Homes for the mentally ill (%)
People in Group quarters - Homes for the mentally retarded (%)
People in Group quarters - Homes for the physically handicapped (%)
People in Group quarters - Other group homes (%)
People in Group quarters - Religious group quarters (%)
People in Group quarters - Dormitories (%)
People in Group quarters - Agriculture workers' dormitories on farms (%)
People in Group quarters - Job Corps and vocational training facilities (%)
People in Group quarters - Other workers' dormitories (%)
People in Group quarters - Crews of maritime vessels (%)
People in Group quarters - Other nonhousehold living situations (%)
People in Group quarters - Other noninstitutional group quarters (%)
Residents speaking English at home (%)
Residents speaking English at home - Born in the United States (%)
Residents speaking English at home - Native, born elsewhere (%)
Residents speaking English at home - Foreign born (%)
Residents speaking Spanish at home (%)
Residents speaking Spanish at home - Born in the United States (%)
Residents speaking Spanish at home - Native, born elsewhere (%)
Residents speaking Spanish at home - Foreign born (%)
Residents speaking other language at home (%)
Residents speaking other language at home - Born in the United States (%)
Residents speaking other language at home - Native, born elsewhere (%)
Residents speaking other language at home - Foreign born (%)
Class of Workers - Employee of private company (%)
Class of Workers - Self-employed in own incorporated business (%)
Class of Workers - Private not-for-profit wage and salary workers (%)
Class of Workers - Local government workers (%)
Class of Workers - State government workers (%)
Class of Workers - Federal government workers (%)
Class of Workers - Self-employed workers in own not incorporated business and Unpaid family workers (%)
House heating fuel used in houses and condos - Utility gas (%)
House heating fuel used in houses and condos - Bottled, tank, or LP gas (%)
House heating fuel used in houses and condos - Electricity (%)
House heating fuel used in houses and condos - Fuel oil, kerosene, etc. (%)
House heating fuel used in houses and condos - Coal or coke (%)
House heating fuel used in houses and condos - Wood (%)
House heating fuel used in houses and condos - Solar energy (%)
House heating fuel used in houses and condos - Other fuel (%)
House heating fuel used in houses and condos - No fuel used (%)
House heating fuel used in apartments - Utility gas (%)
House heating fuel used in apartments - Bottled, tank, or LP gas (%)
House heating fuel used in apartments - Electricity (%)
House heating fuel used in apartments - Fuel oil, kerosene, etc. (%)
House heating fuel used in apartments - Coal or coke (%)
House heating fuel used in apartments - Wood (%)
House heating fuel used in apartments - Solar energy (%)
House heating fuel used in apartments - Other fuel (%)
House heating fuel used in apartments - No fuel used (%)
Armed forces status - In Armed Forces (%)
Armed forces status - Civilian (%)
Armed forces status - Civilian - Veteran (%)
Armed forces status - Civilian - Nonveteran (%)
Fatal accidents locations in years 2005-2021
Fatal accidents locations in 2005
Fatal accidents locations in 2006
Fatal accidents locations in 2007
Fatal accidents locations in 2008
Fatal accidents locations in 2009
Fatal accidents locations in 2010
Fatal accidents locations in 2011
Fatal accidents locations in 2012
Fatal accidents locations in 2013
Fatal accidents locations in 2014
Fatal accidents locations in 2015
Fatal accidents locations in 2016
Fatal accidents locations in 2017
Fatal accidents locations in 2018
Fatal accidents locations in 2019
Fatal accidents locations in 2020
Fatal accidents locations in 2021
Alcohol use - People drinking some alcohol every month (%)
Alcohol use - People not drinking at all (%)
Alcohol use - Average days/month drinking alcohol
Alcohol use - Average drinks/week
Alcohol use - Average days/year people drink much
Audiometry - Average condition of hearing (%)
Audiometry - People that can hear a whisper from across a quiet room (%)
Audiometry - People that can hear normal voice from across a quiet room (%)
Audiometry - Ears ringing, roaring, buzzing (%)
Audiometry - Had a job exposure to loud noise (%)
Audiometry - Had off-work exposure to loud noise (%)
Blood Pressure & Cholesterol - Has high blood pressure (%)
Blood Pressure & Cholesterol - Checking blood pressure at home (%)
Blood Pressure & Cholesterol - Frequently checking blood cholesterol (%)
Blood Pressure & Cholesterol - Has high cholesterol level (%)
Consumer Behavior - Money monthly spent on food at supermarket/grocery store
Consumer Behavior - Money monthly spent on food at other stores
Consumer Behavior - Money monthly spent on eating out
Consumer Behavior - Money monthly spent on carryout/delivered foods
Consumer Behavior - Income spent on food at supermarket/grocery store (%)
Consumer Behavior - Income spent on food at other stores (%)
Consumer Behavior - Income spent on eating out (%)
Consumer Behavior - Income spent on carryout/delivered foods (%)
Current Health Status - General health condition (%)
Current Health Status - Blood donors (%)
Current Health Status - Has blood ever tested for HIV virus (%)
Current Health Status - Left-handed people (%)
Dermatology - People using sunscreen (%)
Diabetes - Diabetics (%)
Diabetes - Had a blood test for high blood sugar (%)
Diabetes - People taking insulin (%)
Diet Behavior & Nutrition - Diet health (%)
Diet Behavior & Nutrition - Milk product consumption (# of products/month)
Diet Behavior & Nutrition - Meals not home prepared (#/week)
Diet Behavior & Nutrition - Meals from fast food or pizza place (#/week)
Diet Behavior & Nutrition - Ready-to-eat foods (#/month)
Diet Behavior & Nutrition - Frozen meals/pizza (#/month)
Drug Use - People that ever used marijuana or hashish (%)
Drug Use - Ever used hard drugs (%)
Drug Use - Ever used any form of cocaine (%)
Drug Use - Ever used heroin (%)
Drug Use - Ever used methamphetamine (%)
Health Insurance - People covered by health insurance (%)
Kidney Conditions-Urology - Avg. # of times urinating at night
Medical Conditions - People with asthma (%)
Medical Conditions - People with anemia (%)
Medical Conditions - People with psoriasis (%)
Medical Conditions - People with overweight (%)
Medical Conditions - Elderly people having difficulties in thinking or remembering (%)
Medical Conditions - People who ever received blood transfusion (%)
Medical Conditions - People having trouble seeing even with glass/contacts (%)
Medical Conditions - People with arthritis (%)
Medical Conditions - People with gout (%)
Medical Conditions - People with congestive heart failure (%)
Medical Conditions - People with coronary heart disease (%)
Medical Conditions - People with angina pectoris (%)
Medical Conditions - People who ever had heart attack (%)
Medical Conditions - People who ever had stroke (%)
Medical Conditions - People with emphysema (%)
Medical Conditions - People with thyroid problem (%)
Medical Conditions - People with chronic bronchitis (%)
Medical Conditions - People with any liver condition (%)
Medical Conditions - People who ever had cancer or malignancy (%)
Mental Health - People who have little interest in doing things (%)
Mental Health - People feeling down, depressed, or hopeless (%)
Mental Health - People who have trouble sleeping or sleeping too much (%)
Mental Health - People feeling tired or having little energy (%)
Mental Health - People with poor appetite or overeating (%)
Mental Health - People feeling bad about themself (%)
Mental Health - People who have trouble concentrating on things (%)
Mental Health - People moving or speaking slowly or too fast (%)
Mental Health - People having thoughts they would be better off dead (%)
Oral Health - Average years since last visit a dentist
Oral Health - People embarrassed because of mouth (%)
Oral Health - People with gum disease (%)
Oral Health - General health of teeth and gums (%)
Oral Health - Average days a week using dental floss/device
Oral Health - Average days a week using mouthwash for dental problem
Oral Health - Average number of teeth
Pesticide Use - Households using pesticides to control insects (%)
Pesticide Use - Households using pesticides to kill weeds (%)
Physical Activity - People doing vigorous-intensity work activities (%)
Physical Activity - People doing moderate-intensity work activities (%)
Physical Activity - People walking or bicycling (%)
Physical Activity - People doing vigorous-intensity recreational activities (%)
Physical Activity - People doing moderate-intensity recreational activities (%)
Physical Activity - Average hours a day doing sedentary activities
Physical Activity - Average hours a day watching TV or videos
Physical Activity - Average hours a day using computer
Physical Functioning - People having limitations keeping them from working (%)
Physical Functioning - People limited in amount of work they can do (%)
Physical Functioning - People that need special equipment to walk (%)
Physical Functioning - People experiencing confusion/memory problems (%)
Physical Functioning - People requiring special healthcare equipment (%)
Prescription Medications - Average number of prescription medicines taking
Preventive Aspirin Use - Adults 40+ taking low-dose aspirin (%)
Reproductive Health - Vaginal deliveries (%)
Reproductive Health - Cesarean deliveries (%)
Reproductive Health - Deliveries resulted in a live birth (%)
Reproductive Health - Pregnancies resulted in a delivery (%)
Reproductive Health - Women breastfeeding newborns (%)
Reproductive Health - Women that had a hysterectomy (%)
Reproductive Health - Women that had both ovaries removed (%)
Reproductive Health - Women that have ever taken birth control pills (%)
Reproductive Health - Women taking birth control pills (%)
Reproductive Health - Women that have ever used Depo-Provera or injectables (%)
Reproductive Health - Women that have ever used female hormones (%)
Sexual Behavior - People 18+ that ever had sex (vaginal, anal, or oral) (%)
Sexual Behavior - Males 18+ that ever had vaginal sex with a woman (%)
Sexual Behavior - Males 18+ that ever performed oral sex on a woman (%)
Sexual Behavior - Males 18+ that ever had anal sex with a woman (%)
Sexual Behavior - Males 18+ that ever had any sex with a man (%)
Sexual Behavior - Females 18+ that ever had vaginal sex with a man (%)
Sexual Behavior - Females 18+ that ever performed oral sex on a man (%)
Sexual Behavior - Females 18+ that ever had anal sex with a man (%)
Sexual Behavior - Females 18+ that ever had any kind of sex with a woman (%)
Sexual Behavior - Average age people first had sex
Sexual Behavior - Average number of female sex partners in lifetime (males 18+)
Sexual Behavior - Average number of female vaginal sex partners in lifetime (males 18+)
Sexual Behavior - Average age people first performed oral sex on a woman (18+)
Sexual Behavior - Average number of woman performed oral sex on in lifetime (18+)
Sexual Behavior - Average number of male sex partners in lifetime (males 18+)
Sexual Behavior - Average number of male anal sex partners in lifetime (males 18+)
Sexual Behavior - Average age people first performed oral sex on a man (18+)
Sexual Behavior - Average number of male oral sex partners in lifetime (18+)
Sexual Behavior - People using protection when performing oral sex (%)
Sexual Behavior - Average number of times people have vaginal or anal sex a year
Sexual Behavior - People having sex without condom (%)
Sexual Behavior - Average number of male sex partners in lifetime (females 18+)
Sexual Behavior - Average number of male vaginal sex partners in lifetime (females 18+)
Sexual Behavior - Average number of female sex partners in lifetime (females 18+)
Sexual Behavior - Circumcised males 18+ (%)
Sleep Disorders - Average hours sleeping at night
Sleep Disorders - People that has trouble sleeping (%)
Smoking-Cigarette Use - People smoking cigarettes (%)
Taste & Smell - People 40+ having problems with smell (%)
Taste & Smell - People 40+ having problems with taste (%)
Taste & Smell - People 40+ that ever had wisdom teeth removed (%)
Taste & Smell - People 40+ that ever had tonsils teeth removed (%)
Taste & Smell - People 40+ that ever had a loss of consciousness because of a head injury (%)
Taste & Smell - People 40+ that ever had a broken nose or other serious injury to face or skull (%)
Taste & Smell - People 40+ that ever had two or more sinus infections (%)
Weight - Average height (inches)
Weight - Average weight (pounds)
Weight - Average BMI
Weight - People that are obese (%)
Weight - People that ever were obese (%)
Weight - People trying to lose weight (%)
Urban population: 39,710
Rural population: 433
Estimated median house/condo value in 2022: $489,354
46033:
$489,354Indiana:
$208,700
Median resident age: This zip code:
42.1 yearsIndiana median age:
38.2 years
Average household size: This zip code:
2.7 peopleIndiana:
2.4 people
Averages for the 2020 tax year for zip code 46033, filed in 2021:
Average Adjusted Gross Income (AGI) in 2020: $165,141 (Individual Income Tax Returns) Here:
$165,141State:
$64,978
Salary/wage: $125,091 (reported on 81.9% of returns )Here:
$125,091State:
$55,245
(% of AGI for various income ranges: 1119.2% for AGIs below $25k , 3596.5% for AGIs $25k-50k , 6224.5% for AGIs $50k-75k , 9073.2% for AGIs $75k-100k , 18944.2% for AGIs $100k-200k , 88668.3% for AGIs over 200k ) Taxable interest for individuals: $2,657 (reported on 50.3% of returns )This zip code:
$2,657Indiana:
$1,351
(% of AGI for various income ranges: 21.4% for AGIs below $25k , 53.3% for AGIs $25k-50k , 79.0% for AGIs $50k-75k , 112.8% for AGIs $75k-100k , 175.4% for AGIs $100k-200k , 1295.1% for AGIs over 200k ) Ordinary dividends: $11,017 (reported on 45.0% of returns )(% of AGI for various income ranges: 73.6% for AGIs below $25k , 146.5% for AGIs $25k-50k , 292.0% for AGIs $50k-75k , 456.0% for AGIs $75k-100k , 708.3% for AGIs $100k-200k , 4728.3% for AGIs over 200k ) Net capital gain/loss in AGI: +$42,342 (reported on 41.6% of returns )Here:
+$42,342State:
+$17,730
(% of AGI for various income ranges: 51.6% for AGIs below $25k , 148.1% for AGIs $25k-50k , 211.7% for AGIs $50k-75k , 368.8% for AGIs $75k-100k , 759.0% for AGIs $100k-200k , 23183.1% for AGIs over 200k ) Profit/loss from business: +$26,381 (reported on 18.6% of returns )Here:
+$26,381State:
+$12,144
(% of AGI for various income ranges: 114.3% for AGIs below $25k , 293.5% for AGIs $25k-50k , 303.2% for AGIs $50k-75k , 395.6% for AGIs $75k-100k , 825.3% for AGIs $100k-200k , 4173.3% for AGIs over 200k ) Taxable individual retirement arrangement distribution: $33,823 (reported on 15.0% of returns )46033:
$33,823Indiana:
$18,302
(% of AGI for various income ranges: 77.9% for AGIs below $25k , 260.9% for AGIs $25k-50k , 472.8% for AGIs $50k-75k , 770.5% for AGIs $75k-100k , 1290.1% for AGIs $100k-200k , 3108.1% for AGIs over 200k ) Self-employed (Keogh) retirement plans: $28,088 (reported on 2.3% of returns )46033:
$28,088Indiana:
$27,160
(% of AGI for various income ranges: 29.7% for AGIs $50k-75k , 45.5% for AGIs $100k-200k , 803.2% for AGIs over 200k ) Total itemized deductions: $40,034 (reported on 18.1% of returns )Here:
$40,034State:
$35,601
(% of AGI for various income ranges: 99.1% for AGIs below $25k , 225.2% for AGIs $25k-50k , 466.2% for AGIs $50k-75k , 659.0% for AGIs $75k-100k , 1160.6% for AGIs $100k-200k , 6599.6% for AGIs over 200k ) Charity contributions: $18,476 (reported on 16.0% of returns )Here:
$18,476State:
$15,596
(% of AGI for various income ranges: 4.7% for AGIs below $25k , 26.7% for AGIs $25k-50k , 81.2% for AGIs $50k-75k , 144.4% for AGIs $75k-100k , 319.6% for AGIs $100k-200k , 3376.7% for AGIs over 200k ) Taxes paid: $8,934 (reported on 18.0% of returns )(% of AGI for various income ranges: 12.8% for AGIs below $25k , 42.9% for AGIs $25k-50k , 102.2% for AGIs $50k-75k , 162.9% for AGIs $75k-100k , 330.3% for AGIs $100k-200k , 1328.7% for AGIs over 200k ) Earned income credit: $1,832 (reported on 4.0% of returns )(% of AGI for various income ranges: 32.4% for AGIs below $25k , 35.4% for AGIs $25k-50k , 0.9% for AGIs $50k-75k ) Percentage of individuals using paid preparers for their 2020 taxes: 92.4%(% for various income ranges: 90.3% for AGIs below $25k , 92.2% for AGIs $25k-50k , 91.5% for AGIs $50k-75k , 91.5% for AGIs $75k-100k , 93.5% for AGIs $100k-200k , 94.0% for AGIs over 200k )
Averages for the 2012 tax year for zip code 46033, filed in 2013:
Average Adjusted Gross Income (AGI) in 2012: $132,107 (Individual Income Tax Returns) Here:
$132,107State:
$52,932
Salary/wage: $103,481 (reported on 85.3% of returns )Here:
$103,481State:
$45,173
(% of AGI for various income ranges: 75.2% for AGIs below $25k , 70.9% for AGIs $25k-50k , 66.7% for AGIs $50k-75k , 72.0% for AGIs $75k-100k , 77.4% for AGIs $100k-200k , 60.2% for AGIs over 200k ) Taxable interest for individuals: $2,125 (reported on 53.5% of returns )This zip code:
$2,125Indiana:
$1,311
(% of AGI for various income ranges: 1.8% for AGIs below $25k , 1.3% for AGIs $25k-50k , 1.4% for AGIs $50k-75k , 0.7% for AGIs $75k-100k , 0.6% for AGIs $100k-200k , 0.9% for AGIs over 200k ) Ordinary dividends: $8,507 (reported on 45.3% of returns )(% of AGI for various income ranges: 5.4% for AGIs below $25k , 3.0% for AGIs $25k-50k , 3.3% for AGIs $50k-75k , 2.5% for AGIs $75k-100k , 2.0% for AGIs $100k-200k , 3.3% for AGIs over 200k ) Net capital gain/loss in AGI: +$20,538 (reported on 39.3% of returns )Here:
+$20,538State:
+$10,406
(% of AGI for various income ranges: 0.3% for AGIs below $25k , 0.6% for AGIs $25k-50k , 1.0% for AGIs $50k-75k , 0.9% for AGIs $75k-100k , 1.5% for AGIs $100k-200k , 10.0% for AGIs over 200k ) Profit/loss from business: +$23,968 (reported on 18.7% of returns )Here:
+$23,968State:
+$11,105
(% of AGI for various income ranges: 6.3% for AGIs below $25k , 6.4% for AGIs $25k-50k , 4.6% for AGIs $50k-75k , 3.3% for AGIs $75k-100k , 3.5% for AGIs $100k-200k , 3.0% for AGIs over 200k ) Taxable individual retirement arrangement distribution: $25,647 (reported on 15.8% of returns )46033:
$25,647Indiana:
$13,841
(% of AGI for various income ranges: 5.0% for AGIs below $25k , 5.7% for AGIs $25k-50k , 5.5% for AGIs $50k-75k , 5.8% for AGIs $75k-100k , 3.6% for AGIs $100k-200k , 2.0% for AGIs over 200k ) Self-employment retirement plans: $22,661 (reported on 2.6% of returns )46033:
$22,661Indiana:
$21,482
(% of AGI for various income ranges: 0.5% for AGIs $25k-50k , 0.2% for AGIs $75k-100k , 0.3% for AGIs $100k-200k , 0.6% for AGIs over 200k ) Total itemized deductions: $30,469 (15% of AGI, reported on 58.6% of returns )Here:
$30,469State:
$20,913
Here:
15.1% of AGIState:
18.2% of AGI
(% of AGI for various income ranges: 17.2% for AGIs below $25k , 16.5% for AGIs $25k-50k , 18.4% for AGIs $50k-75k , 16.1% for AGIs $75k-100k , 15.5% for AGIs $100k-200k , 11.5% for AGIs over 200k ) Charity contributions: $6,184 (reported on 53.9% of returns )(% of AGI for various income ranges: 1.5% for AGIs below $25k , 2.0% for AGIs $25k-50k , 2.7% for AGIs $50k-75k , 2.4% for AGIs $75k-100k , 2.6% for AGIs $100k-200k , 2.6% for AGIs over 200k ) Taxes paid: $12,749 (reported on 58.4% of returns )46033:
$12,749State:
$7,456
(% of AGI for various income ranges: 3.4% for AGIs below $25k , 4.0% for AGIs $25k-50k , 5.2% for AGIs $50k-75k , 5.3% for AGIs $75k-100k , 6.1% for AGIs $100k-200k , 5.6% for AGIs over 200k ) Earned income credit: $1,719 (reported on 4.0% of returns )(% of AGI for various income ranges: 2.2% for AGIs below $25k , 0.5% for AGIs $25k-50k ) Percentage of individuals using paid preparers for their 2012 taxes: 48.6%(% for various income ranges: 38.1% for AGIs below $25k , 44.6% for AGIs $25k-50k , 50.0% for AGIs $50k-75k , 48.2% for AGIs $75k-100k , 48.9% for AGIs $100k-200k , 67.5% for AGIs over 200k )
Averages for the 2004 tax year for zip code 46033, filed in 2005:
Average Adjusted Gross Income (AGI) in 2004: $106,137 (Individual Income Tax Returns) Here:
$106,137State:
$44,790
Salary/wage: $88,851 (reported on 85.0% of returns )Here:
$88,851State:
$39,615
(% of AGI for various income ranges: 2648.8% for AGIs below $10k , 67.5% for AGIs $10k-25k , 69.8% for AGIs $25k-50k , 73.8% for AGIs $50k-75k , 80.2% for AGIs $75k-100k , 68.9% for AGIs over 100k ) Taxable interest for individuals: $2,299 (reported on 69.4% of returns )This zip code:
$2,299Indiana:
$1,535
(% of AGI for various income ranges: 170.5% for AGIs below $10k , 4.6% for AGIs $10k-25k , 2.7% for AGIs $25k-50k , 2.0% for AGIs $50k-75k , 1.3% for AGIs $75k-100k , 1.3% for AGIs over 100k ) Taxable dividends: $4,886 (reported on 54.0% of returns )(% of AGI for various income ranges: 303.1% for AGIs below $10k , 5.6% for AGIs $10k-25k , 3.5% for AGIs $25k-50k , 2.5% for AGIs $50k-75k , 1.7% for AGIs $75k-100k , 2.4% for AGIs over 100k ) Net capital gain/loss: +$11,140 (reported on 46.8% of returns )Here:
+$11,140State:
+$8,619
(% of AGI for various income ranges: -80.2% for AGIs below $10k , 1.2% for AGIs $10k-25k , 1.4% for AGIs $25k-50k , 1.2% for AGIs $50k-75k , 1.3% for AGIs $75k-100k , 6.0% for AGIs over 100k ) Profit/loss from business: +$22,200 (reported on 18.1% of returns )Here:
+$22,200State:
+$10,071
(% of AGI for various income ranges: 207.5% for AGIs below $10k , 8.2% for AGIs $10k-25k , 5.3% for AGIs $25k-50k , 4.6% for AGIs $50k-75k , 3.8% for AGIs $75k-100k , 3.5% for AGIs over 100k ) IRA payment deduction: $3,440 (reported on 4.1% of returns )46033:
$3,440Indiana:
$2,840
(% of AGI for various income ranges: 12.7% for AGIs below $10k , 0.4% for AGIs $10k-25k , 0.4% for AGIs $25k-50k , 0.3% for AGIs $50k-75k , 0.3% for AGIs $75k-100k , 0.1% for AGIs over 100k ) Self-employed pension: $17,696 (reported on 3.0% of returns )Here:
$17,696Indiana:
$15,305
(% of AGI for various income ranges: 0.2% for AGIs $25k-50k , 0.2% for AGIs $50k-75k , 0.2% for AGIs $75k-100k , 0.6% for AGIs over 100k ) Total itemized deductions: $26,008 (17% of AGI, reported on 64.0% of returns )Here:
$26,008State:
$17,065
Here:
16.9% of AGIState:
19.5% of AGI
(% of AGI for various income ranges: 399.1% for AGIs below $10k , 27.2% for AGIs $10k-25k , 25.0% for AGIs $25k-50k , 22.3% for AGIs $50k-75k , 20.5% for AGIs $75k-100k , 13.7% for AGIs over 100k ) Charity contributions deductions: $5,199 (3% of AGI, reported on 60.0% of returns )Here:
3.3% of AGIState:
3.8% of AGI
(% of AGI for various income ranges: 22.6% for AGIs below $10k , 2.3% for AGIs $10k-25k , 2.7% for AGIs $25k-50k , 3.1% for AGIs $50k-75k , 3.0% for AGIs $75k-100k , 2.9% for AGIs over 100k ) Total tax: $22,507 (reported on 83.1% of returns )46033:
$22,507State:
$6,914
(% of AGI for various income ranges: 84.9% for AGIs below $10k , 5.1% for AGIs $10k-25k , 7.3% for AGIs $25k-50k , 8.4% for AGIs $50k-75k , 9.4% for AGIs $75k-100k , 20.2% for AGIs over 100k ) Earned income credit: $1,452 (reported on 2.7% of returns )Percentage of individuals using paid preparers for their 2004 taxes: 49.4%(% for various income ranges: 42.7% for AGIs below $10k , 48.9% for AGIs $10k-25k , 50.7% for AGIs $25k-50k , 49.7% for AGIs $50k-75k , 44.3% for AGIs $75k-100k , 54.9% for AGIs over 100k )
Estimated median household income in 2022: This zip code:
$147,143Indiana:
$66,785
Nearest zip codes: 46280 ,
46038 ,
46250 ,
46240 ,
46062 ,
46290 .
Westfield Zip Code Map
Percentage of family households: This zip code:
61.5%Indiana:
46.2%
Percentage of households with unmarried partners: This zip code:
3.0%Indiana:
48.0%
Likely homosexual households (counted as self-reported same-sex unmarried-partner households)
Lesbian couples: 0.1% of all households Gay men: 0.1% of all households
Household received Food Stamps/SNAP in the past 12 months: 94Household did not receive Food Stamps/SNAP in the past 12 months: 14,680
Women who had a birth in the past 12 months: 340 (342 now married , 19 unmarried) Women who did not have a birth in the past 12 months: 8,819 (5,470 now married , 3,379 unmarried)
Housing units in zip code 46033 with a mortgage: 8,858 (1,134
second mortgage , 28
home equity loan , 1,101
both second mortgage and home equity loan )
Houses without a mortgage: 409
Median monthly owner costs for units with a mortgage: $2,285
Median monthly owner costs for units without a mortgage: $695
Residents with income below the poverty level in 2022:
This zip code:
2.6%Whole state:
12.6%
Residents with income below 50% of the poverty level in 2022:
This zip code:
1.4%Whole state:
6.3%
Median number of rooms in houses and condos: Median number of rooms in apartments: Notable locations in this zip code not listed on our city pages
Click to draw/clear zip code borders Notable locations in zip code 46033: (A) , Prairie View Country Club (B) , Brookshire Golf COurse (C) , Westfield Washington Township Fire Department Station 82 (D) , Oakhill Mansion (E) , Carmel Fire Department Station 43 (F) , Carmel Fire Department Station 44 (G) , Carmel-Clay Schools Central Administration Building (H) . Display/hide their locations on the map
Churches in zip code 46033 include: (A) , Chinese Community Church (B) , Christ Community Church (C) , First Baptist Church of Carmel (D) , Saint Elizabeth Seton Church (E) , Saint Marks United Methodist Church (F) . Display/hide their locations on the map
Cemeteries: (1) , Farley Cemetery (2) . Display/hide their locations on the map
Reservoirs: (A) , Woodland Addition Lake (B) . Display/hide their locations on the map
Creeks: (A) , Hot Lick Creek (B) , Carmel Creek (C) . Display/hide their locations on the map
Parks in zip code 46033 include: (1) , Mark Badger Park (2) , River Heritage Park (3) , Founders Park (4) , Carmel-Clay County Park (5) , Flowing Well Park (6) . Display/hide their locations on the map
Year house built (houses)
172 2020 or later2,859 2010 to 20192,402 2000 to 20093,577 1990 to 19992,643 1980 to 19892,753 1970 to 1979476 1960 to 1969119 1950 to 195995 1940 to 194991 1939 or earlier
Zip code 46033 household income distribution in 2022 242 Less than $10,00075 $10,000 to $14,99955 $15,000 to $19,999284 $20,000 to $24,999100 $25,000 to $29,99929 $30,000 to $34,999204 $35,000 to $39,999302 $40,000 to $44,999440 $45,000 to $49,999833 $50,000 to $59,9991,030 $60,000 to $74,9991,295 $75,000 to $99,9991,342 $100,000 to $124,9991,197 $125,000 to $149,9992,100 $150,000 to $199,9995,308 $200,000 or moreEstimate of home value of owner-occupied houses/condos in 2022 in zip code 46033 60 Less than $10,0008 $20,000 to $24,99910 $40,000 to $49,99923 $50,000 to $59,9998 $70,000 to $79,99912 $80,000 to $89,99964 $100,000 to $124,99913 $125,000 to $149,99964 $150,000 to $174,999114 $175,000 to $199,999676 $200,000 to $249,9991,097 $250,000 to $299,9994,331 $300,000 to $399,9994,128 $400,000 to $499,9993,670 $500,000 to $749,9991,055 $750,000 to $999,999252 $1,000,000 to $1,499,99969 $1,500,000 to $1,999,999196 $2,000,000 or moreRent paid by renters in 2022 in zip code 46033 6 $250 to $2996 $450 to $499103 $900 to $999642 $1,000 to $1,249638 $1,250 to $1,499625 $1,500 to $1,999117 $2,000 to $2,49951 $2,500 to $2,99982 No cash rent
Median gross rent in 2022: $1,507.
Median price asked for vacant for-sale houses and condos in 2022: $412,021.
Estimated median house (or condo) value in 2022 for: White Non-Hispanic householders: $486,231Black or African American householders: $543,775American Indian or Alaska Native householders: $252,929Asian householders: $545,337Two or more races householders: $437,385Hispanic or Latino householders: $742,060Estimated median house or condo value in 2022: $489,354
46033:
$489,354Indiana:
$208,700
Lower value quartile - upper value quartile: $373,292 - $656,267
Mean price in 2022: Detached houses: $547,917Here:
$547,917State:
$257,916
Townhouses or other attached units: $311,668Here:
$311,668State:
$224,114
In 3-to-4-unit structures: $266,324Here:
$266,324State:
$151,116
In 5-or-more-unit structures: $196,900Here:
$196,900State:
$200,844
Housing units in structures:
One, detached: 13,240One, attached: 388Two: 1743 or 4: 535 to 9: 45110 to 19: 53620 to 49: 7450 or more: 62Mobile homes: 6Unemployment : 1.6%
Means of transportation to work in zip code 46033 68.0% 13,999 Drove a car alone6.7% 1,379 Carpooled0.3% 63 Taxi0.1% 30 Bicycle1.6% 334 Walked0.8% 160 Other means26.0% 5,349 Worked at homeTravel time to work (commute) in zip code 46033 429 Less than 5 minutes1,494 5 to 9 minutes2,217 10 to 14 minutes2,955 15 to 19 minutes2,371 20 to 24 minutes806 25 to 29 minutes1,908 30 to 34 minutes869 35 to 39 minutes1,044 40 to 44 minutes1,344 45 to 59 minutes270 60 to 89 minutes281 90 or more minutes
Neighborhoods in zip code 46033: Percentage of zip code residents living and working in this county: 59.2%
Household type by relationship:
Households: 40,144
Male householders: 7,625 (649 living alone ), Female householders: 7,178 (1,435 living alone )11,276 spouses (11,219 opposite-sex spouses ), 573 unmarried partners , (567 opposite-sex unmarried partners ), 12,703 children (12,078 natural , 367 adopted , 247 stepchildren ), 131 grandchildren , 49 brothers or sisters , 234 parents , 0 foster children , 250 other relatives , 273 non-relatives In group quarters: 75 (-1 institutionalized population )
Size of family households: 5,512 2-persons , 2,264 3-persons , 3,100 4-persons , 906 5-persons , 266 6-persons , 96 7-or-more-persons
Size of nonfamily households: 2,087 1-person , 438 2-persons , 60 3-persons , 13 4-persons
9,459 married couples with children. single-parent households (143 men , 604 women ).
86.1% of residents of 46033 zip code speak English at home. of residents speak Spanish at home (65% very well, 31% well, 2% not well, 2% not at all ).of residents speak other Indo-European language at home (88% very well, 10% well, 2% not well ).of residents speak Asian or Pacific Island language at home (72% very well, 20% well, 7% not well ).of residents speak other language at home (38% very well, 31% well, 31% not well ).
Foreign born population: 4,982 (12.4%)
(59.6%
of them are naturalized citizens )
This zip code:
12.4%Whole state:
6.1%
15% Bhutan 9% Algeria 6% Honduras 5% Sweden 4% Hong Kong 3% Uruguay 3% United Kingdom, excluding England and Scotland 18% German 14% English 10% American 6% European 5% Irish 2% Polish 2% Egyptian
Year of entry for the foreign-born population
2,010 2010 or later 1,103 2000 to 2009 1,225 1990 to 1999 1,009 Before 1990
There are
102 Medical Specialists in Zip Code 46033 .
Facilities with environmental interests located in this zip code:
CHERRY TREE ELEMENTARY SCHOOL (13989 HAZEL DELL RD in CARMEL, IN)
STATE MASTER (Indiana facility tracking) - CRTK-8627, EPCRA (National Center for Education Statistics) - STATE ID-2508 Organizations: CARMEL CLAY SCHOOLS (SCHOOL DISTRICT)
PRAIRIE TRACE ELEMENTARY SCH (14200 N RIVER RD in CARMEL, IN)
(National Center for Education Statistics) - STATE ID-2515 Organizations: CARMEL CLAY SCHOOLS (SCHOOL DISTRICT)
MOHAWK TRAILS ELEMENTARY SCH (4242 E 126TH ST in CARMEL, IN)
(National Center for Education Statistics) - STATE ID-2516 Organizations: CARMEL CLAY SCHOOLS (SCHOOL DISTRICT)
AMOCO VILLAGE PARK (1850 E 151ST ST in CARMEL, IN)
STATE MASTER (Indiana facility tracking) (Resource Conservation and Recovery Act (tracking hazardous waste)) Organizations: AMOCO OIL CO (CONTACT/OWNER)
CLAY MIDDLE SCHOOL (5150 E 126TH ST in CARMEL, IN)
(Resource Conservation and Recovery Act (tracking hazardous waste)) Organizations: CARMEL CLAY SCHOOLS (CONTACT/OPERATOR)
CARMEL CLAY SCH CORP (5201 E 131ST ST in CARMEL, IN)
STATE MASTER (Indiana facility tracking) COMPLIANCE ACTIVITY (Tracking inspections of insecticide, fungicide, and rodenticide, and toxic substances) Business SIC classification: ELEMENTARY AND SECONDARY SCHOOLS
PORTRAIT INNOVATIONS (2436 3 146TH ST in CARMEL, IN)
Small Quantity Generators, between 100 kg and 1000 kg of hazardous waste/month (Resource Conservation and Recovery Act (tracking hazardous waste))
LOWES COMPANIES #1525 (14598 LOWES WAY in CARMEL, IN)
Conditionally Exempt Small Quantity Generators, less than 100 kg/month of hazardous waste (Resource Conservation and Recovery Act (tracking hazardous waste)) Business NAICS classification: HOME AND GARDEN EQUIPMENT REPAIR AND MAINTENANCE.
NU WAY CLEANERS INC (1950 E GREYHOUND PASS in CARMEL, IN)
STATE MASTER (Indiana facility tracking) Small Quantity Generators, between 100 kg and 1000 kg of hazardous waste/month (Resource Conservation and Recovery Act (tracking hazardous waste)) - notification Organizations: JASH PATEL (CONTACT/OWNER)
Alternative names: NU WAY CLNRS DBA VILLAGE PK INVEST LLC
CARMEL WASTEWATER TREATMENT PLANT (9609 HAZELL DELL PARKWAY in CARMEL, IN)
ENFORCEMENT/COMPLIANCE ACTIVITY (Integrated Compliance Information System)
Housing units lacking complete plumbing facilities: 0.8%
Housing units lacking complete kitchen facilities: 1.1%
72.0% Utility gas 27.7% Electricity
Place of birth for U.S.-born residents:
This state: 20,498Northeast: 2,662Midwest: 7,972South: 2,792West: 1,130
49% of the 46033 zip code residents lived in the same house 5 years ago.
Out of people who lived in different houses, 34% lived in this county.
Out of people who lived in different counties, 50% lived in Indiana.
92% of the 46033 zip code residents lived in the same house 1 year ago.
Out of people who lived in different houses, 33% moved from this county.
Out of people who lived in different houses, 40% moved from different county within same state.
Out of people who lived in different houses, 28% moved from different state.
Out of people who lived in different houses, 4% moved from abroad.
Private vs. public school enrollment:
Students in private schools in grades 1 to 8 (elementary and middle school): 616
Students in private schools in grades 9 to 12 (high school): 542
Students in private undergraduate colleges: 235
Occupation by median earnings in the past 12 months ($)
142,610 Life, physical, and social science occupations 133,314 Management occupations 116,594 Architecture and engineering occupations 114,292 Legal occupations 113,911 Health diagnosing and treating practitioners and other technical occupations 107,780 Business and financial operations occupations
Companies with federal contracts located in this zip code:
PPMA, LLC (1333 WOODGATE DR in CARMEL, IN; small business) in 2 contracts in 2005
$69,578 with Army for Defense Tank - Automotive -- Basic Research (R&D). Signed on 2005-11-16. Completion date: 2006-04-29.
, same as above. Signed on 2005-11-16. Completion date: 2006-05-31.
BLUEBEAN, LLC (5636 OTTAWA PASS in CARMEL, IN; small business)
$67,855 with Navy for Conveyors. Taking place in WA. Signed on 2005-09-28. Completion date: 2005-12-06.
1ST AMERICAN VETERANS ALLIANCE (14226 CHERRY TREE RD in CARMEL, IN; small business)
$24,640 with Army for Cameras, Motion Picture. Signed on 2006-01-27. Completion date: 2006-02-09.
Top industries in this zip code by the number of employees in 2005:
Other Services (except Public Administration): Religious Organizations (50-99 employees: 2 establishments, 20-49 employees: 2 establishments, 10-19 employees: 2 establishments, 5-9 employees: 2 establishments, 1-4 employees: 5 establishments)Accommodation and Food Services: Drinking Places (Alcoholic Beverages) (100-249: 1)Accommodation and Food Services: Full-Service Restaurants (50-99: 1, 20-49: 1, 5-9: 2, 1-4: 2)Health Care and Social Assistance: Offices of Physical, Occupational and Speech Therapists, and Audiologists (50-99: 1, 20-49: 1, 1-4: 2)Health Care and Social Assistance: Offices of Physicians (except Mental Health Specialists) (20-49: 1, 10-19: 2, 5-9: 1, 1-4: 13)Administrative and Support and Waste Management and Remediation Services: Landscaping Services (20-49: 2, 5-9: 1, 1-4: 6)
People in group quarters in 2010:
32 people in nursing facilities/skilled-nursing facilities
8 people in residential treatment centers for adults
7 people in group homes intended for adults
People in group quarters in 2000:
44 people in homes or halfway houses for drug/alcohol abuse
34 people in nursing homes
23 people in homes for the mentally ill
Fatal accident statistics in 2014:
Fatal accident count: 1Vehicles involved in fatal accidents: 1Fatal accidents caused by drunken drivers: 1Fatalities: 1Persons involved in fatal accidents: 1Pedestrians involved in fatal accidents: 0
Fatal accident statistics in 2013:
Fatal accident count: 1Vehicles involved in fatal accidents: 1Fatal accidents caused by drunken drivers: 1Fatalities: 1Persons involved in fatal accidents: 1Pedestrians involved in fatal accidents: 0
Home Mortgage Disclosure Act Aggregated Statistics For Year 2009(Based on 6 full and 2 partial tracts) A) FHA, FSA/RHS & VA B) Conventional C) Refinancings D) Home Improvement Loans E) Loans on Dwellings For 5+ Families F) Non-occupant Loans on G) Loans On Manufactured Number Average Value Number Average Value Number Average Value Number Average Value Number Average Value Number Average Value Number Average Value
LOANS ORIGINATED 174 $213,648 692 $249,141 3,702 $225,767 55 $123,768 2 $318,530 64 $167,683 4 $231,928 APPLICATIONS APPROVED, NOT ACCEPTED 8 $205,052 56 $221,140 228 $226,869 22 $70,740 0 $0 4 $362,325 0 $0 APPLICATIONS DENIED 14 $229,511 58 $247,486 557 $252,297 28 $54,351 0 $0 16 $182,690 0 $0 APPLICATIONS WITHDRAWN 18 $206,543 44 $265,929 507 $221,492 18 $193,777 0 $0 20 $175,798 0 $0 FILES CLOSED FOR INCOMPLETENESS 4 $204,992 6 $167,558 115 $245,024 0 $0 0 $0 2 $285,680 0 $0
Aggregated Statistics For Year 2008(Based on 6 full and 2 partial tracts) A) FHA, FSA/RHS & VA B) Conventional C) Refinancings D) Home Improvement Loans F) Non-occupant Loans on Number Average Value Number Average Value Number Average Value Number Average Value Number Average Value
LOANS ORIGINATED 105 $206,125 846 $246,879 1,323 $244,390 105 $55,273 73 $222,783 APPLICATIONS APPROVED, NOT ACCEPTED 8 $196,048 51 $300,036 111 $227,805 34 $40,631 2 $144,335 APPLICATIONS DENIED 18 $188,933 96 $255,822 362 $253,061 63 $44,994 12 $204,614 APPLICATIONS WITHDRAWN 12 $164,566 64 $275,824 243 $227,509 14 $80,934 6 $230,230 FILES CLOSED FOR INCOMPLETENESS 0 $0 22 $288,796 44 $257,839 8 $110,798 2 $358,345
Aggregated Statistics For Year 2007(Based on 6 full and 2 partial tracts) A) FHA, FSA/RHS & VA B) Conventional C) Refinancings D) Home Improvement Loans F) Non-occupant Loans on Number Average Value Number Average Value Number Average Value Number Average Value Number Average Value
LOANS ORIGINATED 28 $222,775 1,280 $224,610 1,156 $222,682 123 $85,746 87 $200,709 APPLICATIONS APPROVED, NOT ACCEPTED 2 $127,410 133 $230,609 146 $235,985 26 $32,942 16 $253,048 APPLICATIONS DENIED 2 $264,895 107 $219,153 492 $249,471 69 $115,483 28 $198,757 APPLICATIONS WITHDRAWN 2 $404,840 107 $249,657 178 $240,643 24 $191,233 10 $197,988 FILES CLOSED FOR INCOMPLETENESS 0 $0 32 $222,977 45 $234,953 8 $522,322 6 $159,092
Aggregated Statistics For Year 2006(Based on 6 full and 2 partial tracts) A) FHA, FSA/RHS & VA B) Conventional C) Refinancings D) Home Improvement Loans F) Non-occupant Loans on Number Average Value Number Average Value Number Average Value Number Average Value Number Average Value
LOANS ORIGINATED 26 $209,976 1,539 $217,414 1,096 $216,527 180 $74,223 99 $211,386 APPLICATIONS APPROVED, NOT ACCEPTED 0 $0 161 $206,902 164 $184,523 26 $55,127 10 $147,717 APPLICATIONS DENIED 0 $0 140 $219,200 498 $274,423 75 $61,230 22 $150,304 APPLICATIONS WITHDRAWN 4 $184,390 130 $242,551 331 $211,423 30 $78,385 12 $196,894 FILES CLOSED FOR INCOMPLETENESS 2 $182,635 34 $196,243 145 $263,493 10 $167,625 2 $167,225
Aggregated Statistics For Year 2005(Based on 6 full and 2 partial tracts) A) FHA, FSA/RHS & VA B) Conventional C) Refinancings D) Home Improvement Loans E) Loans on Dwellings For 5+ Families F) Non-occupant Loans on G) Loans On Manufactured Number Average Value Number Average Value Number Average Value Number Average Value Number Average Value Number Average Value Number Average Value
LOANS ORIGINATED 20 $186,374 1,723 $226,476 1,665 $220,572 218 $81,918 0 $0 121 $174,781 2 $20,960 APPLICATIONS APPROVED, NOT ACCEPTED 2 $167,665 131 $270,926 188 $212,883 38 $56,086 2 $16,478,845 12 $249,077 0 $0 APPLICATIONS DENIED 0 $0 170 $229,243 478 $235,116 74 $66,561 2 $226,950 38 $175,034 4 $13,470 APPLICATIONS WITHDRAWN 6 $206,692 154 $238,238 339 $242,746 38 $100,058 0 $0 30 $260,328 0 $0 FILES CLOSED FOR INCOMPLETENESS 0 $0 71 $187,266 223 $236,638 10 $43,839 0 $0 10 $165,635 0 $0
Aggregated Statistics For Year 2004(Based on 6 full and 2 partial tracts) A) FHA, FSA/RHS & VA B) Conventional C) Refinancings D) Home Improvement Loans E) Loans on Dwellings For 5+ Families F) Non-occupant Loans on Number Average Value Number Average Value Number Average Value Number Average Value Number Average Value Number Average Value
LOANS ORIGINATED 28 $156,512 1,789 $230,859 2,170 $218,503 162 $74,606 2 $437,975 138 $174,923 APPLICATIONS APPROVED, NOT ACCEPTED 0 $0 145 $242,150 218 $204,871 26 $84,328 0 $0 14 $201,539 APPLICATIONS DENIED 4 $245,278 167 $247,360 466 $225,634 67 $79,745 0 $0 24 $207,744 APPLICATIONS WITHDRAWN 0 $0 149 $246,253 260 $234,521 16 $156,803 0 $0 8 $254,814 FILES CLOSED FOR INCOMPLETENESS 0 $0 42 $208,103 142 $261,825 6 $43,518 0 $0 10 $221,532
Aggregated Statistics For Year 2003(Based on 6 full and 2 partial tracts) A) FHA, FSA/RHS & VA B) Conventional C) Refinancings D) Home Improvement Loans E) Loans on Dwellings For 5+ Families F) Non-occupant Loans on Number Average Value Number Average Value Number Average Value Number Average Value Number Average Value Number Average Value
LOANS ORIGINATED 61 $159,862 1,756 $233,457 7,232 $201,579 95 $42,747 4 $354,362 153 $173,054 APPLICATIONS APPROVED, NOT ACCEPTED 4 $157,995 109 $229,630 524 $186,924 38 $17,872 0 $0 12 $159,264 APPLICATIONS DENIED 2 $106,510 81 $198,124 682 $204,563 83 $48,804 0 $0 22 $190,936 APPLICATIONS WITHDRAWN 0 $0 115 $248,683 579 $204,352 6 $45,068 0 $0 18 $195,013 FILES CLOSED FOR INCOMPLETENESS 2 $115,465 40 $199,136 168 $228,342 16 $58,030 0 $0 4 $207,150
Aggregated Statistics For Year 2002(Based on 6 full and 2 partial tracts) A) FHA, FSA/RHS & VA B) Conventional C) Refinancings D) Home Improvement Loans F) Non-occupant Loans on Number Average Value Number Average Value Number Average Value Number Average Value Number Average Value
LOANS ORIGINATED 81 $148,807 1,663 $215,716 5,389 $202,472 121 $39,076 125 $147,701 APPLICATIONS APPROVED, NOT ACCEPTED 6 $141,487 117 $230,286 398 $211,035 40 $25,833 10 $101,652 APPLICATIONS DENIED 12 $134,377 75 $196,971 378 $191,391 26 $49,425 14 $157,349 APPLICATIONS WITHDRAWN 0 $0 130 $208,200 370 $207,105 18 $28,566 14 $255,622 FILES CLOSED FOR INCOMPLETENESS 2 $161,935 44 $170,879 230 $190,096 2 $29,860 12 $136,476
Aggregated Statistics For Year 2001(Based on 6 full and 2 partial tracts) A) FHA, FSA/RHS & VA B) Conventional C) Refinancings D) Home Improvement Loans F) Non-occupant Loans on Number Average Value Number Average Value Number Average Value Number Average Value Number Average Value
LOANS ORIGINATED 145 $159,157 1,931 $201,993 3,543 $192,042 135 $36,862 77 $169,083 APPLICATIONS APPROVED, NOT ACCEPTED 0 $0 160 $189,111 280 $153,113 55 $28,575 4 $79,895 APPLICATIONS DENIED 6 $138,872 64 $209,985 409 $171,196 40 $37,684 14 $181,700 APPLICATIONS WITHDRAWN 12 $191,276 139 $195,713 286 $170,575 10 $18,999 20 $181,630 FILES CLOSED FOR INCOMPLETENESS 6 $299,667 14 $329,009 107 $197,745 6 $28,867 0 $0
Aggregated Statistics For Year 2000(Based on 6 full and 2 partial tracts) A) FHA, FSA/RHS & VA B) Conventional C) Refinancings D) Home Improvement Loans F) Non-occupant Loans on Number Average Value Number Average Value Number Average Value Number Average Value Number Average Value
LOANS ORIGINATED 81 $153,700 1,951 $206,468 637 $174,642 216 $41,758 71 $135,233 APPLICATIONS APPROVED, NOT ACCEPTED 2 $113,475 121 $220,957 107 $151,258 61 $42,290 8 $140,849 APPLICATIONS DENIED 8 $161,006 101 $204,770 164 $173,675 52 $33,146 2 $269,460 APPLICATIONS WITHDRAWN 12 $149,113 105 $190,676 121 $165,190 10 $47,647 4 $213,180 FILES CLOSED FOR INCOMPLETENESS 0 $0 18 $169,208 44 $213,287 0 $0 0 $0
Aggregated Statistics For Year 1999(Based on 3 full and 1 partial tracts) A) FHA, FSA/RHS & VA B) Conventional C) Refinancings D) Home Improvement Loans E) Loans on Dwellings For 5+ Families F) Non-occupant Loans on Number Average Value Number Average Value Number Average Value Number Average Value Number Average Value Number Average Value
LOANS ORIGINATED 48 $133,702 926 $199,085 527 $168,115 81 $40,748 1 $163,500 25 $138,266 APPLICATIONS APPROVED, NOT ACCEPTED 3 $141,700 51 $185,952 83 $171,470 14 $15,356 0 $0 3 $182,067 APPLICATIONS DENIED 4 $127,695 44 $205,891 111 $151,080 29 $30,143 0 $0 6 $147,900 APPLICATIONS WITHDRAWN 1 $146,650 71 $171,769 93 $150,184 10 $95,670 0 $0 7 $155,283 FILES CLOSED FOR INCOMPLETENESS 1 $138,960 12 $136,476 35 $157,885 0 $0 0 $0 0 $0
Detailed HMDA statistics for the following Tracts:
1109.01
,
1110.03 ,
1110.04 ,
1111.01
Private Mortgage Insurance Companies Aggregated Statistics For Year 2009(Based on 6 full and 2 partial tracts) A) Conventional B) Refinancings Number Average Value Number Average Value
LOANS ORIGINATED 153 $280,601 152 $269,584 APPLICATIONS APPROVED, NOT ACCEPTED 32 $259,233 40 $271,130 APPLICATIONS DENIED 16 $253,827 24 $272,120 APPLICATIONS WITHDRAWN 14 $255,989 16 $272,901 FILES CLOSED FOR INCOMPLETENESS 0 $0 0 $0
Aggregated Statistics For Year 2008(Based on 6 full and 2 partial tracts) A) Conventional B) Refinancings C) Non-occupant Loans on Number Average Value Number Average Value Number Average Value
LOANS ORIGINATED 211 $256,046 109 $270,509 10 $271,024 APPLICATIONS APPROVED, NOT ACCEPTED 50 $308,958 47 $287,777 8 $205,172 APPLICATIONS DENIED 12 $294,552 10 $283,123 2 $360,335 APPLICATIONS WITHDRAWN 6 $311,560 0 $0 0 $0 FILES CLOSED FOR INCOMPLETENESS 0 $0 0 $0 0 $0
Aggregated Statistics For Year 2007(Based on 6 full and 2 partial tracts) A) Conventional B) Refinancings C) Non-occupant Loans on Number Average Value Number Average Value Number Average Value
LOANS ORIGINATED 200 $256,754 73 $262,510 14 $207,083 APPLICATIONS APPROVED, NOT ACCEPTED 33 $259,316 24 $285,948 6 $264,107 APPLICATIONS DENIED 4 $194,102 4 $504,042 4 $241,882 APPLICATIONS WITHDRAWN 14 $202,993 12 $299,239 2 $215,005 FILES CLOSED FOR INCOMPLETENESS 0 $0 0 $0 0 $0
Aggregated Statistics For Year 2006(Based on 6 full and 2 partial tracts) A) Conventional B) Refinancings C) Non-occupant Loans on Number Average Value Number Average Value Number Average Value
LOANS ORIGINATED 146 $251,389 49 $251,093 16 $248,299 APPLICATIONS APPROVED, NOT ACCEPTED 36 $222,235 16 $296,133 0 $0 APPLICATIONS DENIED 0 $0 0 $0 0 $0 APPLICATIONS WITHDRAWN 8 $183,779 8 $246,722 2 $232,925 FILES CLOSED FOR INCOMPLETENESS 0 $0 2 $221,975 0 $0
Aggregated Statistics For Year 2005(Based on 6 full and 2 partial tracts) A) Conventional B) Refinancings C) Non-occupant Loans on Number Average Value Number Average Value Number Average Value
LOANS ORIGINATED 135 $233,551 63 $220,262 14 $181,023 APPLICATIONS APPROVED, NOT ACCEPTED 22 $227,664 20 $212,672 4 $140,935 APPLICATIONS DENIED 0 $0 2 $218,990 0 $0 APPLICATIONS WITHDRAWN 8 $193,531 10 $324,361 0 $0 FILES CLOSED FOR INCOMPLETENESS 0 $0 6 $223,987 2 $195,100
Aggregated Statistics For Year 2004(Based on 6 full and 2 partial tracts) A) Conventional B) Refinancings C) Non-occupant Loans on Number Average Value Number Average Value Number Average Value
LOANS ORIGINATED 211 $225,449 102 $222,419 36 $176,195 APPLICATIONS APPROVED, NOT ACCEPTED 36 $248,941 28 $239,745 4 $187,885 APPLICATIONS DENIED 2 $1,134,755 2 $1,134,755 0 $0 APPLICATIONS WITHDRAWN 4 $368,682 10 $201,512 4 $175,572 FILES CLOSED FOR INCOMPLETENESS 0 $0 4 $233,045 0 $0
Aggregated Statistics For Year 2003(Based on 6 full and 2 partial tracts) A) Conventional B) Refinancings C) Non-occupant Loans on Number Average Value Number Average Value Number Average Value
LOANS ORIGINATED 278 $242,169 435 $212,002 18 $165,470 APPLICATIONS APPROVED, NOT ACCEPTED 48 $254,903 95 $198,605 4 $160,260 APPLICATIONS DENIED 2 $327,485 0 $0 0 $0 APPLICATIONS WITHDRAWN 14 $216,541 36 $214,441 4 $136,012 FILES CLOSED FOR INCOMPLETENESS 0 $0 2 $304,590 0 $0
Aggregated Statistics For Year 2002(Based on 6 full and 2 partial tracts) A) Conventional B) Refinancings C) Non-occupant Loans on Number Average Value Number Average Value Number Average Value
LOANS ORIGINATED 325 $216,805 365 $207,563 18 $139,109 APPLICATIONS APPROVED, NOT ACCEPTED 44 $243,285 73 $199,426 6 $82,007 APPLICATIONS DENIED 4 $217,640 6 $196,467 0 $0 APPLICATIONS WITHDRAWN 18 $292,444 14 $204,199 2 $210,030 FILES CLOSED FOR INCOMPLETENESS 2 $165,125 4 $246,270 0 $0
Aggregated Statistics For Year 2001(Based on 6 full and 2 partial tracts) A) Conventional B) Refinancings C) Non-occupant Loans on Number Average Value Number Average Value Number Average Value
LOANS ORIGINATED 496 $214,499 279 $206,892 12 $112,088 APPLICATIONS APPROVED, NOT ACCEPTED 81 $211,215 61 $199,379 9 $107,060 APPLICATIONS DENIED 4 $185,642 12 $223,481 0 $0 APPLICATIONS WITHDRAWN 10 $245,920 16 $218,864 2 $236,905 FILES CLOSED FOR INCOMPLETENESS 0 $0 4 $224,462 0 $0
Aggregated Statistics For Year 2000(Based on 6 full and 2 partial tracts) A) Conventional B) Refinancings C) Non-occupant Loans on Number Average Value Number Average Value Number Average Value
LOANS ORIGINATED 471 $205,473 45 $188,992 8 $127,274 APPLICATIONS APPROVED, NOT ACCEPTED 54 $210,673 8 $217,311 0 $0 APPLICATIONS DENIED 8 $247,859 0 $0 0 $0 APPLICATIONS WITHDRAWN 4 $252,335 2 $100,755 0 $0 FILES CLOSED FOR INCOMPLETENESS 0 $0 0 $0 0 $0
Aggregated Statistics For Year 1999(Based on 3 full and 1 partial tracts) A) Conventional B) Refinancings C) Non-occupant Loans on Number Average Value Number Average Value Number Average Value
LOANS ORIGINATED 292 $188,902 62 $178,418 1 $135,750 APPLICATIONS APPROVED, NOT ACCEPTED 26 $206,110 15 $200,411 1 $102,990 APPLICATIONS DENIED 7 $222,969 5 $200,330 0 $0 APPLICATIONS WITHDRAWN 8 $204,556 0 $0 0 $0 FILES CLOSED FOR INCOMPLETENESS 1 $224,930 2 $221,850 0 $0
Detailed PMIC statistics for the following Tracts:
1109.01
,
1110.03 ,
1110.04 ,
1111.01
2002 - 2018 National Fire Incident Reporting System (NFIRS) incidents See full 2006 National Fire Incident Reporting System statistics for zip code 46033, Indiana
Most common first names in zip code 46033 among deceased individuals Name Count Lived (average)
Mary 68 82.8 years John 50 78.5 years Robert 48 76.2 years James 39 74.3 years William 38 75.9 years Richard 31 76.7 years Dorothy 30 84.0 years Margaret 25 80.2 years Helen 24 83.7 years Charles 22 74.5 years
Most common last names in zip code 46033 among deceased individuals Last name Count Lived (average)
Miller 17 78.7 years Smith 12 79.2 years Davis 9 81.2 years King 8 76.9 years Wilson 8 85.1 years Brown 7 77.3 years Jones 7 83.6 years Rogers 7 75.9 years Thompson 7 75.3 years Williams 7 80.6 years
Businesses in zip code 46033
Name Count Name Count
AT&T 1 MasterBrand Cabinets 1 Avenue 1 Menards 1 Bed Bath & Beyond 1 New Balance 1 Blockbuster 1 Nike 3 Buffalo Wild Wings 1 Old Country Buffet 1 Chipotle 1 Panera Bread 1 Circle K 1 Papa John's Pizza 1 Comfort Suites 1 RadioShack 1 Dunkin Donuts 1 Starbucks 2 FedEx 1 T-Mobile 1 Hobby Lobby 1 UPS 2 Kohl's 1 Verizon Wireless 2 LA Fitness 1 Victoria's Secret 1 Lane Bryant 1 Walmart 1 Lowe's 1
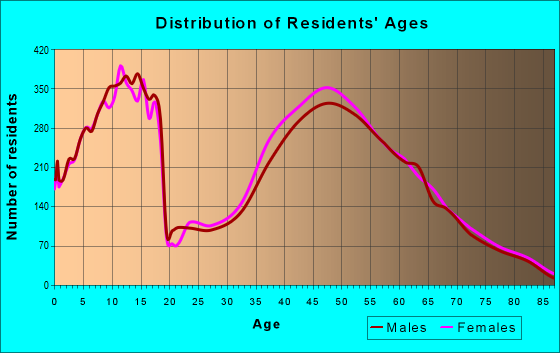
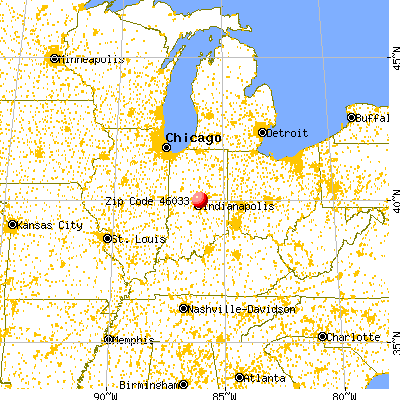


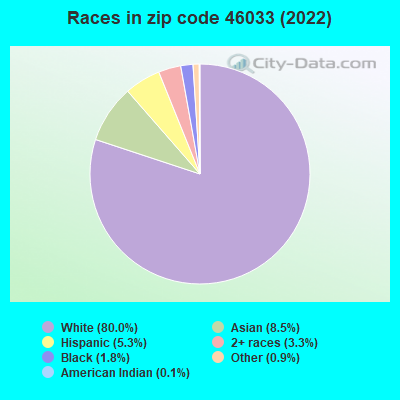


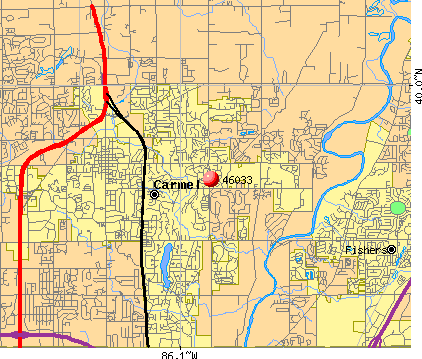 Nearest zip codes: 46280, 46038, 46250, 46240, 46062, 46290.
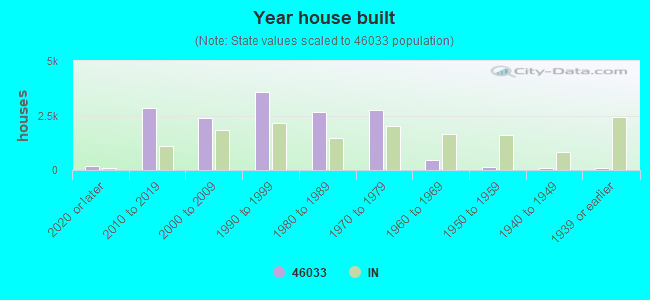

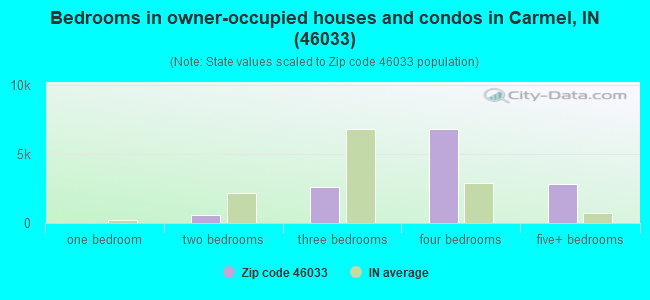
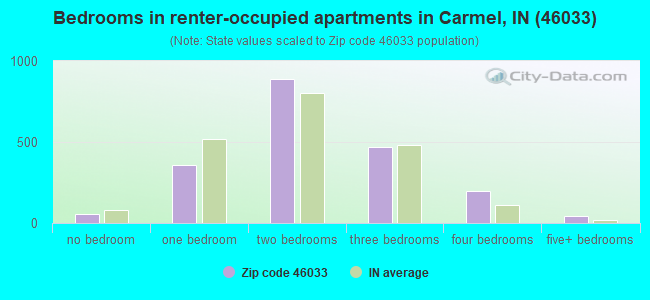
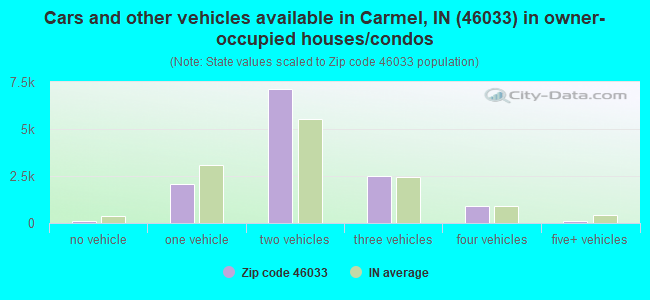
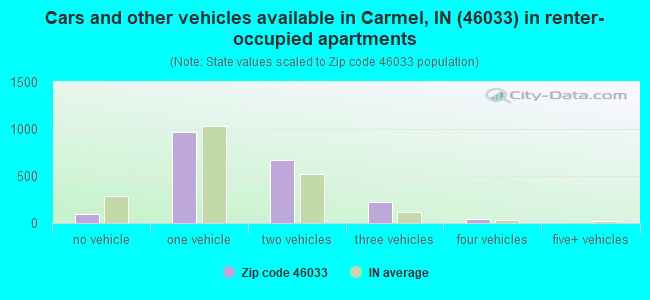


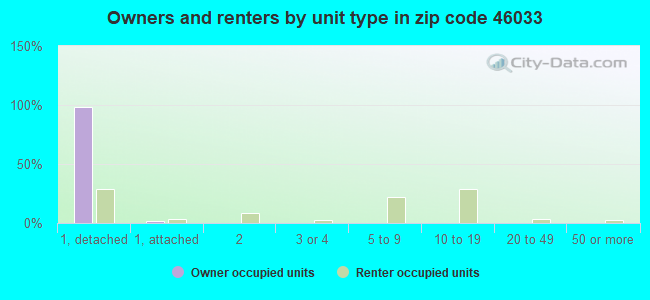
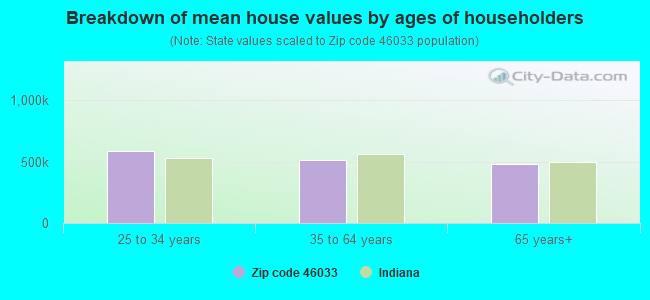


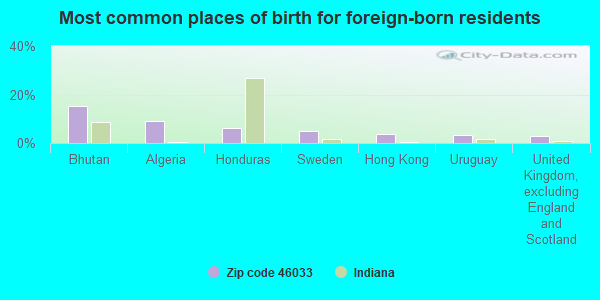
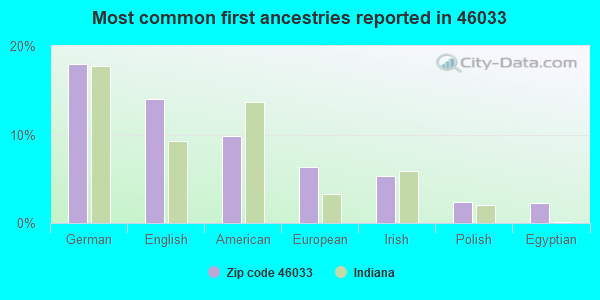
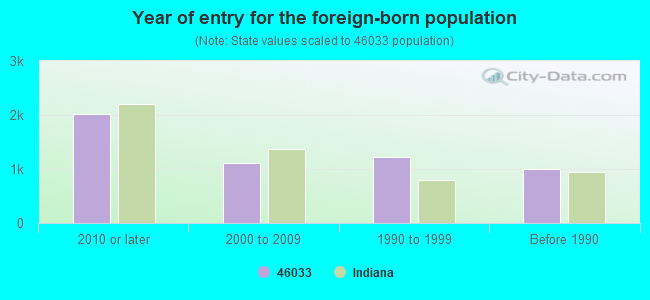


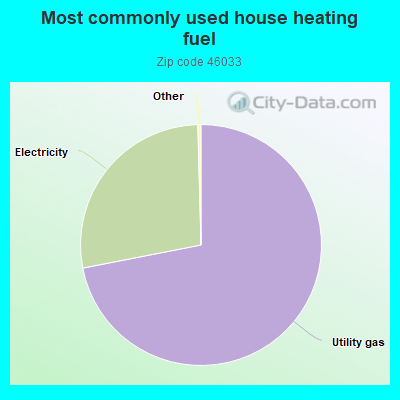
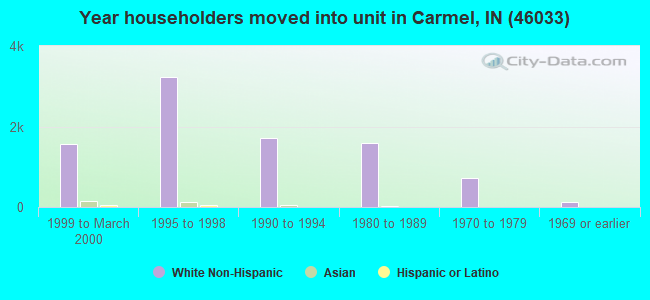
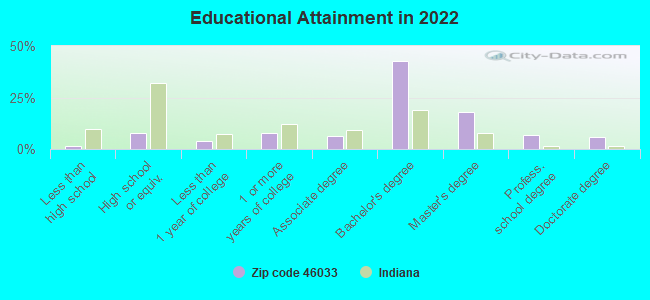
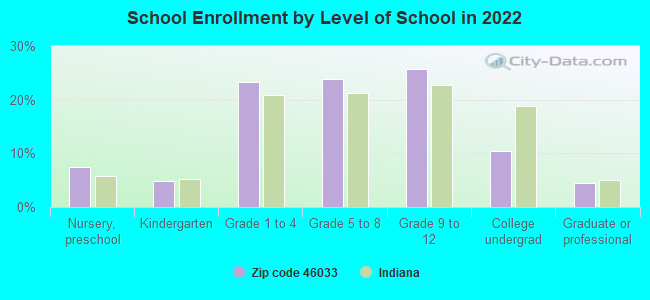
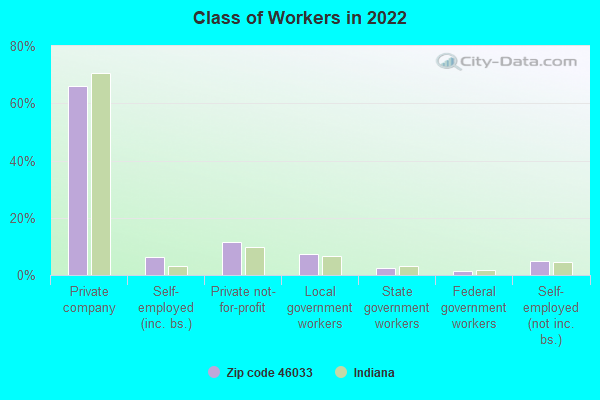
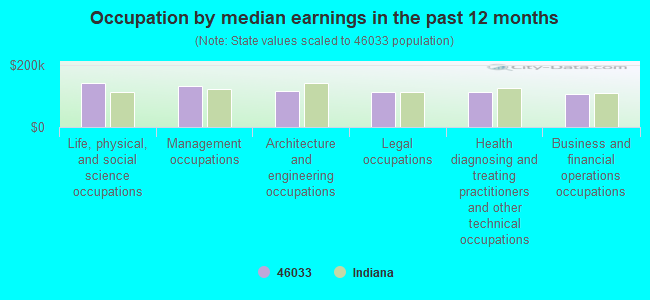
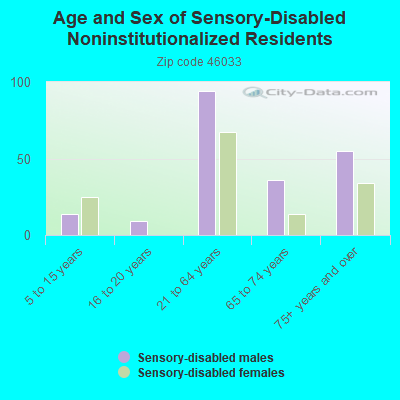
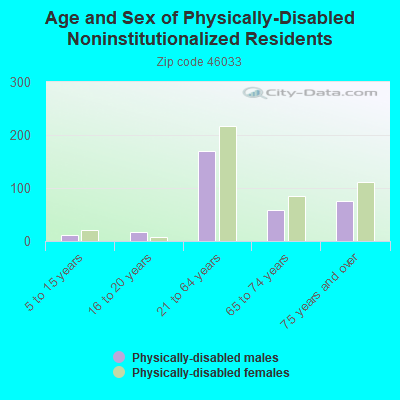
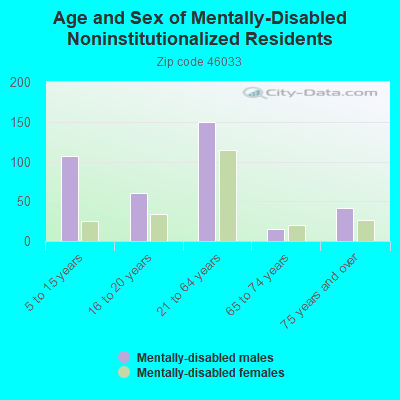


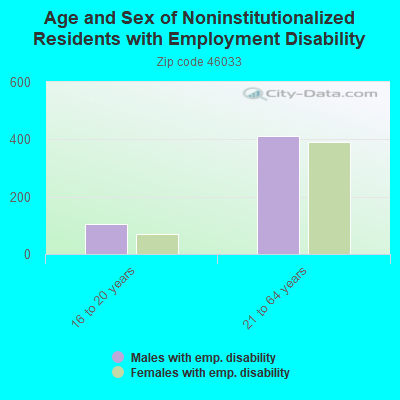
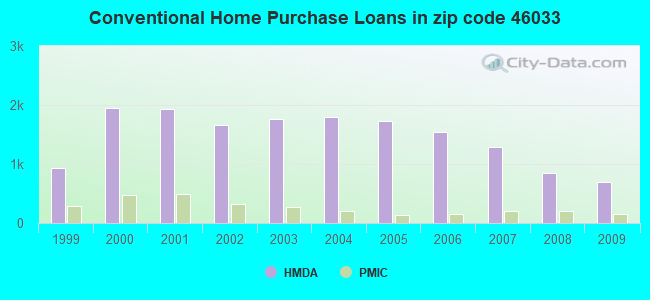
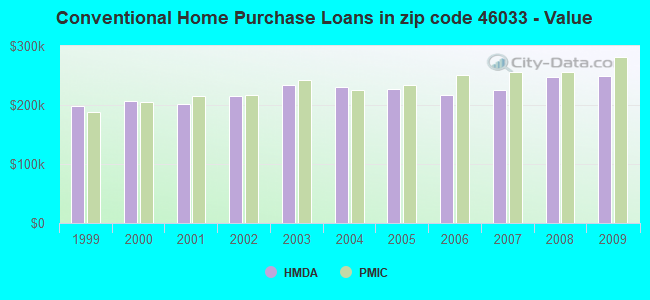
 According to the data from the years 2002 - 2018 the average number of fires per year is 27. The highest number of fire incidents - 58 took place in 2012, and the least - 4 in 2015. The data has a rising trend.
 When looking into fire subcategories, the most incidents belonged to: Structure Fires (44.0%), and Outside Fires (42.0%).