Estimated zip code population in 2022: 58,569 Zip code population in 2010: 48,555 Zip code population in 2000: 31,623
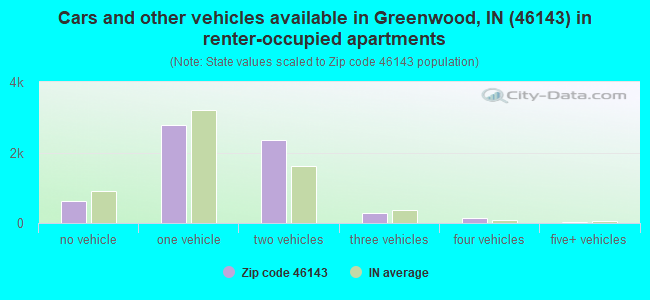
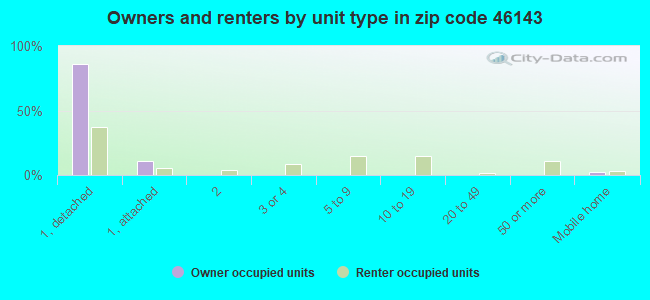
Houses and condos: 23,732 Renter-occupied apartments: 6,258
% of renters here:
27%
State:
29%
March 2022 cost of living index in zip code 46143: 89.4 (less than average, U.S. average is 100)
Land area: 48.8 sq. mi. Water area: 0.1 sq. mi.
Population density: 1,200 people per square mile
(low).
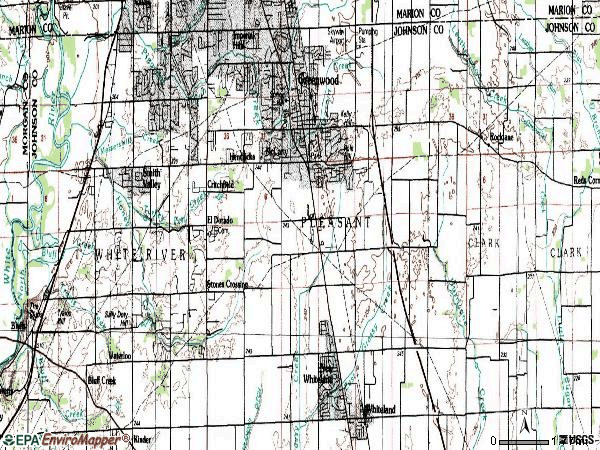
OSM Map
General Map
Google Map
MSN Map
OSM Map
General Map
Google Map
MSN Map
OSM Map
General Map
Google Map
MSN Map
OSM Map
General Map
Google Map
MSN Map
Please wait while loading the map...
Real estate property taxes paid for housing units in 2022:
This zip code:
0.6% ($1,935)
Indiana:
0.7% ($1,467)
Median real estate property taxes paid for housing units with mortgages in 2022: $1,994 (0.6%) Median real estate property taxes paid for housing units with no mortgage in 2022: $1,860 (0.7%)
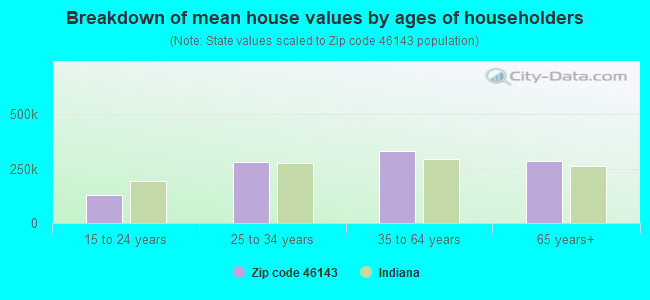
Estimated median house/condo value in 2022: $307,025
46143:
$307,025
Indiana:
$208,700
According to our research of Indiana and other state lists, there were 3 registered sex offenders living in 46143 zip code as of April 26, 2024. The ratio of all residents to sex offenders in zip code 46143 is 18,080 to 1. The ratio of registered sex offenders to all residents in this zip code is much lower than the state average.
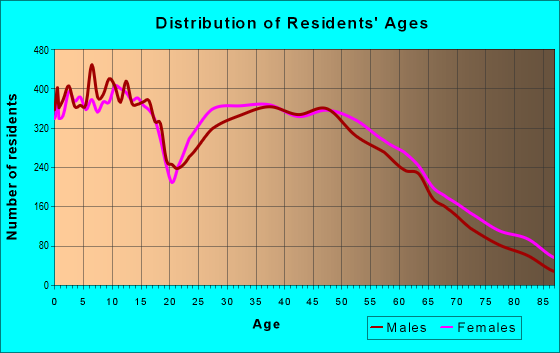
Median resident age:
This zip code:
37.5 years
Indiana median age:
38.2 years
Average household size:
This zip code:
2.5 people
Indiana:
2.4 people
Averages for the 2020 tax year for zip code 46143, filed in 2021:
Average Adjusted Gross Income (AGI) in 2020: $78,681 (Individual Income Tax Returns)
Here:
$78,681
State:
$64,978
Salary/wage: $66,485 (reported on 83.1% of returns)
Here:
$66,485
State:
$55,245
(% of AGI for various income ranges: 1080.4% for AGIs below $25k, 3484.0% for AGIs $25k-50k, 6341.0% for AGIs $50k-75k, 9317.1% for AGIs $75k-100k, 18259.8% for AGIs $100k-200k, 69449.3% for AGIs over 200k)
Taxable interest for individuals: $1,718 (reported on 27.4% of returns)
This zip code:
$1,718
Indiana:
$1,351
(% of AGI for various income ranges: 13.3% for AGIs below $25k, 13.9% for AGIs $25k-50k, 31.0% for AGIs $50k-75k, 50.8% for AGIs $75k-100k, 82.6% for AGIs $100k-200k, 1297.7% for AGIs over 200k)
Ordinary dividends: $5,605 (reported on 18.3% of returns)
Here:
$5,605
State:
$5,827
(% of AGI for various income ranges: 19.7% for AGIs below $25k, 30.9% for AGIs $25k-50k, 72.4% for AGIs $50k-75k, 124.9% for AGIs $75k-100k, 220.7% for AGIs $100k-200k, 2645.1% for AGIs over 200k)
Net capital gain/loss in AGI: +$17,279 (reported on 16.6% of returns)
Here:
+$17,279
State:
+$17,730
(% of AGI for various income ranges: 10.2% for AGIs below $25k, 25.4% for AGIs $25k-50k, 68.4% for AGIs $50k-75k, 166.0% for AGIs $75k-100k, 428.3% for AGIs $100k-200k, 10807.9% for AGIs over 200k)
Profit/loss from business: +$15,965 (reported on 15.7% of returns)
Here:
+$15,965
State:
+$12,144
(% of AGI for various income ranges: 147.7% for AGIs below $25k, 284.2% for AGIs $25k-50k, 333.5% for AGIs $50k-75k, 318.0% for AGIs $75k-100k, 495.4% for AGIs $100k-200k, 2769.8% for AGIs over 200k)
Taxable individual retirement arrangement distribution: $23,171 (reported on 9.7% of returns)
46143:
$23,171
Indiana:
$18,302
(% of AGI for various income ranges: 55.1% for AGIs below $25k, 98.7% for AGIs $25k-50k, 210.1% for AGIs $50k-75k, 459.5% for AGIs $75k-100k, 807.4% for AGIs $100k-200k, 2795.4% for AGIs over 200k)
Self-employed (Keogh) retirement plans: $21,817 (reported on 0.4% of returns)
46143:
$21,817
Indiana:
$27,160
(% of AGI for various income ranges: 17.8% for AGIs $100k-200k, 338.2% for AGIs over 200k)
Total itemized deductions: $34,682 (reported on 7.4% of returns)
Here:
$34,682
State:
$35,601
(% of AGI for various income ranges: 41.3% for AGIs below $25k, 93.3% for AGIs $25k-50k, 194.8% for AGIs $50k-75k, 358.8% for AGIs $75k-100k, 739.3% for AGIs $100k-200k, 5422.3% for AGIs over 200k)
Charity contributions: $13,846 (reported on 6.3% of returns)
Here:
$13,846
State:
$15,596
(% of AGI for various income ranges: 3.2% for AGIs below $25k, 14.3% for AGIs $25k-50k, 41.4% for AGIs $50k-75k, 75.5% for AGIs $75k-100k, 227.8% for AGIs $100k-200k, 2508.9% for AGIs over 200k)
Taxes paid: $7,637 (reported on 7.4% of returns)
46143:
$7,637
State:
$7,542
(% of AGI for various income ranges: 4.0% for AGIs below $25k, 9.4% for AGIs $25k-50k, 35.2% for AGIs $50k-75k, 75.7% for AGIs $75k-100k, 205.6% for AGIs $100k-200k, 1175.4% for AGIs over 200k)
Earned income credit: $2,279 (reported on 13.1% of returns)
Here:
$2,279
State:
$2,298
(% of AGI for various income ranges: 77.2% for AGIs below $25k, 70.5% for AGIs $25k-50k, 1.6% for AGIs $50k-75k)
Percentage of individuals using paid preparers for their 2020 taxes: 94.3%
Here:
94%
State:
94%
(% for various income ranges: 92.7% for AGIs below $25k, 95.1% for AGIs $25k-50k, 95.1% for AGIs $50k-75k, 95.1% for AGIs $75k-100k, 94.6% for AGIs $100k-200k, 93.9% for AGIs over 200k)
Averages for the 2012 tax year for zip code 46143, filed in 2013:
Average Adjusted Gross Income (AGI) in 2012: $68,699 (Individual Income Tax Returns)
Here:
$68,699
State:
$52,932
Salary/wage: $56,913 (reported on 86.2% of returns)
Here:
$56,913
State:
$45,173
(% of AGI for various income ranges: 73.7% for AGIs below $25k, 80.4% for AGIs $25k-50k, 79.9% for AGIs $50k-75k, 80.9% for AGIs $75k-100k, 81.9% for AGIs $100k-200k, 47.6% for AGIs over 200k)
Taxable interest for individuals: $1,465 (reported on 31.9% of returns)
This zip code:
$1,465
Indiana:
$1,311
(% of AGI for various income ranges: 1.0% for AGIs below $25k, 0.5% for AGIs $25k-50k, 0.4% for AGIs $50k-75k, 0.5% for AGIs $75k-100k, 0.4% for AGIs $100k-200k, 1.2% for AGIs over 200k)
Ordinary dividends: $4,597 (reported on 19.4% of returns)
Here:
$4,597
State:
$4,690
(% of AGI for various income ranges: 1.3% for AGIs below $25k, 0.9% for AGIs $25k-50k, 0.9% for AGIs $50k-75k, 1.0% for AGIs $75k-100k, 0.8% for AGIs $100k-200k, 2.4% for AGIs over 200k)
Net capital gain/loss in AGI: +$15,245 (reported on 15.3% of returns)
Here:
+$15,245
State:
+$10,406
(% of AGI for various income ranges: 0.2% for AGIs $25k-50k, 0.4% for AGIs $50k-75k, 0.4% for AGIs $75k-100k, 0.7% for AGIs $100k-200k, 11.2% for AGIs over 200k)
Profit/loss from business: +$13,974 (reported on 13.4% of returns)
Here:
+$13,974
State:
+$11,105
(% of AGI for various income ranges: 6.7% for AGIs below $25k, 3.7% for AGIs $25k-50k, 2.2% for AGIs $50k-75k, 1.7% for AGIs $75k-100k, 2.3% for AGIs $100k-200k, 2.7% for AGIs over 200k)
Taxable individual retirement arrangement distribution: $16,171 (reported on 10.7% of returns)
46143:
$16,171
Indiana:
$13,841
(% of AGI for various income ranges: 3.5% for AGIs below $25k, 2.5% for AGIs $25k-50k, 2.9% for AGIs $50k-75k, 3.3% for AGIs $75k-100k, 2.6% for AGIs $100k-200k, 1.7% for AGIs over 200k)
Self-employment retirement plans: $20,631 (reported on 0.5% of returns)
46143:
$20,631
Indiana:
$21,482
(% of AGI for various income ranges: 0.2% for AGIs below $25k, 0.2% for AGIs $100k-200k, 0.4% for AGIs over 200k)
Total itemized deductions: $22,050 (17% of AGI, reported on 36.4% of returns)
Here:
$22,050
State:
$20,913
Here:
17.2% of AGI
State:
18.2% of AGI
(% of AGI for various income ranges: 9.8% for AGIs below $25k, 9.1% for AGIs $25k-50k, 10.8% for AGIs $50k-75k, 13.2% for AGIs $75k-100k, 14.2% for AGIs $100k-200k, 10.3% for AGIs over 200k)
Charity contributions: $4,507 (reported on 30.4% of returns)
Here:
$4,507
State:
$4,697
(% of AGI for various income ranges: 0.9% for AGIs below $25k, 1.1% for AGIs $25k-50k, 1.6% for AGIs $50k-75k, 2.2% for AGIs $75k-100k, 2.4% for AGIs $100k-200k, 2.3% for AGIs over 200k)
Taxes paid: $8,003 (reported on 36.3% of returns)
46143:
$8,003
State:
$7,456
(% of AGI for various income ranges: 1.5% for AGIs below $25k, 2.0% for AGIs $25k-50k, 2.9% for AGIs $50k-75k, 4.0% for AGIs $75k-100k, 5.3% for AGIs $100k-200k, 5.4% for AGIs over 200k)
Earned income credit: $2,220 (reported on 13.9% of returns)
Here:
$2,220
State:
$2,265
(% of AGI for various income ranges: 5.5% for AGIs below $25k, 1.1% for AGIs $25k-50k)
Percentage of individuals using paid preparers for their 2012 taxes: 44.9%
Here:
45%
State:
53%
(% for various income ranges: 42.1% for AGIs below $25k, 42.9% for AGIs $25k-50k, 45.3% for AGIs $50k-75k, 44.8% for AGIs $75k-100k, 48.4% for AGIs $100k-200k, 67.0% for AGIs over 200k)
Averages for the 2004 tax year for zip code 46143, filed in 2005:
Average Adjusted Gross Income (AGI) in 2004: $58,221 (Individual Income Tax Returns)
Here:
$58,221
State:
$44,790
Salary/wage: $50,940 (reported on 87.7% of returns)
Here:
$50,940
State:
$39,615
(% of AGI for various income ranges: 426.3% for AGIs below $10k, 75.0% for AGIs $10k-25k, 83.1% for AGIs $25k-50k, 84.8% for AGIs $50k-75k, 85.9% for AGIs $75k-100k, 67.1% for AGIs over 100k)
Taxable interest for individuals: $1,722 (reported on 46.7% of returns)
This zip code:
$1,722
Indiana:
$1,535
(% of AGI for various income ranges: 26.3% for AGIs below $10k, 2.4% for AGIs $10k-25k, 1.2% for AGIs $25k-50k, 0.9% for AGIs $50k-75k, 0.7% for AGIs $75k-100k, 1.5% for AGIs over 100k)
Taxable dividends: $3,308 (reported on 24.5% of returns)
Here:
$3,308
State:
$2,998
(% of AGI for various income ranges: 19.1% for AGIs below $10k, 1.4% for AGIs $10k-25k, 0.8% for AGIs $25k-50k, 0.8% for AGIs $50k-75k, 0.7% for AGIs $75k-100k, 1.9% for AGIs over 100k)
Net capital gain/loss: +$10,314 (reported on 19.6% of returns)
Here:
+$10,314
State:
+$8,619
(% of AGI for various income ranges: 1.8% for AGIs below $10k, 0.4% for AGIs $10k-25k, 0.5% for AGIs $25k-50k, 0.6% for AGIs $50k-75k, 0.9% for AGIs $75k-100k, 6.6% for AGIs over 100k)
Profit/loss from business: +$13,501 (reported on 12.8% of returns)
Here:
+$13,501
State:
+$10,071
(% of AGI for various income ranges: 25.3% for AGIs below $10k, 3.8% for AGIs $10k-25k, 2.1% for AGIs $25k-50k, 2.2% for AGIs $50k-75k, 2.4% for AGIs $75k-100k, 3.4% for AGIs over 100k)
IRA payment deduction: $2,947 (reported on 2.3% of returns)
46143:
$2,947
Indiana:
$2,840
(% of AGI for various income ranges: 0.2% for AGIs $10k-25k, 0.2% for AGIs $25k-50k, 0.1% for AGIs $50k-75k, 0.1% for AGIs $75k-100k, 0.1% for AGIs over 100k)
Self-employed pension: $16,799 (reported on 0.8% of returns)
Here:
$16,799
Indiana:
$15,305
(% of AGI for various income ranges: 0.1% for AGIs $50k-75k, 0.1% for AGIs $75k-100k, 0.4% for AGIs over 100k)
Total itemized deductions: $20,285 (21% of AGI, reported on 45.7% of returns)
Here:
$20,285
State:
$17,065
Here:
20.6% of AGI
State:
19.5% of AGI
(% of AGI for various income ranges: 47.8% for AGIs below $10k, 12.3% for AGIs $10k-25k, 13.2% for AGIs $25k-50k, 16.5% for AGIs $50k-75k, 24.4% for AGIs $75k-100k, 14.0% for AGIs over 100k)
Charity contributions deductions: $3,490 (3% of AGI, reported on 39.6% of returns)
Here:
$3,490
State:
$3,550
Here:
3.3% of AGI
State:
3.8% of AGI
(% of AGI for various income ranges: 3.6% for AGIs below $10k, 1.3% for AGIs $10k-25k, 1.4% for AGIs $25k-50k, 1.9% for AGIs $50k-75k, 2.5% for AGIs $75k-100k, 2.9% for AGIs over 100k)
Total tax: $9,611 (reported on 79.7% of returns)
46143:
$9,611
State:
$6,914
(% of AGI for various income ranges: 10.1% for AGIs below $10k, 4.3% for AGIs $10k-25k, 7.1% for AGIs $25k-50k, 8.5% for AGIs $50k-75k, 9.9% for AGIs $75k-100k, 18.8% for AGIs over 100k)
Earned income credit: $1,571 (reported on 9.3% of returns)
Here:
$1,571
State:
$1,685
Percentage of individuals using paid preparers for their 2004 taxes: 50.2%
Here:
50%
State:
59%
(% for various income ranges: 40.8% for AGIs below $10k, 51.7% for AGIs $10k-25k, 51.4% for AGIs $25k-50k, 50.4% for AGIs $50k-75k, 50.1% for AGIs $75k-100k, 57.2% for AGIs over 100k)
Likely homosexual households (counted as self-reported same-sex unmarried-partner households)
Lesbian couples: 0.1% of all households
Gay men: 0.0% of all households
Household received Food Stamps/SNAP in the past 12 months: 1,352 Household did not receive Food Stamps/SNAP in the past 12 months: 21,436
Women who had a birth in the past 12 months: 904 (676 now married, 237 unmarried) Women who did not have a birth in the past 12 months: 12,994 (6,515 now married, 6,494 unmarried)
Housing units in zip code 46143 with a mortgage: 11,714 (1,112 second mortgage, 46 home equity loan, 987 both second mortgage and home equity loan) Houses without a mortgage: 411
Median monthly owner costs for units with a mortgage: $1,438 Median monthly owner costs for units without a mortgage: $515
Residents with income below the poverty level in 2022:
This zip code:
6.6%
Whole state:
12.6%
Residents with income below 50% of the poverty level in 2022:
This zip code:
3.0%
Whole state:
6.3%
Median number of rooms in houses and condos:
Here:
7.1
State:
6.6
Median number of rooms in apartments:
Here:
4.6
State:
4.3
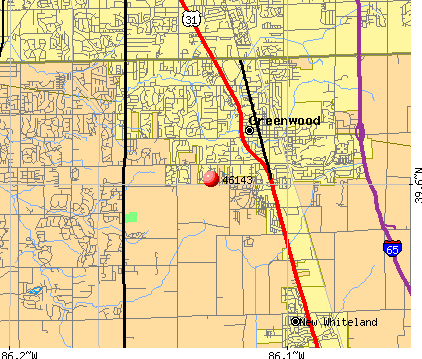
Notable locations in this zip code not listed on our city pages
Notable locations in zip code 46143: Sierra Business Center (A), Precedent South Business Center (B), Park 800 Industrial Park (C), Walnut Ridge Golf Course (D), Valle Vista Golf Course (E), South Park Business Park (F), Otte Golf Center (G), Mission Hills Office Center (H), Hickory Stick Golf Club (I), Royal Oak Country Club (J), Copeland Hog Farm (K), Greenwood Community Center (L), Greenwood Fire Department Station 91 Headquarters (M), Needham Community Volunteer Fire Department Station 82 (N), Bargersville Community Fire Station 2 (O), Greenwood Fire Department Station 91 (P), Needham Volunteer Fire Department (Q), White River Township Fire Department Station 51 (R), Greenwood Fire Department Station 94 (S), Greenwood Fire Department Station 93 (T). Display/hide their locations on the map
Churches in zip code 46143 include: Honey Creek Church (A), Bluff Creek Christian Church (B), Our Lady of the Greenwood Church (C), Outreach Community Church of God (D), Northern Park Baptist Church (E), Mount Auburn United Methodist Church (F), Salem Church (G). Display/hide their locations on the map
Cemeteries: Miller Cemetery (1), Mount Auburn Cemetery (2), Forest Lawn Cemetery (3), Salem Cemetery (4), Lowe Cemetery (5), Nolan Cemetery (6). Display/hide their locations on the map
Streams, rivers, and creeks: Short Run (A), Leather Run (B), Lake Run (C), Turkey Pen Creek (D), Travis Creek (E), Waterloo Run (F), Center Creek (G), Smith Run (H), Salem Brook (I). Display/hide their locations on the map
10,262 married couples with children.
3,188 single-parent households (1,473 men, 1,715 women).
88.3% of residents of 46143 zip code speak English at home.
3.2% of residents speak Spanish at home (70% very well, 28% well, 2% not well).
6.3% of residents speak other Indo-European language at home (66% very well, 19% well, 14% not well, 1% not at all).
1.5% of residents speak Asian or Pacific Island language at home (61% very well, 29% well, 7% not well, 3% not at all).
0.7% of residents speak other language at home (100% very well).
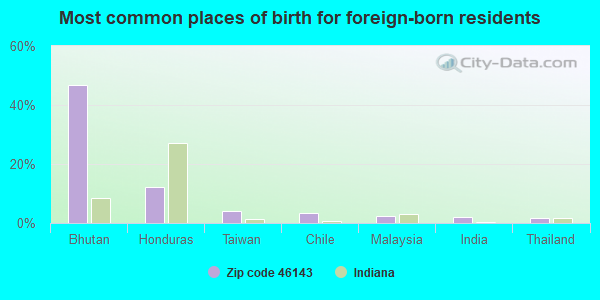
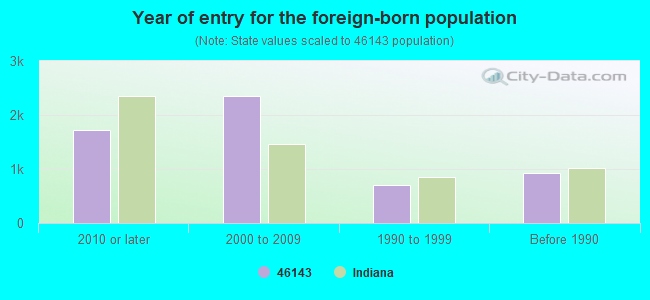
Foreign born population: 5,087 (8.7%) (61.9% of them are naturalized citizens)
Major facilities with environmental interests located in this zip code:
LIGHTING RESOURCES INCORPORATED (498 PARK 800 DR in GREENWOOD, IN)
AIR SYNTHETIC MINOR (AIRS/AFS) STATE MASTER (Indiana facility tracking) - ACES-OP-08100030, AIR PROGRAM HAZARDOUS WASTE BIENNIAL REPORTER (Resource Conservation and Recovery Act (tracking hazardous waste)) Large Quantity Generators, more that 1000 kg of hazardous waste/month (Resource Conservation and Recovery Act (tracking hazardous waste)) TRANSPORTER (Resource Conservation and Recovery Act (tracking hazardous waste)) TSD (Resource Conservation and Recovery Act (tracking hazardous waste)) Business SIC classification: NONCLASSIFIABLE ESTABLISHMENTS Organizations: MEADOWS ROGER (CONTACT/OWNER)
, DAN GILLESPIE/ROGER MEADOWS (CONTACT/OWNER)
ALPINE ELECTRONICS MANUFACTURING OF AMERICA INCORPORATED (421 N. EMERSON AVE. in GREENWOOD, IN)
STATE MASTER (Indiana facility tracking) - CRTK-7536, EPCRA CRITERIA AND HAZARDOUS AIR POLLUTANT INVENTORY (Inventory of air pollution sources) (Resource Conservation and Recovery Act (tracking hazardous waste)) TRI REPORTER (Tracking of toxic chemicals releasing facilities) Business SIC classification: HOUSEHOLD AUDIO AND VIDEO EQUIPMENT; ELECTRONIC COMPONENTS Organizations: ALPINE ELECT MFG OF AMERICA (CONTACT/OPERATOR)
, ALPS ELECTRIC LTD JAPAN (CONTACT/OWNER)
Alternative names: ALPINE ELECTRONICS MFG. OF, ALPINE ELEC. OF AMERICA INC.
ARVIN INDUSTRIES INC (2615 ENDRESS PL. in GREENWOOD, IN)
STATE MASTER (Indiana facility tracking) - CRTK-8130, EPCRA, UST-792, UNDERGROUND STORAGE TANK PROGRAM (Resource Conservation and Recovery Act (tracking hazardous waste)) TRI REPORTER (Tracking of toxic chemicals releasing facilities) Business SIC classification: MOTOR VEHICLE PARTS AND ACCESSORIES Organizations: ARVIN N AMERICAN AUTOMOTIVE (CONTACT/OWNER)
Alternative names: ARVIN N.A. AUTOMOTIVE, GREENWOOD PLANT, ARVIN N AMERICAN AUTOMOTIVE
SAFETY KLEEN SYSTEMS 407602 (475 PARK 800 DR. in GREENWOOD, IN)
STATE MASTER (Indiana facility tracking) CRITERIA AND HAZARDOUS AIR POLLUTANT INVENTORY (Inventory of air pollution sources) HAZARDOUS WASTE BIENNIAL REPORTER (Resource Conservation and Recovery Act (tracking hazardous waste)) Large Quantity Generators, more that 1000 kg of hazardous waste/month (Resource Conservation and Recovery Act (tracking hazardous waste)) - notification TRANSPORTER (Resource Conservation and Recovery Act (tracking hazardous waste)) - notification USED OIL PROGRAM (Resource Conservation and Recovery Act (tracking hazardous waste)) TRI REPORTER (Tracking of toxic chemicals releasing facilities) Business SIC classification: BUSINESS SERVICES Business NAICS classification: HAZARDOUS WASTE COLLECTION. Organizations: SAFETY-KLEEN SYSTEMS INC (CONTACT/OPERATOR)
Alternative names: SAFETY KLEEN SYSTEMS INC
GREENWOOD INTERSTATE SHELL (1183 E MAIN ST in GREENWOOD, IN)
STATE MASTER (Indiana facility tracking) - CRTK-4178, EPCRA, LUST-199503540, LEAKING STORAGE TANK, UST-95, UNDERGROUND STORAGE TANK PROGRAM (Resource Conservation and Recovery Act (tracking hazardous waste)) Organizations: SHELL OIL PROD CO (CONTACT/OWNER)
Alternative names: SHELL SVC STA
MISSION HILLS SAVE-TOBACCO RD (1141 E MAIN ST in GREENWOOD, IN)
STATE MASTER (Indiana facility tracking) - CRTK-4165, EPCRA, UST-4865, UNDERGROUND STORAGE TANK PROGRAM (Resource Conservation and Recovery Act (tracking hazardous waste)) Organizations: KIEL BROS. OIL COMPANY, INC. (CONTACT/OWNER)
Alternative names: KP OIL CO INC
NACHI TECHNOLOGY INC (713 PUSHVILLE RD in GREENWOOD, IN)
STATE MASTER (Indiana facility tracking) - ACES-OP-08100018, AIR PROGRAM, CRTK-9950, EPCRA Conditionally Exempt Small Quantity Generators, less than 100 kg/month of hazardous waste (Resource Conservation and Recovery Act (tracking hazardous waste)) - notification TRI REPORTER (Tracking of toxic chemicals releasing facilities) Business SIC classification: BALL AND ROLLER BEARINGS Organizations: NACHI FUJIKOSHI CORP (CONTACT/OWNER)
CENTER GROVE COMMUNITY SCHOOLS BUS GARAGE (4795 W STONESCROSSING RD in GREENWOOD, IN)
STATE MASTER (Indiana facility tracking) - LUST-199803539, LEAKING STORAGE TANK, UST-10856, UNDERGROUND STORAGE TANK PROGRAM Conditionally Exempt Small Quantity Generators, less than 100 kg/month of hazardous waste (Resource Conservation and Recovery Act (tracking hazardous waste)) - notification Organizations: CENTER GROVE SCHOOLS (CONTACT/OWNER)
ADVANTAGE ENGINEERING INC (525 E STOP 18 RD in GREENWOOD, IN)
STATE MASTER (Indiana facility tracking) - ACES-OP-08100029, AIR PROGRAM, CRTK-993, EPCRA, UST-1254, UNDERGROUND STORAGE TANK PROGRAM TRANSPORTER (Resource Conservation and Recovery Act (tracking hazardous waste)) - notification
LIQUID WASTE REMOVAL INC (500 S POLK ST STE 100 in GREENWOOD, IN)
STATE MASTER (Indiana facility tracking) (Resource Conservation and Recovery Act (tracking hazardous waste)) TRANSPORTER (Resource Conservation and Recovery Act (tracking hazardous waste)) USED OIL PROGRAM (Resource Conservation and Recovery Act (tracking hazardous waste)) Organizations: BUSH GARY (CONTACT/OWNER)
, BUSH GARY J (CONTACT/OWNER)
CENTER GROVE ELEM SCHOOL (2455 S MORGANTOWN RD in GREENWOOD, IN)
(National Center for Education Statistics) - STATE ID-3435 Organizations: CENTER GROVE COM SCH CORP (SCHOOL DISTRICT)
CENTER GROVE MIDDLE SCHOOL (4900 STONES CROSSING in GREENWOOD, IN)
(National Center for Education Statistics) - STATE ID-3441 Organizations: CENTER GROVE COM SCH CORP (SCHOOL DISTRICT)
CENTRAL NINE CAREER CENTER (1999 US 31 S in GREENWOOD, IN)
(National Center for Education Statistics) - STATE ID-3470
Housing units lacking complete plumbing facilities: 0.1% Housing units lacking complete kitchen facilities: 0.8%
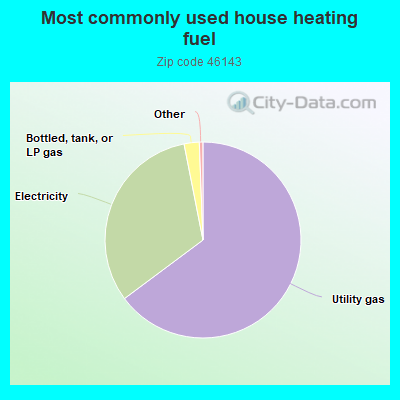
64.8%Utility gas
32.1%Electricity
2.5%Bottled, tank, or LP gas
Population in 1990: 24,633. Population change in the 1990s: +6,990 (+28.4%).
Place of birth for U.S.-born residents:
This state: 39,298
Northeast: 1,356
Midwest: 6,128
South: 4,157
West: 1,993
48% of the 46143 zip code residents lived in the same house 5 years ago. Out of people who lived in different houses, 37% lived in this county. Out of people who lived in different counties, 50% lived in Indiana.
89% of the 46143 zip code residents lived in the same house 1 year ago. Out of people who lived in different houses, 43% moved from this county. Out of people who lived in different houses, 41% moved from different county within same state. Out of people who lived in different houses, 12% moved from different state. Out of people who lived in different houses, 4% moved from abroad.
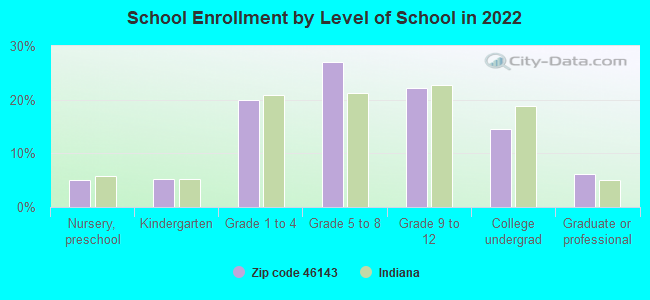
Private vs. public school enrollment:
Students in private schools in grades 1 to 8 (elementary and middle school): 682
Here:
10.3%
Indiana:
14.9%
Students in private schools in grades 9 to 12 (high school): 384
Here:
12.2%
Indiana:
11.4%
Students in private undergraduate colleges: 546
Here:
26.5%
Indiana:
22.3%
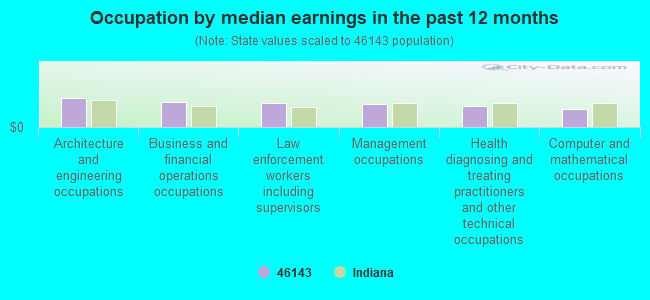
Occupation by median earnings in the past 12 months ($)
105,808Architecture and engineering occupations
91,858Business and financial operations occupations
87,930Law enforcement workers including supervisors
84,319Management occupations
75,308Health diagnosing and treating practitioners and other technical occupations
63,841Computer and mathematical occupations
Companies with federal contracts located in this zip code (GREENWOOD, IN):
GLOVER, JOHN L PRECISION PRODU (1701 INDUSTRIAL DR; small business) : $2,271,252 in 35 contractsfrom 2002 to 2006
Contracts for Armament Training Devices, Optical Sighting and Ranging Equipment, Operation Training Devices, Miscellaneous Machine Tools, and moreby Navy, Army, U.S. Special Operations Command Signed by year:2000: $0; 2001: $0; 2002: $26,000; 2003: $130,834; 2004: $992,957; 2005: $795,051; 2006: $326,410.
Biggest contracts:
$539,865 with Navy for Armament Training Devices. Signed on 2005-09-29. Completion date: 2006-01-30.
$280,911 with Army for Optical Sighting and Ranging Equipment. Signed on 2004-12-17. Completion date: 2005-03-25.
$216,891 with Army for Operation Training Devices. Signed on 2006-03-06. Completion date: 2006-04-28.
$169,684 with Army for Miscellaneous Machine Tools. Taking place in TX. Signed on 2004-09-22. Completion date: 2005-01-21.
REEVES BUICK PONTIAC INC (1250 US 31S) : $1,246,896 in 19 contractsfrom 1999 to 2006
Contracts for Maintenance, Repair and Rebuilding of Equipment -- Ground Effect Vehicles, Motor Vehicles, Trailers, and Cycles, Motor Passenger Services by Army Signed by year:2000: $97,500; 2001: $199,996; 2002: $180,004; 2003: $285,000; 2004: $165,508; 2005: $100,000; 2006: $70,000.
Biggest contracts:
$130,004 with Army for Maintenance, Repair and Rebuilding of Equipment -- Ground Effect Vehicles, Motor Vehicles, Trailers, and Cycles. Signed on 2002-02-15. Completion date: 2002-09-30.
$130,000, same as above.Signed on 2003-01-14. Completion date: 2003-10-28.
$100,000, same as above.Signed on 2005-04-04. Completion date: 2005-02-28.
$100,000, same as above.Signed on 2003-08-08. Completion date: 2003-10-28.
FERCO WEST CORPORATION (254 NORTH GRAHAM ROAD; small business) 100 employees, $0 revenue. : $268,850 in 4 contractsfrom 2000 to 2002
$82,800 with Defense Logistics Agency for Gas Turbines and Jet Engines, Aircraft; Prime Moving, and Components. Signed on 2000-12-21. Completion date: 2001-05-05.
$78,300, same as above.Signed on 2001-03-30. Completion date: 2001-05-14.
$60,500 with Defense Logistics Agency for Hardware, Weapon System. Signed on 2000-03-30. Completion date: 2000-05-14.
$47,250 with Defense Logistics Agency for Gas Turbines and Jet Engines, Aircraft; Prime Moving, and Components. Signed on 2002-05-02. Completion date: 2002-10-02.
PERSONNEL MANAGEMENT INC (1499 WINDHORST WAY SUITE 2) : $254,463 in 11 contractsfrom 2000 to 2006
Contracts for Guard Services, Other Professional Services by Army Signed by year:2000: $90,000; 2001: $0; 2002: $172,853; 2003: $1,114; 2004: $0; 2005: $0; 2006: -$9,504.
Biggest contracts:
$99,990 with Army for Guard Services. Signed on 2002-01-17. Completion date: 2002-06-30.
$90,000, same as above.Signed on 2000-11-06. Completion date: 2001-09-30.
$50,000, same as above.Signed on 2002-11-18. Completion date: 2003-03-31.
$15,000, same as above.Signed on 2002-09-16. Completion date: 2002-09-30.
DEVONSHIRE APARTMENTS (1100 DEVONSHIRE EAST DR; small business)
$92,400 with Army for Lease or Rental of Facilities -- Family Housing Facilities. Signed on 2006-03-24. Completion date: 2006-04-01.
RELIABLE TRANSMISSION SVC INC (325 E STOP 18 RD; small business)
$8,339 with Army for Tractors, Wheeled. Signed on 2004-12-06. Completion date: 2004-12-07.
AMERILINK MARKETING CORPORATIO (435 EAST MAIN STREET SUITE; small business) : $4,538 in 2 contractsin 2006
$4,178 with Army for Video Recording and Reproducing Equipment. Signed on 2006-03-30. Completion date: 2006-04-30.
$360, same as above.Signed on 2006-04-04. Completion date: 2006-04-30.
JACK W JUSTUS ENTERPRISES, IN (871 SAYRE DRIVE; small business) : $4,411 in 3 contractsfrom 2001 to 2004
$4,411 with Army for Construction of Structures and Facilities -- Other Administrative Facilities and Service Buildings. Signed on 2004-09-22. Completion date: 2004-09-22.
$2,000, same as above.Signed on 2001-11-06. Completion date: 2004-10-17.
-$2,000, same as above.Signed on 2003-12-29. Completion date: 2004-10-17.
MIDWEST GARAGE DOORS SYSTEMS I (437 E STOP 18 RD; small business) : $3,860 in 2 contractsin 2003
$3,675 with U.S. Army Corps of Engineers - civil program financing only for Maintenance, Repair and Rebuilding of Equipment -- Miscellaneous. Taking place in IL. Signed on 2003-08-04. Completion date: 2003-09-30.
$185, same as above.Signed on 2003-09-17. Completion date: 2003-09-30.
BARNETT CONSULTING LLC (1161 DEVONSHIRE W DR APT G; small business)
$3,000 with Navy for Other ADP and Telecommunications Services (includes data storage on tapes, compact disks, etc.). Signed on 2006-03-20. Completion date: 2006-04-12.
Top industries in this zip code by the number of employees in 2005:
Administrative and Support and Waste Management and Remediation Services: Professional Employer Organizations (over 1000 employees: 1 establishment, 100-249 employees: 1 establishment, 20-49 employees: 1 establishment)
2002 - 2018 National Fire Incident Reporting System (NFIRS) incidents
Based on the data from the years 2002 - 2018 the average number of fire incidents per year is 86. The highest number of reported fires - 157 took place in 2004, and the least - 13 in 2014. The data has a declining trend.
When looking into fire subcategories, the most reports belonged to: Outside Fires (44.1%), and Structure Fires (35.0%).
Fire incident types reported to NFIRS in Zip Code 46143
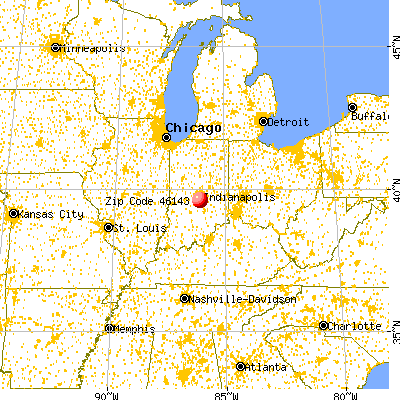


 Nearest zip codes: 46184, 46142, 46227, 46237, 46217, 46106.


 Based on the data from the years 2002 - 2018 the average number of fire incidents per year is 86. The highest number of reported fires - 157 took place in 2004, and the least - 13 in 2014. The data has a declining trend.
 When looking into fire subcategories, the most reports belonged to: Outside Fires (44.1%), and Structure Fires (35.0%).