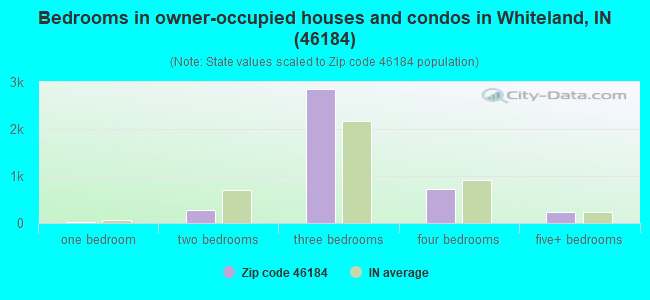
Estimated zip code population in 2022: 12,862 Zip code population in 2010: 11,806 Zip code population in 2000: 9,539
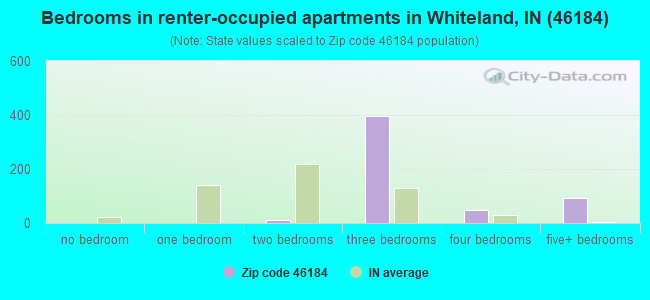
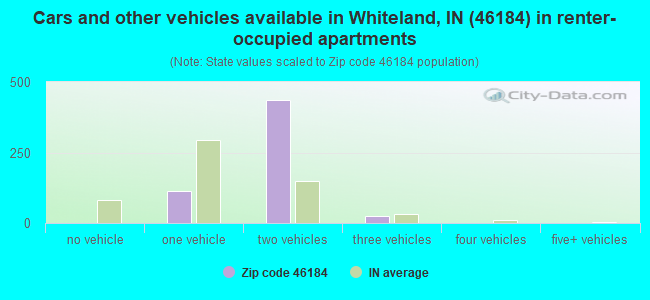
Houses and condos: 4,998 Renter-occupied apartments: 586
% of renters here:
12%
State:
29%
March 2022 cost of living index in zip code 46184: 89.6 (less than average, U.S. average is 100)
Land area: 20.5 sq. mi. Water area: 0.0 sq. mi.
Population density: 628 people per square mile
(low).
OSM Map
General Map
Google Map
MSN Map
OSM Map
General Map
Google Map
MSN Map
OSM Map
General Map
Google Map
MSN Map
OSM Map
General Map
Google Map
MSN Map
Please wait while loading the map...
Real estate property taxes paid for housing units in 2022:
This zip code:
0.7% ($1,490)
Indiana:
0.7% ($1,467)
Median real estate property taxes paid for housing units with mortgages in 2022: $1,487 (0.7%) Median real estate property taxes paid for housing units with no mortgage in 2022: $1,541 (0.8%)
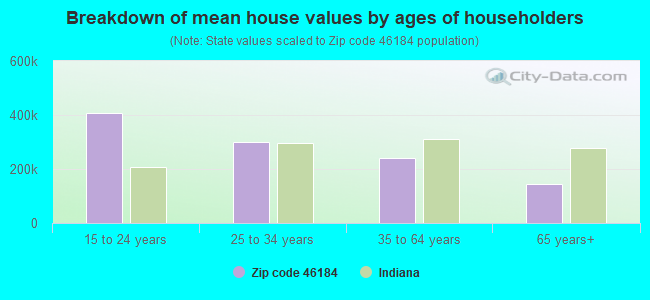
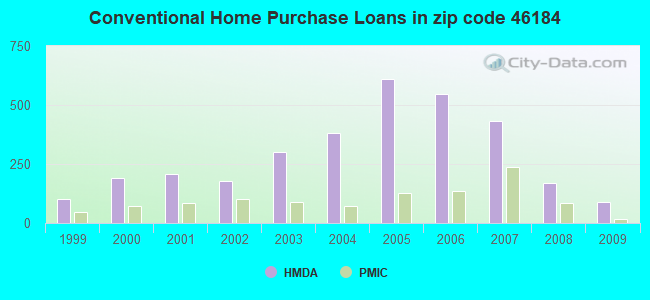
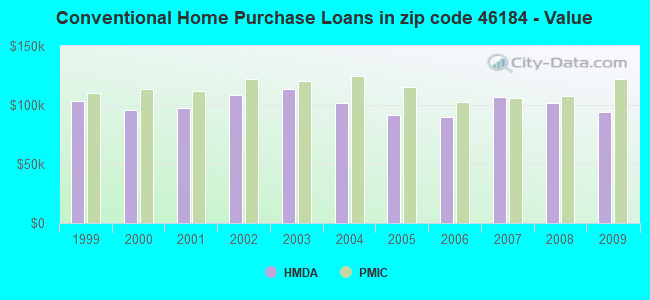
Estimated median house/condo value in 2022: $211,542
46184:
$211,542
Indiana:
$208,700
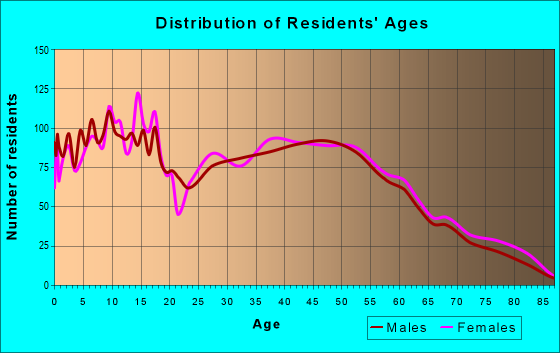
Median resident age:
This zip code:
38.4 years
Indiana median age:
38.2 years
Average household size:
This zip code:
2.8 people
Indiana:
2.4 people
Averages for the 2020 tax year for zip code 46184, filed in 2021:
Average Adjusted Gross Income (AGI) in 2020: $57,367 (Individual Income Tax Returns)
Here:
$57,367
State:
$64,978
Salary/wage: $52,682 (reported on 86.2% of returns)
Here:
$52,682
State:
$55,245
(% of AGI for various income ranges: 1089.9% for AGIs below $25k, 3620.3% for AGIs $25k-50k, 6447.1% for AGIs $50k-75k, 9356.4% for AGIs $75k-100k, 16162.3% for AGIs $100k-200k, 56363.3% for AGIs over 200k)
Taxable interest for individuals: $601 (reported on 20.4% of returns)
This zip code:
$601
Indiana:
$1,351
(% of AGI for various income ranges: 8.6% for AGIs below $25k, 7.6% for AGIs $25k-50k, 8.5% for AGIs $50k-75k, 14.8% for AGIs $75k-100k, 40.2% for AGIs $100k-200k, 493.3% for AGIs over 200k)
Ordinary dividends: $1,967 (reported on 10.5% of returns)
Here:
$1,967
State:
$5,827
(% of AGI for various income ranges: 15.5% for AGIs below $25k, 11.9% for AGIs $25k-50k, 28.0% for AGIs $50k-75k, 34.6% for AGIs $75k-100k, 56.3% for AGIs $100k-200k, 493.3% for AGIs over 200k)
Net capital gain/loss in AGI: +$8,198 (reported on 9.3% of returns)
Here:
+$8,198
State:
+$17,730
(% of AGI for various income ranges: 2.8% for AGIs below $25k, 7.3% for AGIs $25k-50k, 26.6% for AGIs $50k-75k, 63.0% for AGIs $75k-100k, 171.5% for AGIs $100k-200k, 10190.0% for AGIs over 200k)
Profit/loss from business: +$11,814 (reported on 12.6% of returns)
Here:
+$11,814
State:
+$12,144
(% of AGI for various income ranges: 80.9% for AGIs below $25k, 162.3% for AGIs $25k-50k, 164.7% for AGIs $50k-75k, 221.2% for AGIs $75k-100k, 556.1% for AGIs $100k-200k)
Taxable individual retirement arrangement distribution: $14,522 (reported on 7.2% of returns)
46184:
$14,522
Indiana:
$18,302
(% of AGI for various income ranges: 44.4% for AGIs below $25k, 69.2% for AGIs $25k-50k, 130.1% for AGIs $50k-75k, 211.8% for AGIs $75k-100k, 452.6% for AGIs $100k-200k)
Total itemized deductions: $30,904 (reported on 3.6% of returns)
Here:
$30,904
State:
$35,601
(% of AGI for various income ranges: 52.5% for AGIs $25k-50k, 137.1% for AGIs $50k-75k, 183.0% for AGIs $75k-100k, 381.3% for AGIs $100k-200k, 6186.7% for AGIs over 200k)
Charity contributions: $11,318 (reported on 2.7% of returns)
Here:
$11,318
State:
$15,596
(% of AGI for various income ranges: 40.7% for AGIs $50k-75k, 60.0% for AGIs $75k-100k, 110.5% for AGIs $100k-200k, 1856.7% for AGIs over 200k)
Taxes paid: $6,126 (reported on 3.6% of returns)
46184:
$6,126
State:
$7,542
(% of AGI for various income ranges: 7.1% for AGIs $25k-50k, 25.4% for AGIs $50k-75k, 37.5% for AGIs $75k-100k, 96.0% for AGIs $100k-200k, 980.0% for AGIs over 200k)
Earned income credit: $2,151 (reported on 13.8% of returns)
Here:
$2,151
State:
$2,298
(% of AGI for various income ranges: 66.8% for AGIs below $25k, 66.6% for AGIs $25k-50k, 1.4% for AGIs $50k-75k)
Percentage of individuals using paid preparers for their 2020 taxes: 95.3%
Here:
95%
State:
94%
(% for various income ranges: 94.4% for AGIs below $25k, 96.2% for AGIs $25k-50k, 97.2% for AGIs $50k-75k, 93.2% for AGIs $75k-100k, 95.7% for AGIs $100k-200k, 88.9% for AGIs over 200k)
Averages for the 2012 tax year for zip code 46184, filed in 2013:
Average Adjusted Gross Income (AGI) in 2012: $49,601 (Individual Income Tax Returns)
Here:
$49,601
State:
$52,932
Salary/wage: $45,301 (reported on 88.5% of returns)
Here:
$45,301
State:
$45,173
(% of AGI for various income ranges: 72.8% for AGIs below $25k, 84.2% for AGIs $25k-50k, 85.9% for AGIs $50k-75k, 87.2% for AGIs $75k-100k, 84.4% for AGIs $100k-200k, 41.2% for AGIs over 200k)
Taxable interest for individuals: $614 (reported on 24.3% of returns)
This zip code:
$614
Indiana:
$1,311
(% of AGI for various income ranges: 0.8% for AGIs below $25k, 0.3% for AGIs $25k-50k, 0.3% for AGIs $50k-75k, 0.1% for AGIs $75k-100k, 0.2% for AGIs $100k-200k, 0.3% for AGIs over 200k)
Ordinary dividends: $1,882 (reported on 11.7% of returns)
Here:
$1,882
State:
$4,690
(% of AGI for various income ranges: 0.8% for AGIs below $25k, 0.4% for AGIs $25k-50k, 0.4% for AGIs $50k-75k, 0.3% for AGIs $75k-100k, 0.5% for AGIs $100k-200k, 0.4% for AGIs over 200k)
Net capital gain/loss in AGI: +$1,372 (reported on 8.0% of returns)
Here:
+$1,372
State:
+$10,406
(% of AGI for various income ranges: 0.1% for AGIs $25k-50k, 0.2% for AGIs $50k-75k, 0.2% for AGIs $75k-100k, 0.4% for AGIs $100k-200k, 0.2% for AGIs over 200k)
Profit/loss from business: +$8,456 (reported on 12.2% of returns)
Here:
+$8,456
State:
+$11,105
(% of AGI for various income ranges: 6.3% for AGIs below $25k, 2.5% for AGIs $25k-50k, 1.7% for AGIs $50k-75k, 1.2% for AGIs $75k-100k, 2.0% for AGIs $100k-200k)
Taxable individual retirement arrangement distribution: $10,964 (reported on 7.7% of returns)
46184:
$10,964
Indiana:
$13,841
(% of AGI for various income ranges: 2.8% for AGIs below $25k, 1.3% for AGIs $25k-50k, 1.5% for AGIs $50k-75k, 1.7% for AGIs $75k-100k, 2.4% for AGIs $100k-200k)
Total itemized deductions: $17,025 (20% of AGI, reported on 28.8% of returns)
Here:
$17,025
State:
$20,913
Here:
19.8% of AGI
State:
18.2% of AGI
(% of AGI for various income ranges: 7.8% for AGIs below $25k, 7.9% for AGIs $25k-50k, 9.4% for AGIs $50k-75k, 10.3% for AGIs $75k-100k, 12.0% for AGIs $100k-200k, 10.8% for AGIs over 200k)
Charity contributions: $3,002 (reported on 22.0% of returns)
Here:
$3,002
State:
$4,697
(% of AGI for various income ranges: 0.7% for AGIs below $25k, 0.8% for AGIs $25k-50k, 1.1% for AGIs $50k-75k, 1.5% for AGIs $75k-100k, 2.0% for AGIs $100k-200k, 1.5% for AGIs over 200k)
Taxes paid: $5,564 (reported on 28.8% of returns)
46184:
$5,564
State:
$7,456
(% of AGI for various income ranges: 1.2% for AGIs below $25k, 2.0% for AGIs $25k-50k, 2.6% for AGIs $50k-75k, 3.5% for AGIs $75k-100k, 4.6% for AGIs $100k-200k, 5.5% for AGIs over 200k)
Earned income credit: $2,191 (reported on 16.6% of returns)
Here:
$2,191
State:
$2,265
(% of AGI for various income ranges: 5.9% for AGIs below $25k, 1.3% for AGIs $25k-50k)
Percentage of individuals using paid preparers for their 2012 taxes: 44.9%
Here:
45%
State:
53%
(% for various income ranges: 42.2% for AGIs below $25k, 46.5% for AGIs $25k-50k, 46.1% for AGIs $50k-75k, 45.3% for AGIs $75k-100k, 46.2% for AGIs $100k-200k, 75.0% for AGIs over 200k)
Averages for the 2004 tax year for zip code 46184, filed in 2005:
Average Adjusted Gross Income (AGI) in 2004: $45,186 (Individual Income Tax Returns)
Here:
$45,186
State:
$44,790
Salary/wage: $41,699 (reported on 90.4% of returns)
Here:
$41,699
State:
$39,615
(% of AGI for various income ranges: 86.3% for AGIs below $10k, 75.5% for AGIs $10k-25k, 85.0% for AGIs $25k-50k, 89.5% for AGIs $50k-75k, 91.5% for AGIs $75k-100k, 69.9% for AGIs over 100k)
Taxable interest for individuals: $783 (reported on 35.4% of returns)
This zip code:
$783
Indiana:
$1,535
(% of AGI for various income ranges: 2.3% for AGIs below $10k, 1.8% for AGIs $10k-25k, 0.8% for AGIs $25k-50k, 0.3% for AGIs $50k-75k, 0.2% for AGIs $75k-100k, 0.6% for AGIs over 100k)
Taxable dividends: $1,552 (reported on 15.5% of returns)
Here:
$1,552
State:
$2,998
(% of AGI for various income ranges: 1.8% for AGIs below $10k, 0.6% for AGIs $10k-25k, 0.5% for AGIs $25k-50k, 0.3% for AGIs $50k-75k, 0.2% for AGIs $75k-100k, 0.9% for AGIs over 100k)
Net capital gain/loss: +$2,962 (reported on 10.6% of returns)
Here:
+$2,962
State:
+$8,619
(% of AGI for various income ranges: -0.7% for AGIs below $10k, 0.4% for AGIs $10k-25k, 0.2% for AGIs $25k-50k, 0.3% for AGIs $50k-75k, 0.3% for AGIs $75k-100k, 2.1% for AGIs over 100k)
Profit/loss from business: +$8,624 (reported on 13.2% of returns)
Here:
+$8,624
State:
+$10,071
(% of AGI for various income ranges: 3.1% for AGIs below $10k, 3.8% for AGIs $10k-25k, 3.6% for AGIs $25k-50k, 2.3% for AGIs $50k-75k, 1.7% for AGIs $75k-100k, 2.0% for AGIs over 100k)
IRA payment deduction: $2,187 (reported on 1.6% of returns)
46184:
$2,187
Indiana:
$2,840
(% of AGI for various income ranges: 0.3% for AGIs below $10k, 0.1% for AGIs $25k-50k, 0.1% for AGIs $50k-75k, 0.1% for AGIs over 100k)
Total itemized deductions: $15,150 (21% of AGI, reported on 40.3% of returns)
Here:
$15,150
State:
$17,065
Here:
21.0% of AGI
State:
19.5% of AGI
(% of AGI for various income ranges: 10.5% for AGIs below $10k, 8.3% for AGIs $10k-25k, 12.7% for AGIs $25k-50k, 13.9% for AGIs $50k-75k, 16.5% for AGIs $75k-100k, 13.1% for AGIs over 100k)
Charity contributions deductions: $2,446 (3% of AGI, reported on 32.1% of returns)
Here:
$2,446
State:
$3,550
Here:
3.2% of AGI
State:
3.8% of AGI
(% of AGI for various income ranges: 0.6% for AGIs below $10k, 0.8% for AGIs $10k-25k, 1.2% for AGIs $25k-50k, 1.4% for AGIs $50k-75k, 1.9% for AGIs $75k-100k, 2.8% for AGIs over 100k)
Total tax: $5,694 (reported on 78.1% of returns)
46184:
$5,694
State:
$6,914
(% of AGI for various income ranges: 1.9% for AGIs below $10k, 4.0% for AGIs $10k-25k, 6.4% for AGIs $25k-50k, 8.0% for AGIs $50k-75k, 9.7% for AGIs $75k-100k, 17.9% for AGIs over 100k)
Earned income credit: $1,570 (reported on 11.0% of returns)
Here:
$1,570
State:
$1,685
Percentage of individuals using paid preparers for their 2004 taxes: 50.9%
Here:
51%
State:
59%
(% for various income ranges: 40.2% for AGIs below $10k, 50.3% for AGIs $10k-25k, 53.8% for AGIs $25k-50k, 53.8% for AGIs $50k-75k, 50.5% for AGIs $75k-100k, 62.1% for AGIs over 100k)
Likely homosexual households (counted as self-reported same-sex unmarried-partner households)
Lesbian couples: 1.7% of all households
Gay men: 0.0% of all households
Household received Food Stamps/SNAP in the past 12 months: 100 Household did not receive Food Stamps/SNAP in the past 12 months: 4,560
Women who had a birth in the past 12 months: 100 (108 now married, 0 unmarried) Women who did not have a birth in the past 12 months: 2,766 (1,579 now married, 1,193 unmarried)
Housing units in zip code 46184 with a mortgage: 2,963 (245 second mortgage, 224 both second mortgage and home equity loan) Houses without a mortgage: 36
Median monthly owner costs for units with a mortgage: $1,231 Median monthly owner costs for units without a mortgage: $485
Residents with income below the poverty level in 2022:
This zip code:
8.1%
Whole state:
12.6%
Residents with income below 50% of the poverty level in 2022:
This zip code:
2.5%
Whole state:
6.3%
Median number of rooms in houses and condos:
Here:
6.5
State:
6.6
Median number of rooms in apartments:
Here:
6.3
State:
4.3
Notable locations in this zip code not listed on our city pages
Notable locations in zip code 46184: New Whiteland City Hall (A), Whiteland Volunteer Fire Department (B), New Whiteland Volunteer Fire Department (C). Display/hide their locations on the map
Churches in zip code 46184 include: Church of God (A), Victory Baptist Church (B), Solid Rock Church (C), Whiteland United Methodist Church (D), New Whiteland Christian Church (E), New Whiteland Baptist Church (F), Saint Thomas Episcopal Church (G). Display/hide their locations on the map
In group quarters: 2 (-1 institutionalized population)
Size of family households: 1,381 2-persons, 627 3-persons, 634 4-persons, 279 5-persons, 163 6-persons, 166 7-or-more-persons
Size of nonfamily households: 965 1-person, 413 2-persons, 34 3-persons
2,608 married couples with children.
216 single-parent households (49 men, 167 women).
93.9% of residents of 46184 zip code speak English at home.
5.2% of residents speak Spanish at home (34% very well, 18% well, 48% not well).
0.2% of residents speak other Indo-European language at home (100% well).
0.6% of residents speak Asian or Pacific Island language at home (26% very well, 74% well).
0.2% of residents speak other language at home (100% very well).
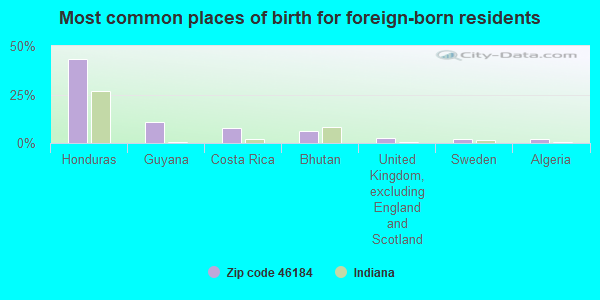
Foreign born population: 344 (2.7%) (24.2% of them are naturalized citizens)
This zip code:
2.7%
Whole state:
6.1%
44%Honduras
11%Guyana
7%Costa Rica
6%Bhutan
3%United Kingdom, excluding England and Scotland
2%Sweden
2%Algeria
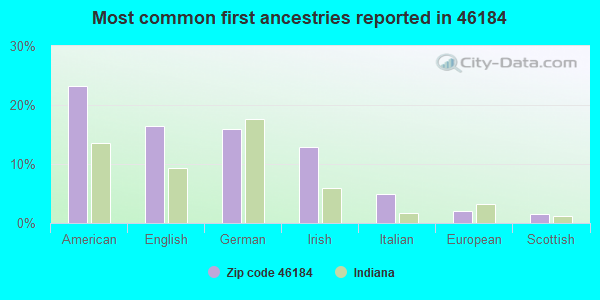
23%American
16%English
16%German
13%Irish
5%Italian
2%European
1%Scottish
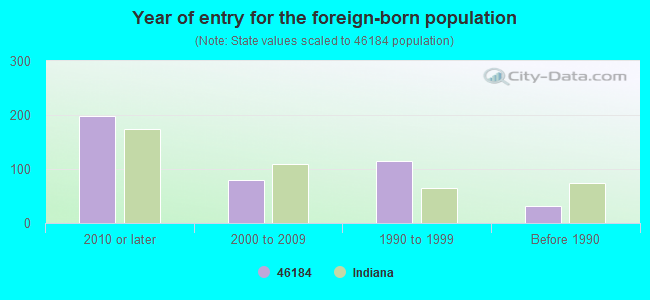
Year of entry for the foreign-born population
1982010 or later
802000 to 2009
1141990 to 1999
31Before 1990
Facilities with environmental interests located in this zip code:
BIGFOOT 51 (1014 N US 31 in NEW WHITELAND, IN)
STATE MASTER (Indiana facility tracking) - CRTK-9609, EPCRA, UST-17103, UNDERGROUND STORAGE TANK PROGRAM, UST-8040, (Resource Conservation and Recovery Act (tracking hazardous waste)) Alternative names: SUNOCO SERVICE STATION
NEW WHITELAND WWTP (401 MOORLAND DR in NEW WHITELAND, IN)
STATE MASTER (Indiana facility tracking) - CRTK-324, EPCRA National Pollutant Discharge Elimination System NON-MAJOR (Tracking pollutant discharge elimination systems) - permit Business SIC classification: SEWERAGE SYSTEMS Organizations: RICHARD L ABBOTT CERT OPER (CONTACT/OPERATOR)
, TOWN COUNCIL PRESIDENT (CONTACT/OWNER)
Alternative names: NEW WHITELAND MUNICIPAL STP, NEW WHITELAND MUNICIPAL WWTP
PEOPLES TELEPHONE CO (20 N US 31 in WHITELAND, IN)
STATE MASTER (Indiana facility tracking) - CRTK-4651, EPCRA, LUST-199705527, LEAKING STORAGE TANK, UST-6668, UNDERGROUND STORAGE TANK PROGRAM (Resource Conservation and Recovery Act (tracking hazardous waste)) Organizations: SPEEDWAY SUPERAMERICA LLC (CONTACT/OWNER)
Alternative names: SPEEDWAY 6026
BREAK-O-DAY ELEMENTARY SCHOOL (900 SAWMILL RD in NEW WHITELAND, IN)
(Geographic Names Information System) (National Center for Education Statistics) - STATE ID-3429 Organizations: CLARK-PLEASANT COM SCHOOL CORP (SCHOOL DISTRICT)
CLARK PLEASANT CMMUNITY SCHOOL CORP (50 CENTER STREET in WHITELAND, IN)
STATE MASTER (Indiana facility tracking) COMPLIANCE ACTIVITY (Tracking inspections of insecticide, fungicide, and rodenticide, and toxic substances) National Pollutant Discharge Elimination System NON-MAJOR (Tracking pollutant discharge elimination systems) - permit Business SIC classification: ELEMENTARY AND SECONDARY SCHOOLS Organizations: PHILLIP MARTIN 13041 (CONTACT/OPERATOR)
, CLARK PLEASANT COMM SCH CORP (CONTACT/OWNER)
Alternative names: CLARK ELEMENTARY SCHOOL, CLARK PLEASANT COMMUNITY SCHOOL CORP
SAWMILL WOODS ELEMENTARY SCHOOL (700 SAWMILL RD in NEW WHITELAND, IN)
(National Center for Education Statistics) - STATE ID-3423 Organizations: CLARK-PLEASANT COM SCHOOL CORP (SCHOOL DISTRICT)
POWER DYNE INC (131 CROSSROADS DR in WHITELAND, IN)
STATE MASTER (Indiana facility tracking) Conditionally Exempt Small Quantity Generators, less than 100 kg/month of hazardous waste (Resource Conservation and Recovery Act (tracking hazardous waste)) - notification Organizations: CARDINALI FRANK (CONTACT/OWNER)
MAYES RV SALES (1097 US 31 N in NEW WHITELAND, IN)
STATE MASTER (Indiana facility tracking) Conditionally Exempt Small Quantity Generators, less than 100 kg/month of hazardous waste (Resource Conservation and Recovery Act (tracking hazardous waste)) - notification Organizations: LARRY MAYES SALES INC (CONTACT/OWNER)
Alternative names: MAYES RV SALES DBA BYRD'S RV CTR
Housing units lacking complete kitchen facilities: 0.3%
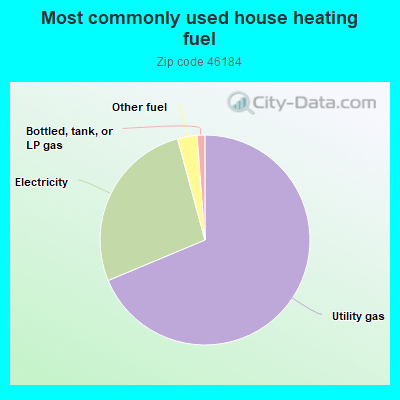
68.7%Utility gas
27.1%Electricity
3.0%Other fuel
1.2%Bottled, tank, or LP gas
Population in 1990: 7,226. Population change in the 1990s: +2,313 (+32.0%).
Place of birth for U.S.-born residents:
This state: 9,238
Northeast: 211
Midwest: 1,019
South: 1,502
West: 406
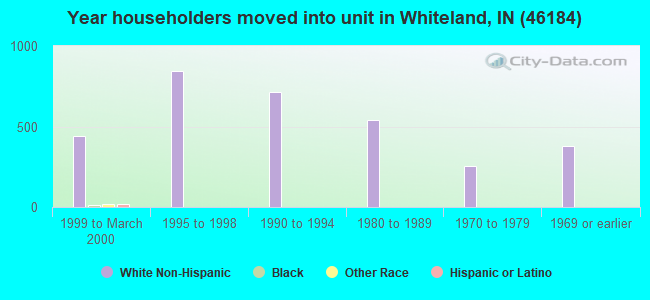
65% of the 46184 zip code residents lived in the same house 5 years ago. Out of people who lived in different houses, 55% lived in this county. Out of people who lived in different counties, 50% lived in Indiana.
92% of the 46184 zip code residents lived in the same house 1 year ago. Out of people who lived in different houses, 29% moved from this county. Out of people who lived in different houses, 25% moved from different county within same state. Out of people who lived in different houses, 50% moved from different state.
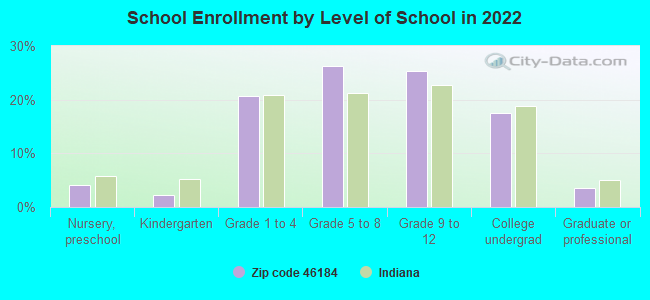
Private vs. public school enrollment:
Students in private schools in grades 1 to 8 (elementary and middle school): 272
Here:
18.9%
Indiana:
14.9%
Students in private schools in grades 9 to 12 (high school): 124
Here:
16.0%
Indiana:
11.4%
Students in private undergraduate colleges: 83
Here:
15.6%
Indiana:
22.3%
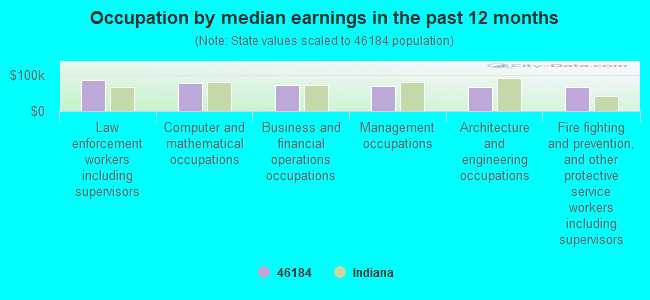
Occupation by median earnings in the past 12 months ($)
85,425Law enforcement workers including supervisors
77,353Computer and mathematical occupations
71,402Business and financial operations occupations
68,452Management occupations
67,135Architecture and engineering occupations
65,432Fire fighting and prevention, and other protective service workers including supervisors
Companies with federal contracts located in this zip code:
C & P FIREARMS (989 N US 31, SUITE 7 in WHITELAND, IN; small business) : $440,378 in 11 contractsfrom 2002 to 2004
Contracts for Camouflage and Deception Equipment, Individual Equipment by Department of Defense, U.S. Special Operations Command, Navy Signed by year:2000: $0; 2001: $0; 2002: $113,760; 2003: $265,569; 2004: $61,049; 2005: $0; 2006: $0.
Biggest contracts:
$113,760 with Department of Defense for Camouflage and Deception Equipment. Signed on 2002-05-17. Completion date: 2002-07-02.
$75,094 with U.S. Special Operations Command for Individual Equipment. Signed on 2003-11-20. Completion date: 2003-12-31.
$68,249 with Department of Defense for Individual Equipment. Signed on 2003-02-28. Completion date: 2003-03-26.
$31,982 with U.S. Special Operations Command for Individual Equipment. Signed on 2004-02-17. Completion date: 2004-04-05.
Top industries in this zip code by the number of employees in 2005:
Detailed PMIC statistics for the following Tracts:6101.00
, 6105.00
2002 - 2018 National Fire Incident Reporting System (NFIRS) incidents
According to the data from the years 2002 - 2018 the average number of fire incidents per year is 45. The highest number of reported fire incidents - 91 took place in 2007, and the least - 11 in 2015. The data has a growing trend.
When looking into fire subcategories, the most incidents belonged to: Structure Fires (38.8%), and Outside Fires (32.3%).
Fire incident types reported to NFIRS in Zip Code 46184


 Nearest zip codes: 46143, 46131, 46237, 46162, 46142, 46259.


 According to the data from the years 2002 - 2018 the average number of fire incidents per year is 45. The highest number of reported fire incidents - 91 took place in 2007, and the least - 11 in 2015. The data has a growing trend.
 When looking into fire subcategories, the most incidents belonged to: Structure Fires (38.8%), and Outside Fires (32.3%).