Estimated zip code population in 2022: 42,525 Zip code population in 2010: 39,624 Zip code population in 2000: 29,770
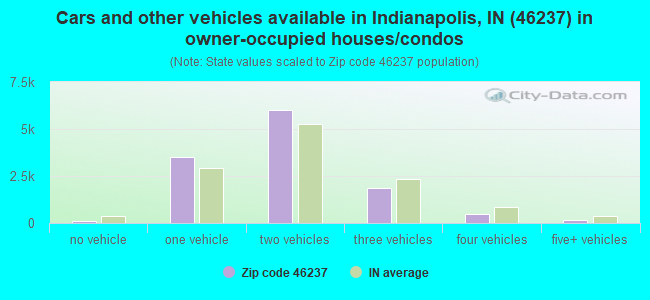
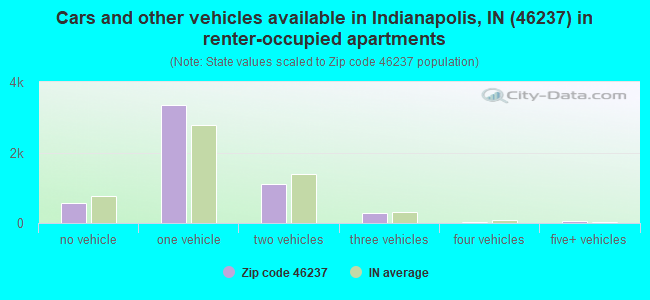
Houses and condos: 17,675 Renter-occupied apartments: 5,335
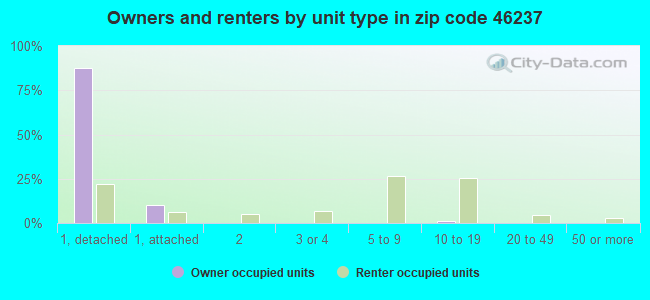
% of renters here:
31%
State:
29%
March 2022 cost of living index in zip code 46237: 87.9 (less than average, U.S. average is 100)
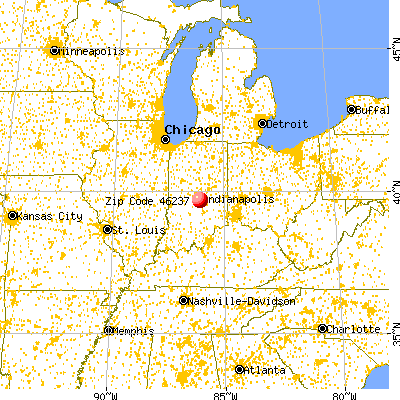
Land area: 14.9 sq. mi. Water area: 0.0 sq. mi.
Population density: 2,861 people per square mile
(average).
OSM Map
General Map
Google Map
MSN Map
OSM Map
General Map
Google Map
MSN Map
OSM Map
General Map
Google Map
MSN Map
OSM Map
General Map
Google Map
MSN Map
Please wait while loading the map...
Real estate property taxes paid for housing units in 2022:
This zip code:
1.0% ($2,240)
Indiana:
0.7% ($1,467)
Median real estate property taxes paid for housing units with mortgages in 2022: $2,268 (1.0%) Median real estate property taxes paid for housing units with no mortgage in 2022: $2,236 (1.2%)
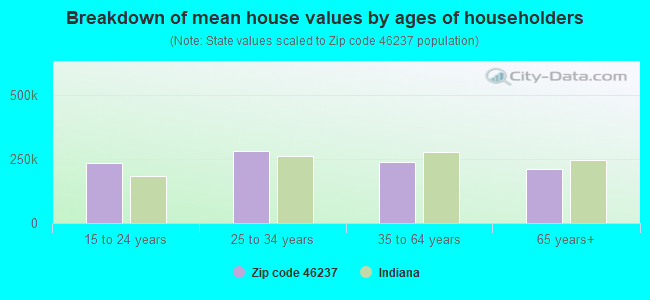
Estimated median house/condo value in 2022: $223,136
46237:
$223,136
Indiana:
$208,700
According to our research of Indiana and other state lists, there were 2 registered sex offenders living in 46237 zip code as of April 27, 2024. The ratio of all residents to sex offenders in zip code 46237 is 20,182 to 1. The ratio of registered sex offenders to all residents in this zip code is much lower than the state average.
Median resident age:
This zip code:
36.1 years
Indiana median age:
38.2 years
Average household size:
This zip code:
2.4 people
Indiana:
2.4 people
Averages for the 2020 tax year for zip code 46237, filed in 2021:
Average Adjusted Gross Income (AGI) in 2020: $65,588 (Individual Income Tax Returns)
Here:
$65,588
State:
$64,978
Salary/wage: $58,818 (reported on 83.8% of returns)
Here:
$58,818
State:
$55,245
(% of AGI for various income ranges: 1050.1% for AGIs below $25k, 3573.5% for AGIs $25k-50k, 6366.8% for AGIs $50k-75k, 9381.4% for AGIs $75k-100k, 17613.0% for AGIs $100k-200k, 82884.5% for AGIs over 200k)
Taxable interest for individuals: $1,013 (reported on 24.6% of returns)
This zip code:
$1,013
Indiana:
$1,351
(% of AGI for various income ranges: 9.1% for AGIs below $25k, 10.6% for AGIs $25k-50k, 15.8% for AGIs $50k-75k, 31.7% for AGIs $75k-100k, 60.1% for AGIs $100k-200k, 1173.0% for AGIs over 200k)
Ordinary dividends: $4,027 (reported on 14.9% of returns)
Here:
$4,027
State:
$5,827
(% of AGI for various income ranges: 21.6% for AGIs below $25k, 19.6% for AGIs $25k-50k, 51.0% for AGIs $50k-75k, 77.4% for AGIs $75k-100k, 147.7% for AGIs $100k-200k, 2761.5% for AGIs over 200k)
Net capital gain/loss in AGI: +$19,858 (reported on 13.6% of returns)
Here:
+$19,858
State:
+$17,730
(% of AGI for various income ranges: 9.6% for AGIs below $25k, 21.5% for AGIs $25k-50k, 48.1% for AGIs $50k-75k, 119.4% for AGIs $75k-100k, 469.1% for AGIs $100k-200k, 22553.5% for AGIs over 200k)
Profit/loss from business: +$10,995 (reported on 13.5% of returns)
Here:
+$10,995
State:
+$12,144
(% of AGI for various income ranges: 122.3% for AGIs below $25k, 173.8% for AGIs $25k-50k, 156.1% for AGIs $50k-75k, 195.2% for AGIs $75k-100k, 372.3% for AGIs $100k-200k, 1524.5% for AGIs over 200k)
Taxable individual retirement arrangement distribution: $16,874 (reported on 8.5% of returns)
46237:
$16,874
Indiana:
$18,302
(% of AGI for various income ranges: 60.6% for AGIs below $25k, 78.5% for AGIs $25k-50k, 167.6% for AGIs $50k-75k, 308.6% for AGIs $75k-100k, 523.6% for AGIs $100k-200k, 2113.5% for AGIs over 200k)
Self-employed (Keogh) retirement plans: $22,275 (reported on 0.2% of returns)
46237:
$22,275
Indiana:
$27,160
(% of AGI for various income ranges: 46.2% for AGIs $100k-200k)
Total itemized deductions: $37,456 (reported on 5.1% of returns)
Here:
$37,456
State:
$35,601
(% of AGI for various income ranges: 28.8% for AGIs below $25k, 71.0% for AGIs $25k-50k, 155.4% for AGIs $50k-75k, 257.5% for AGIs $75k-100k, 530.9% for AGIs $100k-200k, 9071.5% for AGIs over 200k)
Charity contributions: $22,524 (reported on 4.1% of returns)
Here:
$22,524
State:
$15,596
(% of AGI for various income ranges: 2.9% for AGIs below $25k, 11.5% for AGIs $25k-50k, 35.3% for AGIs $50k-75k, 56.2% for AGIs $75k-100k, 178.0% for AGIs $100k-200k, 7165.5% for AGIs over 200k)
Taxes paid: $7,042 (reported on 5.1% of returns)
46237:
$7,042
State:
$7,542
(% of AGI for various income ranges: 2.8% for AGIs below $25k, 10.3% for AGIs $25k-50k, 34.7% for AGIs $50k-75k, 68.9% for AGIs $75k-100k, 165.5% for AGIs $100k-200k, 949.5% for AGIs over 200k)
Earned income credit: $2,286 (reported on 13.2% of returns)
Here:
$2,286
State:
$2,298
(% of AGI for various income ranges: 72.0% for AGIs below $25k, 64.9% for AGIs $25k-50k, 1.9% for AGIs $50k-75k)
Percentage of individuals using paid preparers for their 2020 taxes: 94.1%
Here:
94%
State:
94%
(% for various income ranges: 92.4% for AGIs below $25k, 94.9% for AGIs $25k-50k, 95.2% for AGIs $50k-75k, 94.1% for AGIs $75k-100k, 94.6% for AGIs $100k-200k, 94.9% for AGIs over 200k)
Averages for the 2012 tax year for zip code 46237, filed in 2013:
Average Adjusted Gross Income (AGI) in 2012: $55,748 (Individual Income Tax Returns)
Here:
$55,748
State:
$52,932
Salary/wage: $48,073 (reported on 87.5% of returns)
Here:
$48,073
State:
$45,173
(% of AGI for various income ranges: 74.6% for AGIs below $25k, 83.4% for AGIs $25k-50k, 83.5% for AGIs $50k-75k, 85.2% for AGIs $75k-100k, 83.7% for AGIs $100k-200k, 35.9% for AGIs over 200k)
Taxable interest for individuals: $1,055 (reported on 27.0% of returns)
This zip code:
$1,055
Indiana:
$1,311
(% of AGI for various income ranges: 0.9% for AGIs below $25k, 0.3% for AGIs $25k-50k, 0.3% for AGIs $50k-75k, 0.3% for AGIs $75k-100k, 0.4% for AGIs $100k-200k, 1.2% for AGIs over 200k)
Ordinary dividends: $3,008 (reported on 15.4% of returns)
Here:
$3,008
State:
$4,690
(% of AGI for various income ranges: 1.1% for AGIs below $25k, 0.5% for AGIs $25k-50k, 0.6% for AGIs $50k-75k, 0.5% for AGIs $75k-100k, 0.7% for AGIs $100k-200k, 1.8% for AGIs over 200k)
Net capital gain/loss in AGI: +$14,464 (reported on 11.0% of returns)
Here:
+$14,464
State:
+$10,406
(% of AGI for various income ranges: 0.1% for AGIs $25k-50k, 0.2% for AGIs $50k-75k, 0.2% for AGIs $75k-100k, 0.6% for AGIs $100k-200k, 16.3% for AGIs over 200k)
Profit/loss from business: +$9,819 (reported on 12.1% of returns)
Here:
+$9,819
State:
+$11,105
(% of AGI for various income ranges: 6.0% for AGIs below $25k, 2.2% for AGIs $25k-50k, 1.7% for AGIs $50k-75k, 1.5% for AGIs $75k-100k, 1.7% for AGIs $100k-200k, 1.9% for AGIs over 200k)
Taxable individual retirement arrangement distribution: $12,826 (reported on 8.9% of returns)
46237:
$12,826
Indiana:
$13,841
(% of AGI for various income ranges: 2.9% for AGIs below $25k, 2.0% for AGIs $25k-50k, 2.1% for AGIs $50k-75k, 2.2% for AGIs $75k-100k, 2.5% for AGIs $100k-200k, 0.9% for AGIs over 200k)
Self-employment retirement plans: $23,950 (reported on 0.2% of returns)
46237:
$23,950
Indiana:
$21,482
Total itemized deductions: $19,003 (19% of AGI, reported on 32.7% of returns)
Here:
$19,003
State:
$20,913
Here:
18.7% of AGI
State:
18.2% of AGI
(% of AGI for various income ranges: 7.9% for AGIs below $25k, 8.3% for AGIs $25k-50k, 10.3% for AGIs $50k-75k, 11.8% for AGIs $75k-100k, 13.2% for AGIs $100k-200k, 12.8% for AGIs over 200k)
Charity contributions: $3,937 (reported on 25.8% of returns)
Here:
$3,937
State:
$4,697
(% of AGI for various income ranges: 0.8% for AGIs below $25k, 0.9% for AGIs $25k-50k, 1.4% for AGIs $50k-75k, 1.6% for AGIs $75k-100k, 2.3% for AGIs $100k-200k, 3.3% for AGIs over 200k)
Taxes paid: $6,809 (reported on 32.6% of returns)
46237:
$6,809
State:
$7,456
(% of AGI for various income ranges: 1.2% for AGIs below $25k, 2.2% for AGIs $25k-50k, 3.2% for AGIs $50k-75k, 4.1% for AGIs $75k-100k, 5.5% for AGIs $100k-200k, 5.6% for AGIs over 200k)
Earned income credit: $2,127 (reported on 14.5% of returns)
Here:
$2,127
State:
$2,265
(% of AGI for various income ranges: 5.3% for AGIs below $25k, 0.9% for AGIs $25k-50k)
Percentage of individuals using paid preparers for their 2012 taxes: 42.8%
Here:
43%
State:
53%
(% for various income ranges: 40.9% for AGIs below $25k, 41.7% for AGIs $25k-50k, 42.4% for AGIs $50k-75k, 44.4% for AGIs $75k-100k, 46.9% for AGIs $100k-200k, 65.5% for AGIs over 200k)
Averages for the 2004 tax year for zip code 46237, filed in 2005:
Average Adjusted Gross Income (AGI) in 2004: $48,279 (Individual Income Tax Returns)
Here:
$48,279
State:
$44,790
Salary/wage: $45,314 (reported on 90.3% of returns)
Here:
$45,314
State:
$39,615
(% of AGI for various income ranges: 110.4% for AGIs below $10k, 77.1% for AGIs $10k-25k, 87.0% for AGIs $25k-50k, 89.5% for AGIs $50k-75k, 90.2% for AGIs $75k-100k, 75.5% for AGIs over 100k)
Taxable interest for individuals: $1,048 (reported on 41.6% of returns)
This zip code:
$1,048
Indiana:
$1,535
(% of AGI for various income ranges: 3.7% for AGIs below $10k, 1.9% for AGIs $10k-25k, 0.8% for AGIs $25k-50k, 0.4% for AGIs $50k-75k, 0.7% for AGIs $75k-100k, 1.2% for AGIs over 100k)
Taxable dividends: $1,767 (reported on 19.0% of returns)
Here:
$1,767
State:
$2,998
(% of AGI for various income ranges: 2.5% for AGIs below $10k, 1.2% for AGIs $10k-25k, 0.5% for AGIs $25k-50k, 0.3% for AGIs $50k-75k, 0.4% for AGIs $75k-100k, 1.3% for AGIs over 100k)
Net capital gain/loss: +$4,925 (reported on 14.1% of returns)
Here:
+$4,925
State:
+$8,619
(% of AGI for various income ranges: -1.4% for AGIs below $10k, 0.2% for AGIs $10k-25k, 0.3% for AGIs $25k-50k, 0.6% for AGIs $50k-75k, 0.5% for AGIs $75k-100k, 4.1% for AGIs over 100k)
Profit/loss from business: +$8,857 (reported on 12.5% of returns)
Here:
+$8,857
State:
+$10,071
(% of AGI for various income ranges: 4.2% for AGIs below $10k, 3.8% for AGIs $10k-25k, 2.1% for AGIs $25k-50k, 1.9% for AGIs $50k-75k, 1.5% for AGIs $75k-100k, 2.9% for AGIs over 100k)
IRA payment deduction: $2,623 (reported on 1.8% of returns)
46237:
$2,623
Indiana:
$2,840
(% of AGI for various income ranges: 0.3% for AGIs below $10k, 0.1% for AGIs $10k-25k, 0.1% for AGIs $25k-50k, 0.1% for AGIs $50k-75k, 0.1% for AGIs $75k-100k, 0.1% for AGIs over 100k)
Self-employed pension: $12,873 (reported on 0.3% of returns)
Here:
$12,873
Indiana:
$15,305
Total itemized deductions: $15,900 (21% of AGI, reported on 44.8% of returns)
Here:
$15,900
State:
$17,065
Here:
21.5% of AGI
State:
19.5% of AGI
(% of AGI for various income ranges: 13.4% for AGIs below $10k, 11.3% for AGIs $10k-25k, 12.9% for AGIs $25k-50k, 15.2% for AGIs $50k-75k, 15.8% for AGIs $75k-100k, 15.9% for AGIs over 100k)
Charity contributions deductions: $2,545 (3% of AGI, reported on 37.5% of returns)
Here:
$2,545
State:
$3,550
Here:
3.3% of AGI
State:
3.8% of AGI
(% of AGI for various income ranges: 0.7% for AGIs below $10k, 1.1% for AGIs $10k-25k, 1.3% for AGIs $25k-50k, 1.7% for AGIs $50k-75k, 1.9% for AGIs $75k-100k, 3.1% for AGIs over 100k)
Total tax: $6,302 (reported on 80.1% of returns)
46237:
$6,302
State:
$6,914
(% of AGI for various income ranges: 2.9% for AGIs below $10k, 4.2% for AGIs $10k-25k, 7.2% for AGIs $25k-50k, 8.9% for AGIs $50k-75k, 10.2% for AGIs $75k-100k, 16.4% for AGIs over 100k)
Earned income credit: $1,634 (reported on 10.0% of returns)
Here:
$1,634
State:
$1,685
Percentage of individuals using paid preparers for their 2004 taxes: 48.2%
Here:
48%
State:
59%
(% for various income ranges: 39.8% for AGIs below $10k, 52.7% for AGIs $10k-25k, 48.6% for AGIs $25k-50k, 49.3% for AGIs $50k-75k, 48.5% for AGIs $75k-100k, 50.3% for AGIs over 100k)
Likely homosexual households (counted as self-reported same-sex unmarried-partner households)
Lesbian couples: 0.6% of all households
Gay men: 0.3% of all households
Household received Food Stamps/SNAP in the past 12 months: 971 Household did not receive Food Stamps/SNAP in the past 12 months: 16,464
Women who had a birth in the past 12 months: 632 (667 now married, 13 unmarried) Women who did not have a birth in the past 12 months: 9,603 (4,174 now married, 5,429 unmarried)
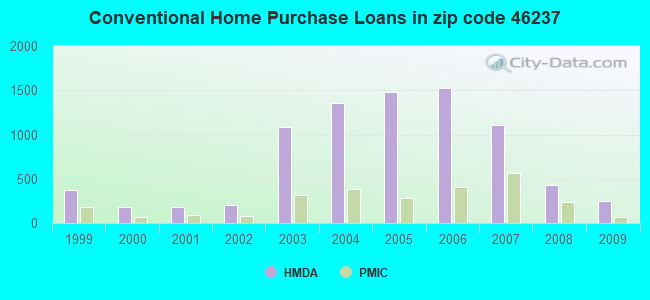
Housing units in zip code 46237 with a mortgage: 8,697 (674 second mortgage, 641 both second mortgage and home equity loan) Houses without a mortgage: 173
Median monthly owner costs for units with a mortgage: $1,311 Median monthly owner costs for units without a mortgage: $579
Residents with income below the poverty level in 2022:
This zip code:
7.3%
Whole state:
12.6%
Residents with income below 50% of the poverty level in 2022:
This zip code:
3.9%
Whole state:
6.3%
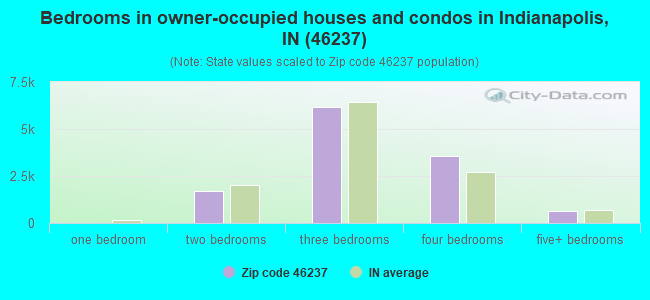
Median number of rooms in houses and condos:
Here:
6.6
State:
6.6
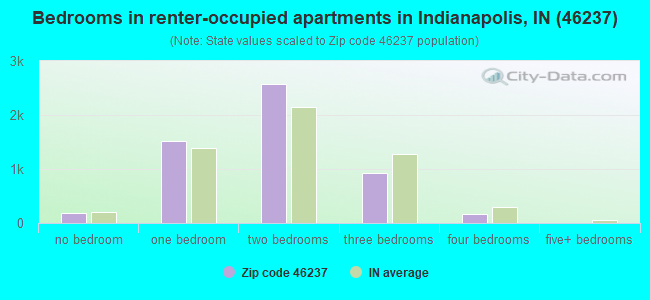
Median number of rooms in apartments:
Here:
4.2
State:
4.3
Notable locations in this zip code not listed on our city pages
Notable locations in zip code 46237: Southport Commons Retail Center (A), South Point Professional Center (B), Smock Golf Course (C), Altenheim Community Home (D), Franklin Township Hall (E), Franklin Township Fire Department Station 53 (F), Franklin Township Fire Department Station 54 (G), Perry Township Fire Department Station 663 (H). Display/hide their locations on the map
Shopping Centers: South Pointe Commons Shopping Center (1), Emerson Plaza Shopping Center (2), Southport Crossing Shopping Center (3). Display/hide their locations on the map
Churches in zip code 46237 include: Bethany Independent Christian Church (A), Beech Grove Church of God (B), Arlington Avenue Baptist Church (C), Parc-Way Assembly of God Church (D), University Heights Baptist Church (E), Peace Baptist Church (F), Gray Road Baptist Church (G), Hansing Park Christian Church (H). Display/hide their locations on the map
Streams, rivers, and creeks: Horn Creek (A), Grove Creek (B), Feather Run (C), Carson Creek (D), Bunker Creek (E), Merry Branch (F), Buckley Branch (G), Beech Creek (H). Display/hide their locations on the map
In group quarters: 328 (-1 institutionalized population)
Size of family households: 5,298 2-persons, 2,484 3-persons, 1,770 4-persons, 903 5-persons, 558 6-persons, 139 7-or-more-persons
Size of nonfamily households: 5,461 1-person, 766 2-persons, 87 3-persons
7,282 married couples with children.
2,042 single-parent households (790 men, 1,252 women).
85.5% of residents of 46237 zip code speak English at home.
4.8% of residents speak Spanish at home (50% very well, 15% well, 32% not well, 3% not at all).
3.7% of residents speak other Indo-European language at home (58% very well, 36% well, 4% not well, 2% not at all).
5.1% of residents speak Asian or Pacific Island language at home (56% very well, 26% well, 14% not well, 4% not at all).
1.0% of residents speak other language at home (42% very well, 16% well, 34% not well, 9% not at all).
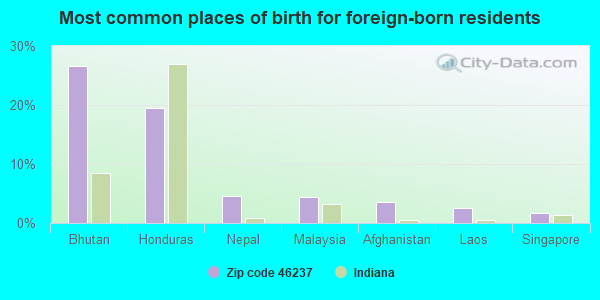
Foreign born population: 4,788 (11.3%) (43.3% of them are naturalized citizens)
Facilities with environmental interests located in this zip code:
LUTHERAN HS (5555 S ARLINGTON in INDIANAPOLIS, IN)
(Integrated Compliance Information System) - ICIS-05-1994-0302, FORMAL ENFORCEMENT ACTION STATE MASTER (Indiana facility tracking) COMPLIANCE ACTIVITY (Tracking inspections of insecticide, fungicide, and rodenticide, and toxic substances)
AMOCO SERVICE STATION 572 (4025 E SOUTHPORT RD in INDIANAPOLIS, IN)
STATE MASTER (Indiana facility tracking) - CRTK-7597, EPCRA, LUST-199010554, LEAKING STORAGE TANK, UST-1079, UNDERGROUND STORAGE TANK PROGRAM Conditionally Exempt Small Quantity Generators, less than 100 kg/month of hazardous waste (Resource Conservation and Recovery Act (tracking hazardous waste)) - notification Organizations: AMOCO OIL COMPANY (CONTACT/OWNER)
Alternative names: AMOCO OIL CO SS 572
BUNKER HILL ELEMENTARY SCHOOL (6620 SHELBYVILLE RD in INDIANAPOLIS, IN)
(Geographic Names Information System) (National Center for Education Statistics) - STATE ID-5205 Organizations: FRANKLIN TOWNSHIP COM SCH CORP (SCHOOL DISTRICT)
MEIJER GAS STATION 134 (5303 E SOUTHPORT RD in INDIANAPOLIS, IN)
STATE MASTER (Indiana facility tracking) - UST-22423, UNDERGROUND STORAGE TANK PROGRAM Conditionally Exempt Small Quantity Generators, less than 100 kg/month of hazardous waste (Resource Conservation and Recovery Act (tracking hazardous waste)) - notification Organizations: MEIJER STORES LTD PARTNERSHIP (CONTACT/OWNER)
Alternative names: MEIJER 134 GAS STA
ARLINGTON ELEMENTARY SCHOOL (5814 S ARLINGTON AVE in INDIANAPOLIS, IN)
(National Center for Education Statistics) - STATE ID-5202 Organizations: FRANKLIN TOWNSHIP COM SCH CORP (SCHOOL DISTRICT)
PRYOR CAMPGROUND (R.R. 1 in INDIANAPOLIS, IN)
(Integrated Compliance Information System) - ICIS-05-1997-0673, FORMAL ENFORCEMENT ACTION STATE MASTER (Indiana facility tracking)
MARY BRYAN ELEMENTARY SCH (4355 E STOP 11 RD in INDIANAPOLIS, IN)
(National Center for Education Statistics) - STATE ID-5322 Organizations: M S D PERRY TOWNSHIP (SCHOOL DISTRICT)
ANALYTICAL CHEMTECH INTL INC (5220 COMMERCE CIR in INDIANAPOLIS, IN)
STATE MASTER (Indiana facility tracking) (Resource Conservation and Recovery Act (tracking hazardous waste)) Organizations: FREDI AND SYBIL JAKOB (CONTACT/OWNER)
BP FACILITY #32632 (5030 SOUTHPORT XING in INDIANAPOLIS, IN)
Conditionally Exempt Small Quantity Generators, less than 100 kg/month of hazardous waste (Resource Conservation and Recovery Act (tracking hazardous waste)) Organizations: BP PRODUCTS NORTH AMERICA (CONTACT/OPERATOR)
PENSKE AUTO CENTER (5101 E THOMPSON RD in INDIANAPOLIS, IN)
STATE MASTER (Indiana facility tracking) Conditionally Exempt Small Quantity Generators, less than 100 kg/month of hazardous waste (Resource Conservation and Recovery Act (tracking hazardous waste)) - notification Organizations: PENSKE AUTO CENTER INC (CONTACT/OWNER)
NOLAND KEN PAINT CONTRACTORS (7417 CAROLLING WAY in INDIANAPOLIS, IN)
STATE MASTER (Indiana facility tracking) Conditionally Exempt Small Quantity Generators, less than 100 kg/month of hazardous waste (Resource Conservation and Recovery Act (tracking hazardous waste)) - notification Organizations: NOALND KEN (CONTACT/OWNER)
GRAY ROAD CHRISTIAN SCH (5500 S. GRAY ROAD in INDIANAPOLIS, IN)
STATE MASTER (Indiana facility tracking) COMPLIANCE ACTIVITY (Tracking inspections of insecticide, fungicide, and rodenticide, and toxic substances)
Housing units lacking complete plumbing facilities: 0.3% Housing units lacking complete kitchen facilities: 1.1%
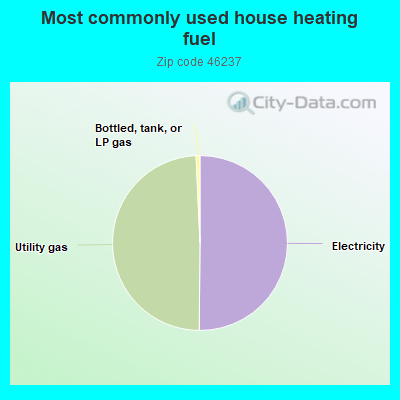
49.7%Electricity
48.7%Utility gas
0.7%Bottled, tank, or LP gas
Population in 1990: 18,919. Population change in the 1990s: +10,851 (+57.4%).
Place of birth for U.S.-born residents:
This state: 28,639
Northeast: 1,103
Midwest: 4,397
South: 2,304
West: 1,395
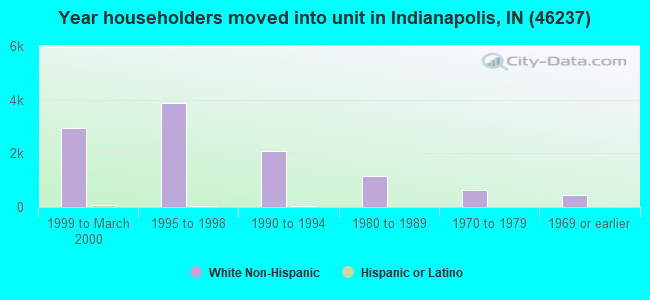
45% of the 46237 zip code residents lived in the same house 5 years ago. Out of people who lived in different houses, 67% lived in this county. Out of people who lived in different counties, 50% lived in Indiana.
91% of the 46237 zip code residents lived in the same house 1 year ago. Out of people who lived in different houses, 67% moved from this county. Out of people who lived in different houses, 19% moved from different county within same state. Out of people who lived in different houses, 11% moved from different state. Out of people who lived in different houses, 4% moved from abroad.
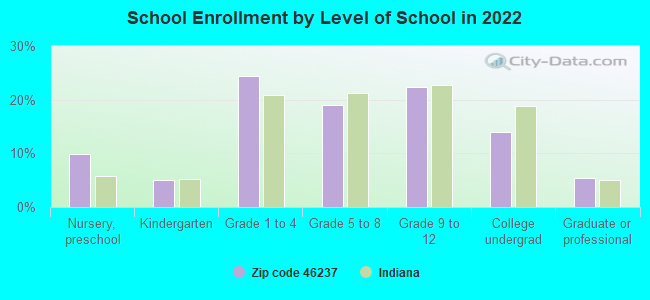
Private vs. public school enrollment:
Students in private schools in grades 1 to 8 (elementary and middle school): 857
Here:
19.6%
Indiana:
14.9%
Students in private schools in grades 9 to 12 (high school): 419
Here:
18.8%
Indiana:
11.4%
Students in private undergraduate colleges: 222
Here:
16.0%
Indiana:
22.3%
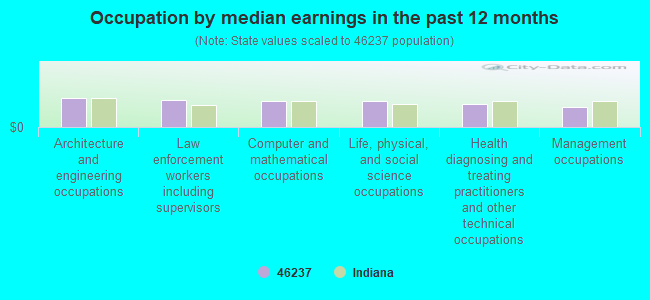
Occupation by median earnings in the past 12 months ($)
98,793Architecture and engineering occupations
93,520Law enforcement workers including supervisors
89,090Computer and mathematical occupations
89,038Life, physical, and social science occupations
77,993Health diagnosing and treating practitioners and other technical occupations
69,322Management occupations
Companies with federal contracts located in this zip code (INDIANAPOLIS, IN):
J F W INDUSTRIES INC (5134 COMMERCE SQUARE DR; small business) : $154,723 in 12 contractsfrom 2002 to 2006
Contracts for Electrical and Electronic Properties Measuring and Testing Instruments, Fuel Cell Power Units, Components,and Accessories, Hardware, Commercial, Miscellaneous Communication Equipment, and moreby Navy, Army, Geological Survey, Federal Technology Service, and others Signed by year:2000: $0; 2001: $0; 2002: $4,400; 2003: $54,980; 2004: $28,270; 2005: $38,543; 2006: $28,530.
Biggest contracts:
$30,980 with Navy for Electrical and Electronic Properties Measuring and Testing Instruments. Signed on 2003-04-10. Completion date: 2003-07-07.
$25,520 with Army for Fuel Cell Power Units, Components,and Accessories. Signed on 2004-11-16. Completion date: 2004-12-31.
$24,000 with Army for Hardware, Commercial. Signed on 2003-09-10. Completion date: 2003-11-26.
$19,800 with Navy for Miscellaneous Communication Equipment. Signed on 2006-03-15. Completion date: 2006-06-10.
MEREDITH MACHINERY INDIANA LLC (5351 E THOMPSON RD STE 241; small business) : $7,451 in 2 contractsfrom 2005 to 2006
$3,928 with Navy for Miscellaneous Secondary Metal Forming and Cutting Machines. Taking place in KY. Signed on 2006-04-06. Completion date: 2006-05-19.
$3,523, same as above.Signed on 2005-07-12. Completion date: 2005-07-15.
$3,982 with Army for Sound Recording and Reproducing Equipment. Taking place in GA. Signed on 2004-02-27. Completion date: 2004-03-05.
RESOURCE STAFFING, INC (5135 S EMERSON AVE STE E; small business) : $0 in 2 contractsin 2004
$206,128 with Defense Finance and Accounting Service for Other Administrative Support Services. Signed on 2004-10-01. Completion date: 2005-09-30.
-$206,128, same as above.Signed on 2004-10-01. Completion date: 2005-09-30.
Top industries in this zip code by the number of employees in 2005:
2002 - 2018 National Fire Incident Reporting System (NFIRS) incidents
Based on the data from the years 2002 - 2018 the average number of fire incidents per year is 67. The highest number of reported fires - 125 took place in 2009, and the least - 0 in 2014. The data has a rising trend.
When looking into fire subcategories, the most reports belonged to: Structure Fires (56.6%), and Outside Fires (26.8%).
Fire incident types reported to NFIRS in Zip Code 46237


 Nearest zip codes: 46107, 46227, 46203, 46143, 46239, 46259.


 Based on the data from the years 2002 - 2018 the average number of fire incidents per year is 67. The highest number of reported fires - 125 took place in 2009, and the least - 0 in 2014. The data has a rising trend.
 When looking into fire subcategories, the most reports belonged to: Structure Fires (56.6%), and Outside Fires (26.8%).