Estimated zip code population in 2022: 13,054 Zip code population in 2010: 12,774 Zip code population in 2000: 12,642
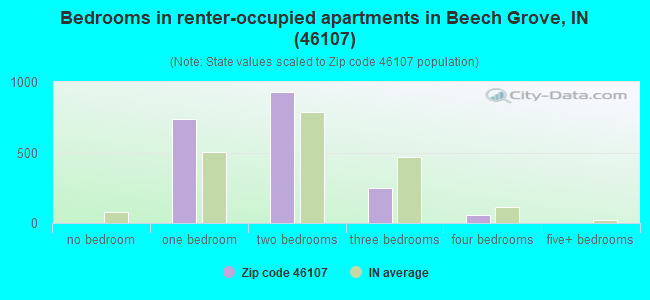
Houses and condos: 5,975 Renter-occupied apartments: 1,943
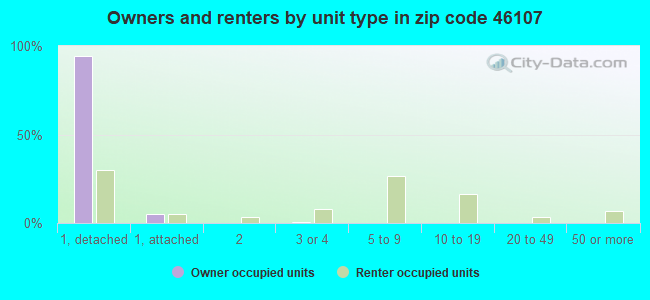
% of renters here:
36%
State:
29%
March 2022 cost of living index in zip code 46107: 87.0 (less than average, U.S. average is 100)
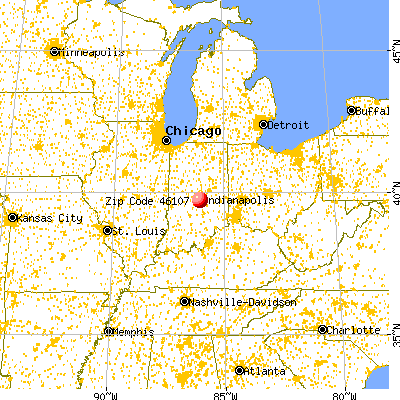
Land area: 3.2 sq. mi. Water area: 0.0 sq. mi.
Population density: 4,025 people per square mile
(average).
OSM Map
General Map
Google Map
MSN Map
OSM Map
General Map
Google Map
MSN Map
OSM Map
General Map
Google Map
MSN Map
OSM Map
General Map
Google Map
MSN Map
Please wait while loading the map...
Real estate property taxes paid for housing units in 2022:
This zip code:
0.9% ($1,497)
Indiana:
0.7% ($1,467)
Median real estate property taxes paid for housing units with mortgages in 2022: $1,413 (0.9%) Median real estate property taxes paid for housing units with no mortgage in 2022: $1,914 (1.2%)
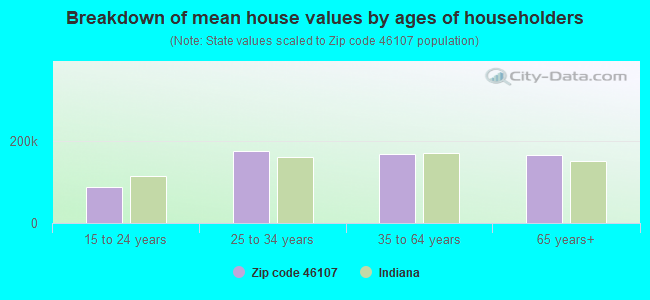
Estimated median house/condo value in 2022: $162,322
46107:
$162,322
Indiana:
$208,700
Median resident age:
This zip code:
36.9 years
Indiana median age:
38.2 years
Average household size:
This zip code:
2.3 people
Indiana:
2.4 people
Averages for the 2020 tax year for zip code 46107, filed in 2021:
Average Adjusted Gross Income (AGI) in 2020: $43,944 (Individual Income Tax Returns)
Here:
$43,944
State:
$64,978
Salary/wage: $41,711 (reported on 84.4% of returns)
Here:
$41,711
State:
$55,245
(% of AGI for various income ranges: 1056.4% for AGIs below $25k, 3589.6% for AGIs $25k-50k, 6392.2% for AGIs $50k-75k, 9705.2% for AGIs $75k-100k, 14042.9% for AGIs $100k-200k)
Taxable interest for individuals: $596 (reported on 17.9% of returns)
This zip code:
$596
Indiana:
$1,351
(% of AGI for various income ranges: 9.3% for AGIs below $25k, 9.7% for AGIs $25k-50k, 18.0% for AGIs $50k-75k, 11.0% for AGIs $75k-100k, 33.5% for AGIs $100k-200k)
Ordinary dividends: $2,269 (reported on 9.2% of returns)
Here:
$2,269
State:
$5,827
(% of AGI for various income ranges: 8.7% for AGIs below $25k, 10.6% for AGIs $25k-50k, 68.6% for AGIs $50k-75k, 30.8% for AGIs $75k-100k, 68.1% for AGIs $100k-200k)
Net capital gain/loss in AGI: +$4,713 (reported on 8.0% of returns)
Here:
+$4,713
State:
+$17,730
(% of AGI for various income ranges: 3.5% for AGIs below $25k, 12.4% for AGIs $25k-50k, 45.5% for AGIs $50k-75k, 67.0% for AGIs $75k-100k, 343.9% for AGIs $100k-200k)
Profit/loss from business: +$7,297 (reported on 10.1% of returns)
Here:
+$7,297
State:
+$12,144
(% of AGI for various income ranges: 83.6% for AGIs below $25k, 66.0% for AGIs $25k-50k, 103.3% for AGIs $50k-75k, 197.8% for AGIs $75k-100k, 150.6% for AGIs $100k-200k)
Taxable individual retirement arrangement distribution: $15,266 (reported on 6.7% of returns)
46107:
$15,266
Indiana:
$18,302
(% of AGI for various income ranges: 48.0% for AGIs below $25k, 53.2% for AGIs $25k-50k, 151.5% for AGIs $50k-75k, 250.0% for AGIs $75k-100k, 821.9% for AGIs $100k-200k)
Total itemized deductions: $32,411 (reported on 2.7% of returns)
Here:
$32,411
State:
$35,601
(% of AGI for various income ranges: 71.2% for AGIs $25k-50k, 161.3% for AGIs $50k-75k, 216.0% for AGIs $75k-100k, 721.6% for AGIs $100k-200k)
Charity contributions: $9,800 (reported on 2.0% of returns)
Here:
$9,800
State:
$15,596
(% of AGI for various income ranges: 7.6% for AGIs $25k-50k, 29.3% for AGIs $50k-75k, 53.0% for AGIs $75k-100k, 215.2% for AGIs $100k-200k)
Taxes paid: $6,061 (reported on 2.7% of returns)
46107:
$6,061
State:
$7,542
(% of AGI for various income ranges: 7.6% for AGIs $25k-50k, 24.9% for AGIs $50k-75k, 51.7% for AGIs $75k-100k, 170.0% for AGIs $100k-200k)
Earned income credit: $2,243 (reported on 19.4% of returns)
Here:
$2,243
State:
$2,298
(% of AGI for various income ranges: 91.5% for AGIs below $25k, 64.6% for AGIs $25k-50k, 1.4% for AGIs $50k-75k)
Percentage of individuals using paid preparers for their 2020 taxes: 93.6%
Here:
94%
State:
94%
(% for various income ranges: 93.0% for AGIs below $25k, 95.0% for AGIs $25k-50k, 92.7% for AGIs $50k-75k, 92.6% for AGIs $75k-100k, 93.0% for AGIs $100k-200k, 100.0% for AGIs over 200k)
Averages for the 2012 tax year for zip code 46107, filed in 2013:
Average Adjusted Gross Income (AGI) in 2012: $38,591 (Individual Income Tax Returns)
Here:
$38,591
State:
$52,932
Salary/wage: $36,740 (reported on 84.9% of returns)
Here:
$36,740
State:
$45,173
(% of AGI for various income ranges: 72.1% for AGIs below $25k, 83.1% for AGIs $25k-50k, 80.9% for AGIs $50k-75k, 82.8% for AGIs $75k-100k, 84.8% for AGIs $100k-200k, 67.4% for AGIs over 200k)
Taxable interest for individuals: $1,046 (reported on 21.6% of returns)
This zip code:
$1,046
Indiana:
$1,311
(% of AGI for various income ranges: 0.8% for AGIs below $25k, 0.4% for AGIs $25k-50k, 0.7% for AGIs $50k-75k, 0.9% for AGIs $75k-100k, 0.4% for AGIs $100k-200k)
Ordinary dividends: $2,018 (reported on 10.8% of returns)
Here:
$2,018
State:
$4,690
(% of AGI for various income ranges: 0.9% for AGIs below $25k, 0.4% for AGIs $25k-50k, 0.9% for AGIs $50k-75k, 0.3% for AGIs $75k-100k, 0.3% for AGIs $100k-200k)
Net capital gain/loss in AGI: +$1,726 (reported on 6.0% of returns)
Here:
+$1,726
State:
+$10,406
(% of AGI for various income ranges: 0.1% for AGIs $50k-75k, 0.8% for AGIs $75k-100k, 0.6% for AGIs $100k-200k)
Profit/loss from business: +$7,644 (reported on 10.0% of returns)
Here:
+$7,644
State:
+$11,105
(% of AGI for various income ranges: 6.1% for AGIs below $25k, 1.7% for AGIs $25k-50k, 1.1% for AGIs $50k-75k, 1.3% for AGIs $75k-100k, 1.0% for AGIs $100k-200k)
Taxable individual retirement arrangement distribution: $10,322 (reported on 9.2% of returns)
46107:
$10,322
Indiana:
$13,841
(% of AGI for various income ranges: 2.7% for AGIs below $25k, 2.0% for AGIs $25k-50k, 2.6% for AGIs $50k-75k, 2.7% for AGIs $75k-100k, 3.1% for AGIs $100k-200k)
Total itemized deductions: $15,328 (22% of AGI, reported on 20.8% of returns)
Here:
$15,328
State:
$20,913
Here:
22.0% of AGI
State:
18.2% of AGI
(% of AGI for various income ranges: 5.3% for AGIs below $25k, 6.6% for AGIs $25k-50k, 9.2% for AGIs $50k-75k, 8.6% for AGIs $75k-100k, 11.3% for AGIs $100k-200k, 12.1% for AGIs over 200k)
Charity contributions: $2,945 (reported on 15.4% of returns)
Here:
$2,945
State:
$4,697
(% of AGI for various income ranges: 0.6% for AGIs below $25k, 0.8% for AGIs $25k-50k, 1.6% for AGIs $50k-75k, 1.1% for AGIs $75k-100k, 1.9% for AGIs $100k-200k, 1.3% for AGIs over 200k)
Taxes paid: $4,808 (reported on 20.8% of returns)
46107:
$4,808
State:
$7,456
(% of AGI for various income ranges: 0.8% for AGIs below $25k, 1.7% for AGIs $25k-50k, 2.6% for AGIs $50k-75k, 3.1% for AGIs $75k-100k, 4.8% for AGIs $100k-200k, 5.2% for AGIs over 200k)
Earned income credit: $2,205 (reported on 22.4% of returns)
Here:
$2,205
State:
$2,265
(% of AGI for various income ranges: 6.8% for AGIs below $25k, 1.2% for AGIs $25k-50k)
Percentage of individuals using paid preparers for their 2012 taxes: 44.1%
Here:
44%
State:
53%
(% for various income ranges: 42.5% for AGIs below $25k, 43.9% for AGIs $25k-50k, 48.3% for AGIs $50k-75k, 44.7% for AGIs $75k-100k, 51.6% for AGIs $100k-200k)
Averages for the 2004 tax year for zip code 46107, filed in 2005:
Average Adjusted Gross Income (AGI) in 2004: $35,918 (Individual Income Tax Returns)
Here:
$35,918
State:
$44,790
Salary/wage: $34,400 (reported on 85.1% of returns)
Here:
$34,400
State:
$39,615
(% of AGI for various income ranges: 74.2% for AGIs below $10k, 73.4% for AGIs $10k-25k, 82.9% for AGIs $25k-50k, 85.4% for AGIs $50k-75k, 86.9% for AGIs $75k-100k, 74.9% for AGIs over 100k)
Taxable interest for individuals: $1,239 (reported on 36.7% of returns)
This zip code:
$1,239
Indiana:
$1,535
(% of AGI for various income ranges: 4.3% for AGIs below $10k, 2.3% for AGIs $10k-25k, 1.2% for AGIs $25k-50k, 0.9% for AGIs $50k-75k, 0.8% for AGIs $75k-100k, 1.1% for AGIs over 100k)
Taxable dividends: $1,350 (reported on 16.4% of returns)
Here:
$1,350
State:
$2,998
(% of AGI for various income ranges: 2.2% for AGIs below $10k, 1.0% for AGIs $10k-25k, 0.6% for AGIs $25k-50k, 0.4% for AGIs $50k-75k, 0.6% for AGIs $75k-100k, 0.4% for AGIs over 100k)
Net capital gain/loss: +$2,238 (reported on 10.6% of returns)
Here:
+$2,238
State:
+$8,619
(% of AGI for various income ranges: -0.9% for AGIs below $10k, 0.3% for AGIs $10k-25k, 0.4% for AGIs $25k-50k, 0.7% for AGIs $50k-75k, 1.0% for AGIs $75k-100k, 1.3% for AGIs over 100k)
Profit/loss from business: +$7,111 (reported on 9.7% of returns)
Here:
+$7,111
State:
+$10,071
(% of AGI for various income ranges: 2.1% for AGIs below $10k, 3.2% for AGIs $10k-25k, 2.3% for AGIs $25k-50k, 1.3% for AGIs $50k-75k, 1.7% for AGIs $75k-100k, 1.3% for AGIs over 100k)
IRA payment deduction: $1,810 (reported on 1.3% of returns)
46107:
$1,810
Indiana:
$2,840
Total itemized deductions: $13,660 (22% of AGI, reported on 28.5% of returns)
Here:
$13,660
State:
$17,065
Here:
22.3% of AGI
State:
19.5% of AGI
(% of AGI for various income ranges: 7.4% for AGIs below $10k, 9.1% for AGIs $10k-25k, 9.5% for AGIs $25k-50k, 11.4% for AGIs $50k-75k, 12.5% for AGIs $75k-100k, 12.9% for AGIs over 100k)
Charity contributions deductions: $2,309 (4% of AGI, reported on 23.3% of returns)
Here:
$2,309
State:
$3,550
Here:
3.6% of AGI
State:
3.8% of AGI
(% of AGI for various income ranges: 0.6% for AGIs below $10k, 0.9% for AGIs $10k-25k, 1.2% for AGIs $25k-50k, 1.8% for AGIs $50k-75k, 1.7% for AGIs $75k-100k, 2.1% for AGIs over 100k)
Total tax: $4,316 (reported on 74.5% of returns)
46107:
$4,316
State:
$6,914
(% of AGI for various income ranges: 1.5% for AGIs below $10k, 3.9% for AGIs $10k-25k, 7.2% for AGIs $25k-50k, 9.1% for AGIs $50k-75k, 10.7% for AGIs $75k-100k, 16.0% for AGIs over 100k)
Earned income credit: $1,733 (reported on 15.3% of returns)
Here:
$1,733
State:
$1,685
Percentage of individuals using paid preparers for their 2004 taxes: 50.5%
Here:
50%
State:
59%
(% for various income ranges: 42.4% for AGIs below $10k, 53.2% for AGIs $10k-25k, 52.2% for AGIs $25k-50k, 50.6% for AGIs $50k-75k, 51.9% for AGIs $75k-100k, 56.6% for AGIs over 100k)
Household received Food Stamps/SNAP in the past 12 months: 674 Household did not receive Food Stamps/SNAP in the past 12 months: 4,785
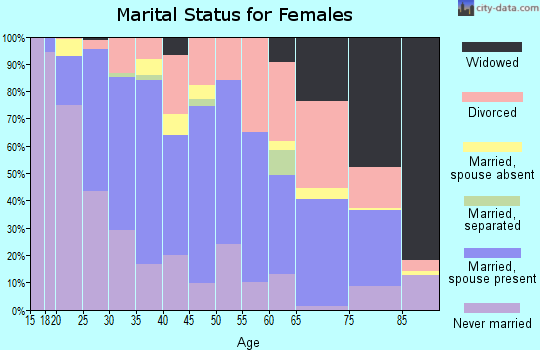
Women who had a birth in the past 12 months: 215 (118 now married, 90 unmarried) Women who did not have a birth in the past 12 months: 2,862 (1,100 now married, 1,759 unmarried)
Housing units in zip code 46107 with a mortgage: 2,492 (148 second mortgage, 125 both second mortgage and home equity loan) Houses without a mortgage: 39
Median monthly owner costs for units with a mortgage: $1,095 Median monthly owner costs for units without a mortgage: $467
Residents with income below the poverty level in 2022:
This zip code:
9.2%
Whole state:
12.6%
Residents with income below 50% of the poverty level in 2022:
This zip code:
5.1%
Whole state:
6.3%
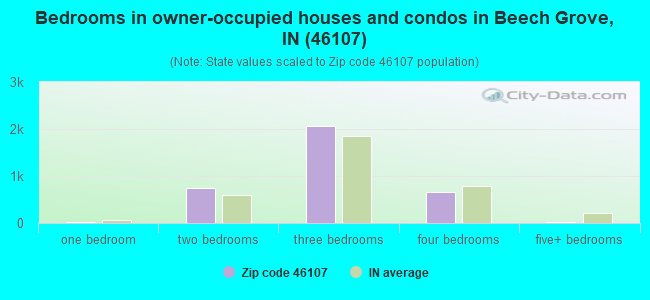
Median number of rooms in houses and condos:
Here:
6.2
State:
6.6
Median number of rooms in apartments:
Here:
4.2
State:
4.3
Notable locations in this zip code not listed on our city pages
Notable locations in zip code 46107: Select Specialty Hospital Beech Grove Campus (A), Beech Grove Public Library (B), Beech Grove Fire Department Station 102 (C). Display/hide their locations on the map
Churches in zip code 46107 include: First Christian Church (A), Southwood Baptist Church (B), Beech Grove Wesleyan Church (C), Holy Name Roman Catholic Church (D), Faith Assembly of God Church (E), Beech Grove United Methodist Church (F), First Baptist Church (G), Park Grove Baptist Church (H), Fellowship of Christ (I). Display/hide their locations on the map
In group quarters: 244 (-1 institutionalized population)
Size of family households: 1,404 2-persons, 748 3-persons, 482 4-persons, 398 5-persons, 42 6-persons, 59 7-or-more-persons
Size of nonfamily households: 1,916 1-person, 393 2-persons, 13 3-persons
1,851 married couples with children.
881 single-parent households (249 men, 632 women).
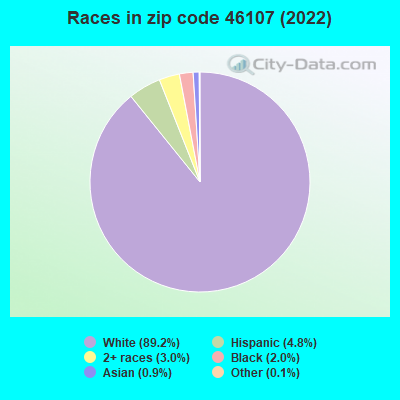
96.1% of residents of 46107 zip code speak English at home.
1.6% of residents speak Spanish at home (55% very well, 43% well, 3% not at all).
1.1% of residents speak other Indo-European language at home (35% very well, 44% well, 21% not well).
0.3% of residents speak Asian or Pacific Island language at home (62% very well, 38% well).
0.2% of residents speak other language at home (100% very well).
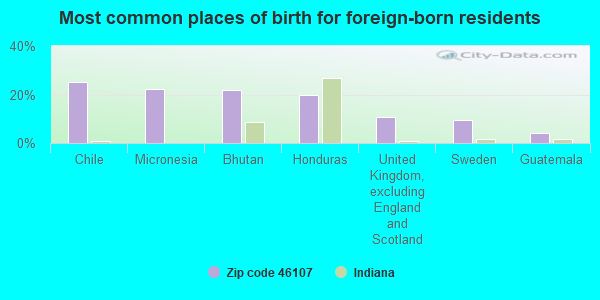
Foreign born population: 417 (3.2%) (58.4% of them are naturalized citizens)
This zip code:
3.2%
Whole state:
6.1%
25%Chile
22%Micronesia
22%Bhutan
20%Honduras
11%United Kingdom, excluding England and Scotland
10%Sweden
4%Guatemala
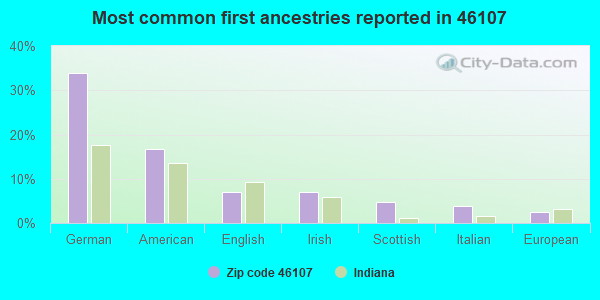
34%German
17%American
7%English
7%Irish
5%Scottish
4%Italian
2%European
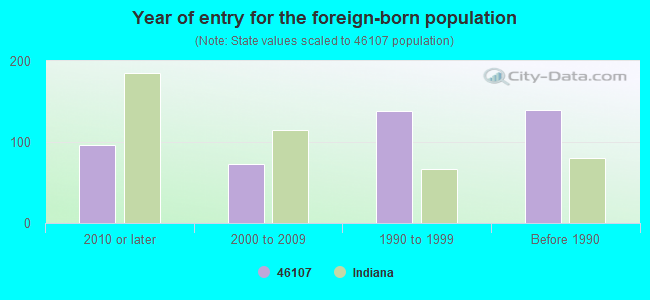
Year of entry for the foreign-born population
962010 or later
732000 to 2009
1381990 to 1999
140Before 1990
Major facilities with environmental interests located in this zip code:
AMTRAK NATIONAL RAILROAD PASSANER SERVICE (202 WALTER A BARRICK WAY in BEECH GROVE, IN)
AIR SYNTHETIC MINOR (AIRS/AFS) - ICIS-, ENFORCEMENT/COMPLIANCE ACTIVITY STATE MASTER (Indiana facility tracking) - CRTK-802, EPCRA, LUST-199507507, LEAKING STORAGE TANK, LUST-199808537, SPILL-199005060, RELEASE ASSESSMENT, UST-1139, UNDERGROUND STORAGE TANK PROGRAM CRITERIA AND HAZARDOUS AIR POLLUTANT INVENTORY (Inventory of air pollution sources) HAZARDOUS WASTE BIENNIAL REPORTER (Resource Conservation and Recovery Act (tracking hazardous waste)) - ICIS-, ENFORCEMENT/COMPLIANCE ACTIVITY, ICIS-05-2004-1080, FORMAL ENFORCEMENT ACTION Large Quantity Generators, more that 1000 kg of hazardous waste/month (Resource Conservation and Recovery Act (tracking hazardous waste)) - notification - ICIS-, ENFORCEMENT/COMPLIANCE ACTIVITY, ICIS-05-2004-1080, FORMAL ENFORCEMENT ACTION Business SIC classification: RAILROAD EQUIPMENT; RAILROADS, LINE-HAUL OPERATING Business NAICS classification: LINE-HAUL RAILROADS.; LINE-HAUL RAILROADS. Organizations: NATIONAL RAILROAD PASSENGER CORP (CONTACT/OPERATOR)
, NATIONAL RAILROAD PASSENGER CORPORATION (CONTACT/OWNER)
Alternative names: NATL RR PASSENGER CORP
BEECH GROVE SHELL (4420 S EMERSON in BEECH GROVE, IN)
STATE MASTER (Indiana facility tracking) - LUST-199704507, LEAKING STORAGE TANK, UST-171, UNDERGROUND STORAGE TANK PROGRAM, CRTK-4176, EPCRA, LUST-199203501, LEAKING STORAGE TANK (Resource Conservation and Recovery Act (tracking hazardous waste)) Organizations: SHELL OIL COMPANY (CONTACT/OWNER)
Alternative names: SHELL SVC STA
CTC ANALYTICAL SERVICES (350 E CHURCHMAN AVE in BEECH GROVE, IN)
STATE MASTER (Indiana facility tracking) - UST-14402, UNDERGROUND STORAGE TANK PROGRAM HAZARDOUS WASTE BIENNIAL REPORTER (Resource Conservation and Recovery Act (tracking hazardous waste)) TSD (Resource Conservation and Recovery Act (tracking hazardous waste)) - notification Organizations: LUBRICANT CONSULTANTS (CONTACT/OWNER)
Alternative names: LUBRICANT CONSULTANTS INC
CLARK OIL #1993 (245 S 1ST AVE in BEECH GROVE, IN)
STATE MASTER (Indiana facility tracking) - CRTK-8797, EPCRA, UST-2952, UNDERGROUND STORAGE TANK PROGRAM Conditionally Exempt Small Quantity Generators, less than 100 kg/month of hazardous waste (Resource Conservation and Recovery Act (tracking hazardous waste)) - notification Organizations: CLARK RETAIL ENTERPRISES INC (CONTACT/OWNER)
Alternative names: CLARK STORE 1993
COUNTRYMARK COOP INC (1091 S SHERMAN DR in BEECH GROVE, IN)
AIR SYNTHETIC MINOR (AIRS/AFS) STATE MASTER (Indiana facility tracking) - ACES-OP-09700028, AIR PROGRAM CRITERIA AND HAZARDOUS AIR POLLUTANT INVENTORY (Inventory of air pollution sources) Business SIC classification: GRAIN AND FIELD BEANS
CENTRAL ELEMENTARY SCHOOL (1000 MAIN ST in BEECH GROVE, IN)
(National Center for Education Statistics) - STATE ID-5457 Organizations: BEECH GROVE CITY SCHOOLS (SCHOOL DISTRICT)
COMTEST SYSTEMS INC (5602 ELMWOOD AVE STE 20 in BEECH GROVE, IN)
STATE MASTER (Indiana facility tracking) (Resource Conservation and Recovery Act (tracking hazardous waste)) Organizations: ABBOTT LOUIS W (CONTACT/OWNER)
CONRAIL BEECH GROVE MECH REPAIR FAC (1ST AND MAIN ST in BEECH GROVE, IN)
STATE MASTER (Indiana facility tracking) (Resource Conservation and Recovery Act (tracking hazardous waste)) Organizations: CONSOLIDATED RAIL CORPORATION (CONTACT/OWNER)
CONRAIL BEECH GROVE SHOP (1ST AND MAIN ST in BEECH GROVE, IN)
STATE MASTER (Indiana facility tracking) (Resource Conservation and Recovery Act (tracking hazardous waste)) Organizations: CONSOLIDATED RAIL CORPORATION (CONTACT/OWNER)
CT SYSTEMS INC (5245 HORNET AVE in BEECH GROVE, IN)
STATE MASTER (Indiana facility tracking) (Resource Conservation and Recovery Act (tracking hazardous waste)) Organizations: ABBOTT LOUIS (CONTACT/OWNER)
BEECH GROVE HIGH SCHOOL (5330 HORNET AVE in BEECH GROVE, IN)
STATE MASTER (Indiana facility tracking) (Resource Conservation and Recovery Act (tracking hazardous waste)) Alternative names: BEECH GROVE SR HIGH SCHOOL
SILCO ENGINEERING (100 BETHEL in BEECH GROVE, IN)
STATE MASTER (Indiana facility tracking) (Resource Conservation and Recovery Act (tracking hazardous waste))
NAZARENE CHRISTIAN SCHOOL (5152 HORNET AVE in BEECH GROVE, IN)
STATE MASTER (Indiana facility tracking) COMPLIANCE ACTIVITY (Tracking inspections of insecticide, fungicide, and rodenticide, and toxic substances) Alternative names: NAZARENE CHRISTIAN SCHOOL 49
Housing units lacking complete kitchen facilities: 0.9%
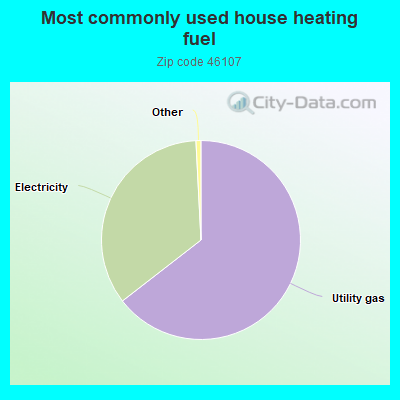
64.5%Utility gas
34.7%Electricity
Population in 1990: 13,051.
Place of birth for U.S.-born residents:
This state: 10,652
Northeast: 197
Midwest: 933
South: 506
West: 239
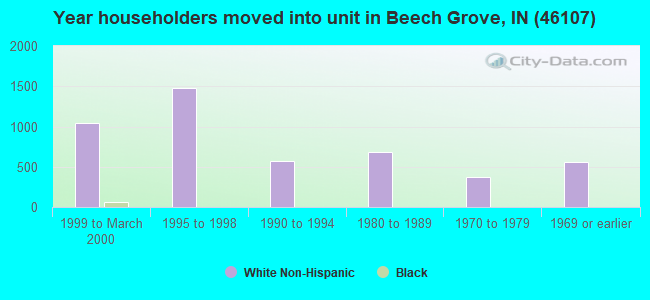
48% of the 46107 zip code residents lived in the same house 5 years ago. Out of people who lived in different houses, 77% lived in this county. Out of people who lived in different counties, 50% lived in Indiana.
89% of the 46107 zip code residents lived in the same house 1 year ago. Out of people who lived in different houses, 65% moved from this county. Out of people who lived in different houses, 23% moved from different county within same state. Out of people who lived in different houses, 10% moved from different state. Out of people who lived in different houses, 1% moved from abroad.
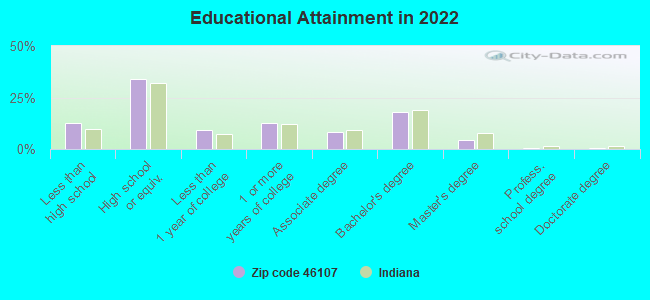
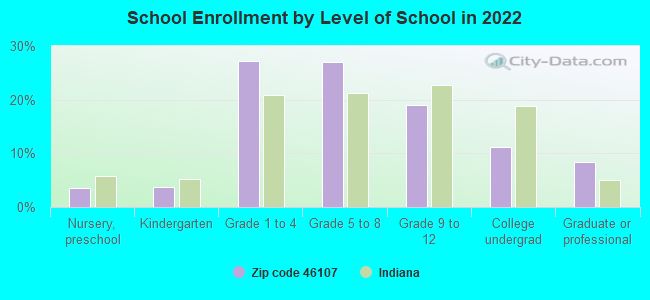
Private vs. public school enrollment:
Students in private schools in grades 1 to 8 (elementary and middle school): 112
Here:
7.4%
Indiana:
14.9%
Students in private schools in grades 9 to 12 (high school): 26
Here:
4.9%
Indiana:
11.4%
Students in private undergraduate colleges: 88
Here:
28.2%
Indiana:
22.3%
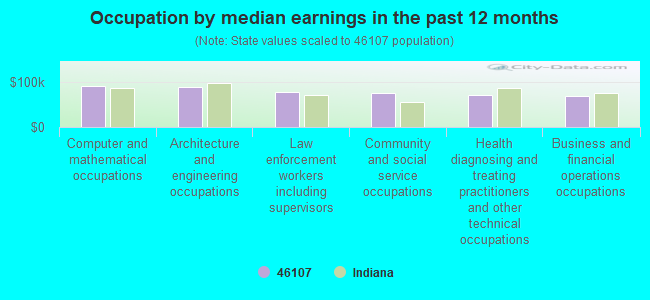
Occupation by median earnings in the past 12 months ($)
91,222Computer and mathematical occupations
86,946Architecture and engineering occupations
76,563Law enforcement workers including supervisors
75,234Community and social service occupations
70,290Health diagnosing and treating practitioners and other technical occupations
68,756Business and financial operations occupations
Companies with federal contracts located in this zip code:
JCI JONES CHEMICALS INC (600 BETHEL AVE in BEECH GROVE, IN; small business) : $0 in 2 contractsfrom 2002 to 2003
$0 with Army for Chemicals. Signed on 2003-05-28. Completion date: 2004-04-20.
$0, same as above.Signed on 2002-01-08. Completion date: 2002-12-31.
Top industries in this zip code by the number of employees in 2005:
Health Care and Social Assistance: General Medical and Surgical Hospitals (over 1000 employees: 1 establishment)
Information: Data Processing, Hosting, and Related Services (250-499: 1)
Health Care and Social Assistance: Offices of Physicians (except Mental Health Specialists) (100-249: 1, 50-99: 1, 20-49: 2, 10-19: 1, 5-9: 1, 1-4: 2)
Health Care and Social Assistance: Continuing Care Retirement Communities (100-249: 1)
Health Care and Social Assistance: Specialty (except Psychiatric and Substance Abuse) Hospitals (100-249: 1)
2002 - 2018 National Fire Incident Reporting System (NFIRS) incidents
According to the data from the years 2002 - 2018 the average number of fire incidents per year is 48. The highest number of fires - 82 took place in 2002, and the least - 1 in 2014. The data has a dropping trend.
When looking into fire subcategories, the most incidents belonged to: Structure Fires (46.3%), and Outside Fires (29.5%).
Fire incident types reported to NFIRS in Zip Code 46107


 Nearest zip codes: 46203, 46237, 46227, 46201, 46225, 46219.


 According to the data from the years 2002 - 2018 the average number of fire incidents per year is 48. The highest number of fires - 82 took place in 2002, and the least - 1 in 2014. The data has a dropping trend.
 When looking into fire subcategories, the most incidents belonged to: Structure Fires (46.3%), and Outside Fires (29.5%).