Estimated zip code population in 2022: 10,952 Zip code population in 2010: 12,153 Zip code population in 2000: 12,075
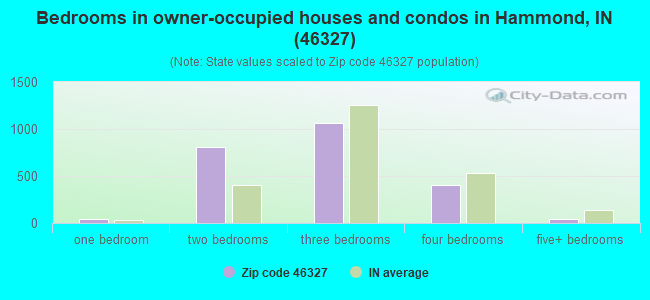
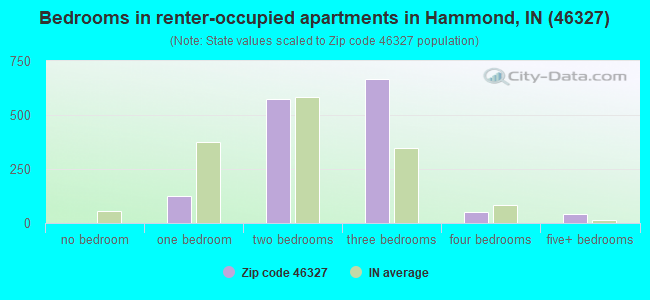
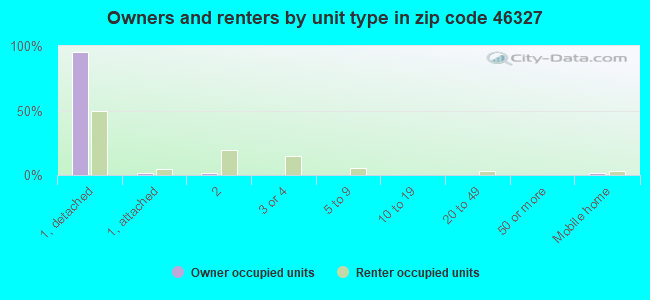
Houses and condos: 4,420 Renter-occupied apartments: 1,480
% of renters here:
38%
State:
29%
March 2022 cost of living index in zip code 46327: 94.2 (less than average, U.S. average is 100)
Land area: 4.1 sq. mi. Water area: 0.1 sq. mi.
Population density: 2,641 people per square mile
(average).
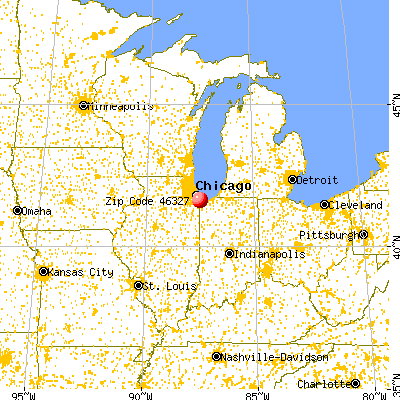
OSM Map
General Map
Google Map
MSN Map
OSM Map
General Map
Google Map
MSN Map
OSM Map
General Map
Google Map
MSN Map
OSM Map
General Map
Google Map
MSN Map
Please wait while loading the map...
Real estate property taxes paid for housing units in 2022:
This zip code:
1.1% ($1,340)
Indiana:
0.7% ($1,467)
Median real estate property taxes paid for housing units with mortgages in 2022: $1,536 (1.2%) Median real estate property taxes paid for housing units with no mortgage in 2022: $1,001 (0.9%)
Business Search- 14 Million verified businesses
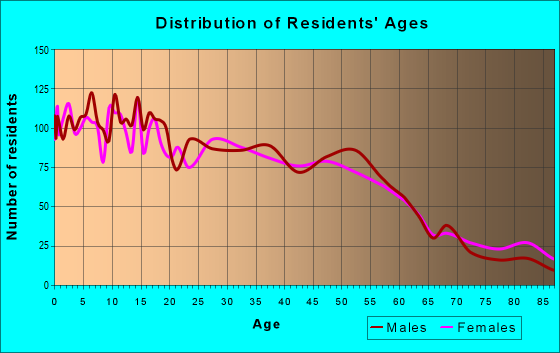
Males: 5,745
(52.5%)
Females: 5,207
(47.5%)
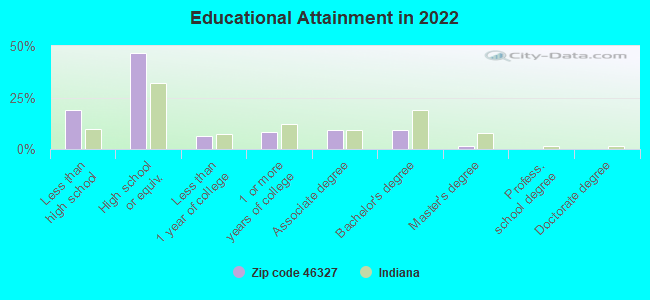
For population 25 years and over in 46327:
High school or higher: 79.8%
Bachelor's degree or higher: 10.9%
Graduate or professional degree: 1.8%
Unemployed: 6.2%
Mean travel time to work (commute): 24.0 minutes
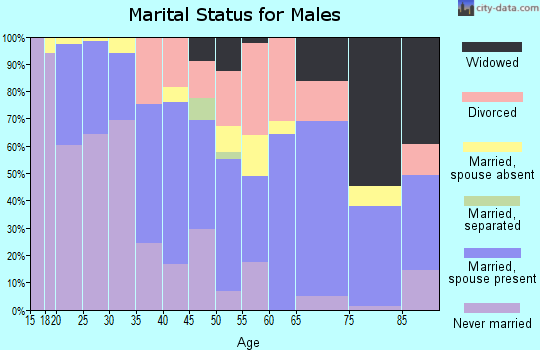
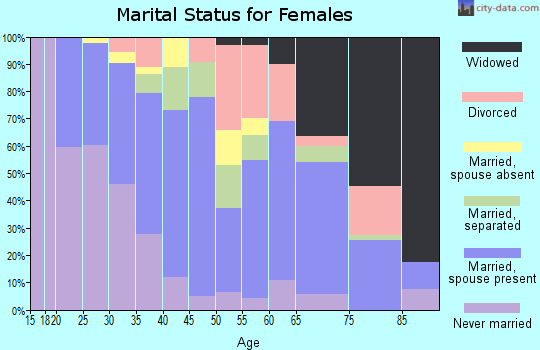
For population 15 years and over in 46327:
Never married: 47.2%
Now married: 39.7%
Separated: 1.3%
Widowed: 5.2%
Divorced: 6.5%
Zip code 46327 compared to state average:
Median house value below state average.
Unemployed percentage above state average.
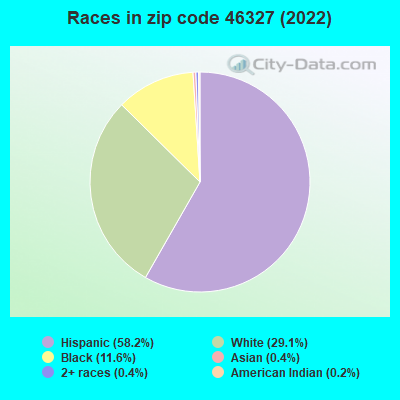
Hispanic race population percentage significantly above state average.
Median age below state average.
Foreign-born population percentage significantly above state average.
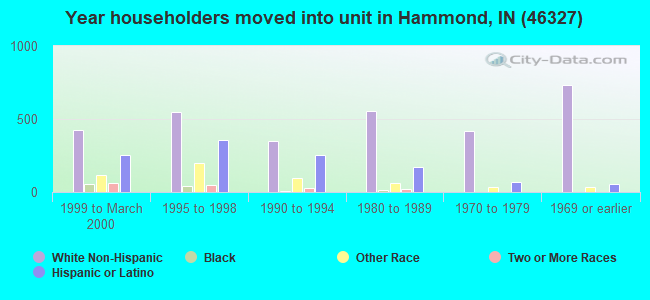
Length of stay since moving in significantly above state average.
House age above state average.
Percentage of population with a bachelor's degree or higher significantly below state average.
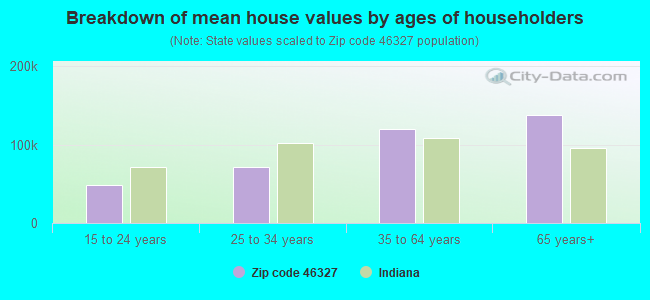
Estimated median house/condo value in 2022: $122,083
46327:
$122,083
Indiana:
$208,700
According to our research of Indiana and other state lists, there were 3 registered sex offenders living in 46327 zip code as of April 27, 2024. The ratio of all residents to sex offenders in zip code 46327 is 4,004 to 1. The ratio of registered sex offenders to all residents in this zip code is much lower than the state average.
Median resident age:
This zip code:
34.2 years
Indiana median age:
38.2 years
Average household size:
This zip code:
2.8 people
Indiana:
2.4 people
Averages for the 2020 tax year for zip code 46327, filed in 2021:
Average Adjusted Gross Income (AGI) in 2020: $34,082 (Individual Income Tax Returns)
Here:
$34,082
State:
$64,978
Salary/wage: $32,647 (reported on 84.3% of returns)
Here:
$32,647
State:
$55,245
(% of AGI for various income ranges: 1164.2% for AGIs below $25k, 3527.7% for AGIs $25k-50k, 6388.4% for AGIs $50k-75k, 9116.7% for AGIs $75k-100k, 13988.2% for AGIs $100k-200k)
Taxable interest for individuals: $593 (reported on 11.6% of returns)
This zip code:
$593
Indiana:
$1,351
(% of AGI for various income ranges: 5.0% for AGIs below $25k, 5.1% for AGIs $25k-50k, 15.8% for AGIs $50k-75k, 12.8% for AGIs $75k-100k, 60.9% for AGIs $100k-200k)
Ordinary dividends: $2,587 (reported on 4.9% of returns)
Here:
$2,587
State:
$5,827
(% of AGI for various income ranges: 3.9% for AGIs below $25k, 8.9% for AGIs $25k-50k, 39.6% for AGIs $50k-75k, 58.9% for AGIs $75k-100k, 102.7% for AGIs $100k-200k)
Net capital gain/loss in AGI: +$2,432 (reported on 4.1% of returns)
Here:
+$2,432
State:
+$17,730
(% of AGI for various income ranges: 1.8% for AGIs below $25k, 6.6% for AGIs $25k-50k, 28.0% for AGIs $50k-75k, 189.1% for AGIs $100k-200k)
Profit/loss from business: +$7,348 (reported on 12.9% of returns)
Here:
+$7,348
State:
+$12,144
(% of AGI for various income ranges: 136.2% for AGIs below $25k, 127.0% for AGIs $25k-50k, 93.2% for AGIs $50k-75k)
Taxable individual retirement arrangement distribution: $10,300 (reported on 3.4% of returns)
46327:
$10,300
Indiana:
$18,302
(% of AGI for various income ranges: 18.2% for AGIs below $25k, 23.8% for AGIs $25k-50k, 99.6% for AGIs $50k-75k, 298.9% for AGIs $75k-100k)
Total itemized deductions: $22,750 (reported on 1.3% of returns)
Here:
$22,750
State:
$35,601
(% of AGI for various income ranges: 27.4% for AGIs below $25k, 178.2% for AGIs $50k-75k)
Charity contributions: $4,750 (reported on 0.9% of returns)
Here:
$4,750
State:
$15,596
(% of AGI for various income ranges: 15.2% for AGIs $25k-50k)
Taxes paid: $4,933 (reported on 1.3% of returns)
46327:
$4,933
State:
$7,542
(% of AGI for various income ranges: 5.2% for AGIs below $25k, 41.2% for AGIs $50k-75k)
Earned income credit: $2,698 (reported on 28.6% of returns)
Here:
$2,698
State:
$2,298
(% of AGI for various income ranges: 145.0% for AGIs below $25k, 86.5% for AGIs $25k-50k)
Percentage of individuals using paid preparers for their 2020 taxes: 93.1%
Here:
93%
State:
94%
(% for various income ranges: 93.1% for AGIs below $25k, 93.2% for AGIs $25k-50k, 93.7% for AGIs $50k-75k, 91.7% for AGIs $75k-100k, 93.3% for AGIs $100k-200k)
Averages for the 2012 tax year for zip code 46327, filed in 2013:
Average Adjusted Gross Income (AGI) in 2012: $31,405 (Individual Income Tax Returns)
Here:
$31,405
State:
$52,932
Salary/wage: $30,570 (reported on 85.0% of returns)
Here:
$30,570
State:
$45,173
(% of AGI for various income ranges: 76.4% for AGIs below $25k, 86.5% for AGIs $25k-50k, 85.7% for AGIs $50k-75k, 85.4% for AGIs $75k-100k, 76.5% for AGIs $100k-200k)
Taxable interest for individuals: $689 (reported on 15.8% of returns)
This zip code:
$689
Indiana:
$1,311
(% of AGI for various income ranges: 0.5% for AGIs below $25k, 0.3% for AGIs $25k-50k, 0.4% for AGIs $50k-75k, 0.2% for AGIs $75k-100k, 0.2% for AGIs $100k-200k)
Ordinary dividends: $2,441 (reported on 7.3% of returns)
Here:
$2,441
State:
$4,690
(% of AGI for various income ranges: 0.5% for AGIs below $25k, 0.5% for AGIs $25k-50k, 0.6% for AGIs $50k-75k, 1.0% for AGIs $75k-100k, 0.3% for AGIs $100k-200k)
Net capital gain/loss in AGI: +$800 (reported on 4.1% of returns)
Here:
+$800
State:
+$10,406
(% of AGI for various income ranges: 0.1% for AGIs $50k-75k, 0.7% for AGIs $100k-200k)
Profit/loss from business: +$10,004 (reported on 10.7% of returns)
Here:
+$10,004
State:
+$11,105
(% of AGI for various income ranges: 10.3% for AGIs below $25k, 2.7% for AGIs $25k-50k, 1.4% for AGIs $50k-75k)
Taxable individual retirement arrangement distribution: $11,273 (reported on 4.7% of returns)
46327:
$11,273
Indiana:
$13,841
(% of AGI for various income ranges: 1.6% for AGIs below $25k, 1.2% for AGIs $25k-50k, 1.7% for AGIs $50k-75k, 5.0% for AGIs $75k-100k)
Total itemized deductions: $13,985 (24% of AGI, reported on 11.1% of returns)
Here:
$13,985
State:
$20,913
Here:
23.8% of AGI
State:
18.2% of AGI
(% of AGI for various income ranges: 3.4% for AGIs below $25k, 4.4% for AGIs $25k-50k, 6.2% for AGIs $50k-75k, 5.3% for AGIs $75k-100k, 6.4% for AGIs $100k-200k)
Charity contributions: $1,915 (reported on 8.3% of returns)
Here:
$1,915
State:
$4,697
(% of AGI for various income ranges: 0.3% for AGIs below $25k, 0.5% for AGIs $25k-50k, 0.8% for AGIs $50k-75k, 0.5% for AGIs $75k-100k, 0.4% for AGIs $100k-200k)
Taxes paid: $3,885 (reported on 11.1% of returns)
46327:
$3,885
State:
$7,456
(% of AGI for various income ranges: 0.5% for AGIs below $25k, 1.0% for AGIs $25k-50k, 1.9% for AGIs $50k-75k, 1.6% for AGIs $75k-100k, 2.8% for AGIs $100k-200k)
Earned income credit: $2,619 (reported on 31.6% of returns)
Here:
$2,619
State:
$2,265
(% of AGI for various income ranges: 9.6% for AGIs below $25k, 1.8% for AGIs $25k-50k)
Percentage of individuals using paid preparers for their 2012 taxes: 63.7%
Here:
64%
State:
53%
(% for various income ranges: 60.9% for AGIs below $25k, 65.9% for AGIs $25k-50k, 67.3% for AGIs $50k-75k, 65.0% for AGIs $75k-100k, 76.9% for AGIs $100k-200k)
Averages for the 2004 tax year for zip code 46327, filed in 2005:
Average Adjusted Gross Income (AGI) in 2004: $29,003 (Individual Income Tax Returns)
Here:
$29,003
State:
$44,790
Salary/wage: $28,208 (reported on 86.0% of returns)
Here:
$28,208
State:
$39,615
(% of AGI for various income ranges: 75.2% for AGIs below $10k, 79.5% for AGIs $10k-25k, 87.4% for AGIs $25k-50k, 87.4% for AGIs $50k-75k, 85.2% for AGIs $75k-100k, 65.1% for AGIs over 100k)
Taxable interest for individuals: $921 (reported on 31.6% of returns)
This zip code:
$921
Indiana:
$1,535
(% of AGI for various income ranges: 2.9% for AGIs below $10k, 1.6% for AGIs $10k-25k, 0.8% for AGIs $25k-50k, 1.0% for AGIs $50k-75k, 0.5% for AGIs $75k-100k, 0.4% for AGIs over 100k)
Taxable dividends: $2,133 (reported on 10.8% of returns)
Here:
$2,133
State:
$2,998
(% of AGI for various income ranges: 0.9% for AGIs below $10k, 1.2% for AGIs $10k-25k, 0.7% for AGIs $25k-50k, 0.9% for AGIs $50k-75k, 0.7% for AGIs $75k-100k, 0.2% for AGIs over 100k)
Net capital gain/loss: +$2,378 (reported on 6.5% of returns)
Here:
+$2,378
State:
+$8,619
(% of AGI for various income ranges: -0.3% for AGIs below $10k, -0.0% for AGIs $10k-25k, 0.1% for AGIs $25k-50k, 1.0% for AGIs $50k-75k, 1.5% for AGIs $75k-100k, 1.9% for AGIs over 100k)
Profit/loss from business: +$8,955 (reported on 7.4% of returns)
Here:
+$8,955
State:
+$10,071
(% of AGI for various income ranges: 6.2% for AGIs below $10k, 4.9% for AGIs $10k-25k, 2.2% for AGIs $25k-50k, 1.1% for AGIs $50k-75k, 0.8% for AGIs $75k-100k)
IRA payment deduction: $2,423 (reported on 1.1% of returns)
46327:
$2,423
Indiana:
$2,840
Total itemized deductions: $12,351 (25% of AGI, reported on 14.8% of returns)
Here:
$12,351
State:
$17,065
Here:
24.6% of AGI
State:
19.5% of AGI
(% of AGI for various income ranges: 2.3% for AGIs below $10k, 3.8% for AGIs $10k-25k, 6.8% for AGIs $25k-50k, 8.2% for AGIs $50k-75k, 7.5% for AGIs $75k-100k, 5.0% for AGIs over 100k)
Charity contributions deductions: $1,711 (3% of AGI, reported on 11.8% of returns)
Here:
$1,711
State:
$3,550
Here:
3.5% of AGI
State:
3.8% of AGI
(% of AGI for various income ranges: 0.1% for AGIs below $10k, 0.4% for AGIs $10k-25k, 0.7% for AGIs $25k-50k, 0.9% for AGIs $50k-75k, 1.1% for AGIs $75k-100k, 0.6% for AGIs over 100k)
Total tax: $3,467 (reported on 62.7% of returns)
46327:
$3,467
State:
$6,914
(% of AGI for various income ranges: 1.7% for AGIs below $10k, 3.3% for AGIs $10k-25k, 5.8% for AGIs $25k-50k, 9.0% for AGIs $50k-75k, 11.9% for AGIs $75k-100k, 18.7% for AGIs over 100k)
Earned income credit: $1,918 (reported on 25.5% of returns)
Here:
$1,918
State:
$1,685
Percentage of individuals using paid preparers for their 2004 taxes: 67.9%
Here:
68%
State:
59%
(% for various income ranges: 61.3% for AGIs below $10k, 72.0% for AGIs $10k-25k, 67.6% for AGIs $25k-50k, 71.1% for AGIs $50k-75k, 67.7% for AGIs $75k-100k, 66.2% for AGIs over 100k)
Likely homosexual households (counted as self-reported same-sex unmarried-partner households)
Lesbian couples: 1.2% of all households
Gay men: 0.0% of all households
Household received Food Stamps/SNAP in the past 12 months: 811 Household did not receive Food Stamps/SNAP in the past 12 months: 3,060
Women who had a birth in the past 12 months: 312 (60 now married, 218 unmarried) Women who did not have a birth in the past 12 months: 2,438 (886 now married, 1,549 unmarried)
Housing units in zip code 46327 with a mortgage: 1,358 (46 second mortgage, 31 both second mortgage and home equity loan) Median monthly owner costs for units with a mortgage: $962 Median monthly owner costs for units without a mortgage: $442
Residents with income below the poverty level in 2022:
This zip code:
33.2%
Whole state:
12.6%
Residents with income below 50% of the poverty level in 2022:
This zip code:
22.7%
Whole state:
6.3%
Median number of rooms in houses and condos:
Here:
5.6
State:
6.6
Median number of rooms in apartments:
Here:
4.8
State:
4.3
Notable locations in this zip code not listed on our city pages
Churches in zip code 46327 include: Hoffman Street Baptist Church (A), Pine Street Presbyterian Church (B), Saint Casimir Church (C), Saint Michael the Archangel Church (D), Spanish United Pentecostal Church (E). Display/hide their locations on the map
1,516 married couples with children.
1,138 single-parent households (53 men, 1,085 women).
61.6% of residents of 46327 zip code speak English at home.
38.4% of residents speak Spanish at home (56% very well, 17% well, 24% not well, 4% not at all).
0.6% of residents speak other Indo-European language at home (38% well, 62% not well).
0.3% of residents speak Asian or Pacific Island language at home (29% very well, 41% well, 29% not well).
0.4% of residents speak other language at home (63% very well, 37% not well).
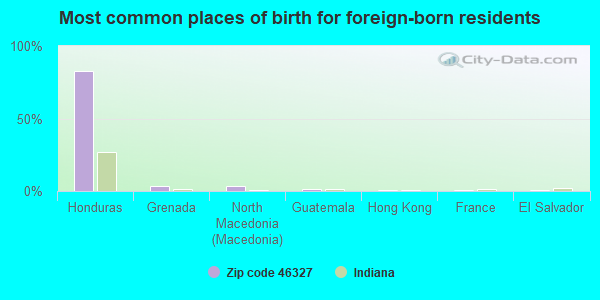
Foreign born population: 2,419 (22.1%) (55.4% of them are naturalized citizens)
This zip code:
22.1%
Whole state:
6.1%
83%Honduras
4%Grenada
4%North Macedonia (Macedonia)
1%Guatemala
1%Hong Kong
1%France
0%El Salvador
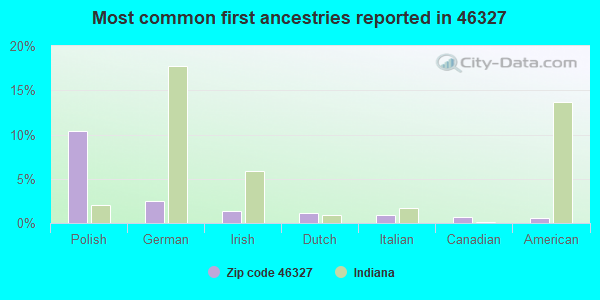
10%Polish
2%German
1%Irish
1%Dutch
1%Italian
1%Canadian
1%American
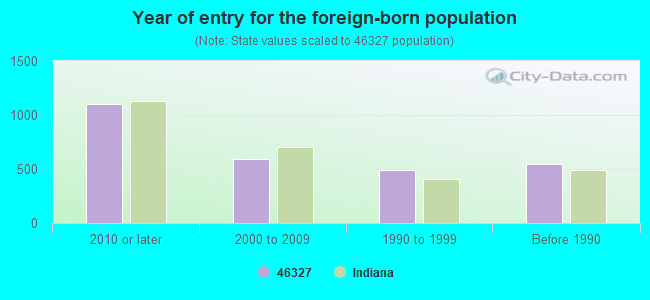
Year of entry for the foreign-born population
1,1042010 or later
5942000 to 2009
4881990 to 1999
548Before 1990
Major facilities with environmental interests located in this zip code:
MOBIL OIL HAMMOND TERMINAL (1527 141ST STREET in HAMMOND, IN)
AIR MINOR (AIRS/AFS) AIR MAJOR (AIRS/AFS) OIL CONTROL (Facility Response Plan for oil discharge) STATE MASTER (Indiana facility tracking) - CRTK-5851, EPCRA, LUST-199111537, LEAKING STORAGE TANK, SPILL-198911077, RELEASE ASSESSMENT, UST-17863, UNDERGROUND STORAGE TANK PROGRAM CRITERIA AND HAZARDOUS AIR POLLUTANT INVENTORY (Inventory of air pollution sources) National Pollutant Discharge Elimination System NON-MAJOR (Tracking pollutant discharge elimination systems) - permit HAZARDOUS WASTE BIENNIAL REPORTER (Resource Conservation and Recovery Act (tracking hazardous waste)) Small Quantity Generators, between 100 kg and 1000 kg of hazardous waste/month (Resource Conservation and Recovery Act (tracking hazardous waste)) (Resource Conservation and Recovery Act (tracking hazardous waste)) TRI REPORTER (Tracking of toxic chemicals releasing facilities) Business SIC classification: PETROLEUM BULK STATIONS AND TERMINALS Business NAICS classification: LIQUEFIED PETROLEUM GAS (BOTTLED GAS) DEALERS. Organizations: MOBIL OIL CORPORATION (CONTACT/GENERAL)
, LARRY KRAYNIK (CONTACT/OPERATOR)
, EXXON MOBIL HAMMOND TERMINAL (CONTACT/OPERATOR)
, EXXONMOBIL OIL CORP (CONTACT/OWNER)
, MOBIL OIL CORPORATION (CONTACT/OWNER)
, EXXON MOBIL OIL CORP (CONTACT/OWNER)
, EXXONMOBIL OIL CORP (CONTACT/OWNER)
Alternative names: EXXONMOBIL OIL CORPORATION, EXXONMOBIL OIL CORP, HAMMOND, EXXONMOBIL OIL CORP. HAMMOND TERMINAL, EXXONMOBIL OIL CORP. HAMMOND TERMINAL, EXXONMOBIL OIL, HAMMOND TERMIN, HAMMOND TERMINAL (139206), MOBIL OIL CORP, MOBIL OIL CORP BULK PLT AND TERM, MOBIL OIL CORP BULK PLT AND TERM, MOBIL OIL-LOAD RACKS, MOBIL OIL-TANK FARM
AMERICAN STEEL FOUNDRIES (4831 HOHMAN in HAMMOND, IN)
AIR MAJOR (AIRS/AFS) FORMAL ENFORCEMENT ACTION (Integrated Compliance Information System) - ICIS-05-1986-0283, ENFORCEMENT/COMPLIANCE ACTIVITY (Integrated Compliance Information System) - ICIS-05-2001-0454, FORMAL ENFORCEMENT ACTION STATE MASTER (Indiana facility tracking) - SPILL-199003015, RELEASE ASSESSMENT, UST-1269, UNDERGROUND STORAGE TANK PROGRAM, ACES-OP-08900204, AIR PROGRAM, CRTK-2152, EPCRA COMPLIANCE ACTIVITY (Tracking inspections of insecticide, fungicide, and rodenticide, and toxic substances) CRITERIA AND HAZARDOUS AIR POLLUTANT INVENTORY (Inventory of air pollution sources) Small Quantity Generators, between 100 kg and 1000 kg of hazardous waste/month (Resource Conservation and Recovery Act (tracking hazardous waste)) - notification TRI REPORTER (Tracking of toxic chemicals releasing facilities) Business SIC classification: STEEL SPRINGS, EXCEPT WIRE Business NAICS classification: SPRING (HEAVY GAUGE) MANUFACTURING.; SPRING (HEAVY GAUGE) MANUFACTURING. Organizations: ASF-KEYSTONE INC (CONTACT/OPERATOR)
, ASF - KEYSTONE INC (CONTACT/OWNER)
Alternative names: AMERICAN STEEL CO, ASF - KEYSTONE INC, ASF - KEYSTONE INC.
MARATHON ASHLAND PETROLEUM LLC (4206 COLUMBIA AVE in HAMMOND, IN)
AIR MAJOR (AIRS/AFS) SUPERFUND (Superfund database) OIL CONTROL (Facility Response Plan for oil discharge) STATE MASTER (Indiana facility tracking) - ACES-OP-08900231, AIR PROGRAM, CRTK-4091, EPCRA CRITERIA AND HAZARDOUS AIR POLLUTANT INVENTORY (Inventory of air pollution sources) National Pollutant Discharge Elimination System NON-MAJOR (Tracking pollutant discharge elimination systems) - permit - ICIS-EF-2004-2010, ENFORCEMENT/COMPLIANCE ACTIVITY Conditionally Exempt Small Quantity Generators, less than 100 kg/month of hazardous waste (Resource Conservation and Recovery Act (tracking hazardous waste)) - notification HAZARDOUS WASTE BIENNIAL REPORTER (Resource Conservation and Recovery Act (tracking hazardous waste)) Business SIC classification: PETROLEUM BULK STATIONS AND TERMINALS Business NAICS classification: LIQUEFIED PETROLEUM GAS (BOTTLED GAS) DEALERS. Organizations: WILLIAM J DAY (CONTACT/OPERATOR)
, MARATHON PTEROLEUM CO LLC (CONTACT/OPERATOR)
, MARATHON PETROLEUM COMPANY LLC (CONTACT/OWNER)
Alternative names: COLUMBIA AVENUE SPILL, MARATHON ASHLAND, HAMMOND TERM, MARATHON ASHLAND PETROLEUM HAMMOND, MARATHON ASHLAND PETROLEUM LLC HAMMOND, IN LIGHT PROD. TERM.
CALUMET CONTAINER (3631 STATE LINE AVE in HAMMOND, IN)
SUPERFUND (Superfund database) (Integrated Compliance Information System) - ICIS-05-1979-0074, FORMAL ENFORCEMENT ACTION, ICIS-05-1983-0031, STATE MASTER (Indiana facility tracking) (Resource Conservation and Recovery Act (tracking hazardous waste)) Large Quantity Generators, more that 1000 kg of hazardous waste/month (Resource Conservation and Recovery Act (tracking hazardous waste)) Organizations: SEE NOTES (CONTACT/OWNER)
Alternative names: STEEL CONTAINER CORP
C & F STANDARD SVC (4450 CALUMET AVE in HAMMOND, IN)
STATE MASTER (Indiana facility tracking) - CRTK-7339, EPCRA, LUST-199210520, LEAKING STORAGE TANK, UST-11490, UNDERGROUND STORAGE TANK PROGRAM Conditionally Exempt Small Quantity Generators, less than 100 kg/month of hazardous waste (Resource Conservation and Recovery Act (tracking hazardous waste)) - notification (Resource Conservation and Recovery Act (tracking hazardous waste)) Organizations: GALLO CONRAD JR (CONTACT/OWNER)
, AMOCO OIL CO (CONTACT/OWNER)
Alternative names: AMOCO 6243
DALY INDUSTRIAL COATING INC (124 137ND ST in HAMMOND, IN)
STATE MASTER (Indiana facility tracking) - CRTK-9919, EPCRA (Resource Conservation and Recovery Act (tracking hazardous waste)) Organizations: NSC CORP (CONTACT/OWNER)
Alternative names: NATIONAL SURFACE CLEANING INC
H A INDUSTRIES DIV OF AM CASTLES & CO (4527 COLUMBIA AVE in HAMMOND, IN)
AIR MINOR (AIRS/AFS) AIR MAJOR (AIRS/AFS) STATE MASTER (Indiana facility tracking) - ACES-OP-08900248, AIR PROGRAM CRITERIA AND HAZARDOUS AIR POLLUTANT INVENTORY (Inventory of air pollution sources) Business SIC classification: METAL HEAT TREATING; METAL SHIPPING BARRELS, DRUMS, KEGS, AND PAILS; NONCLASSIFIABLE ESTABLISHMENTS Business NAICS classification: METAL HEAT TREATING. Alternative names: AMERICONTAINER, HA IND DIV OF AM CASTLES & CO
PORTERS APPAREL & RENTAL (4524 HOHMAN AVE in HAMMOND, IN)
STATE MASTER (Indiana facility tracking) - UST-7785, UNDERGROUND STORAGE TANK PROGRAM (Resource Conservation and Recovery Act (tracking hazardous waste)) Organizations: PORTER CLEANERS (CONTACT/OWNER)
Alternative names: PORTERS CLEANERS
NIPSCO HAMMOND TRANSFORMER (4621 ELM ST in HAMMOND, IN)
STATE MASTER (Indiana facility tracking) - CRTK-4905, EPCRA, UST-6069, UNDERGROUND STORAGE TANK PROGRAM (Resource Conservation and Recovery Act (tracking hazardous waste)) Alternative names: NIPSCO HAMMOND TRANSFORMER SHOP
MARTIN OIL 8305 (4705 CALUMET AVE in HAMMOND, IN)
STATE MASTER (Indiana facility tracking) - CRTK-4423, EPCRA, LUST-198903089, LEAKING STORAGE TANK, LUST-199405537, SPILL-198903089, RELEASE ASSESSMENT, UST-5685, UNDERGROUND STORAGE TANK PROGRAM (Resource Conservation and Recovery Act (tracking hazardous waste)) Organizations: EMRO MARKETING (CONTACT/OWNER)
Alternative names: EMRO MARKETING 8305
ABRAHAM LINCOLN ELEM SCH (4221 TOWLE AVE in HAMMOND, IN)
(National Center for Education Statistics) - STATE ID-4463 Organizations: SCHOOL CITY OF HAMMOND (SCHOOL DISTRICT)
A L SPOHN MIDDLE SCH (4925 SOHL AVE in HAMMOND, IN)
(National Center for Education Statistics) - STATE ID-4435 Organizations: SCHOOL CITY OF HAMMOND (SCHOOL DISTRICT)
PRIME GROUP (4527 COLUMBIA AVE in HAMMOND, IN)
STATE MASTER (Indiana facility tracking) - CRTK-192, EPCRA Conditionally Exempt Small Quantity Generators, less than 100 kg/month of hazardous waste (Resource Conservation and Recovery Act (tracking hazardous waste))
Housing units lacking complete plumbing facilities: 1.3% Housing units lacking complete kitchen facilities: 5.0%
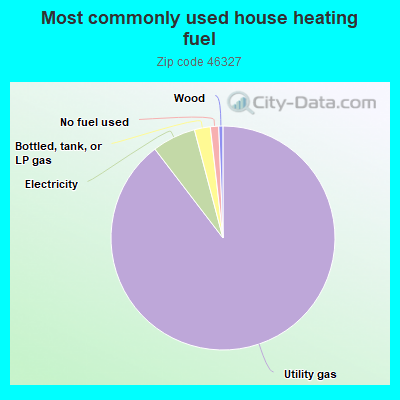
89.6%Utility gas
6.3%Electricity
2.3%Bottled, tank, or LP gas
1.2%No fuel used
0.6%Wood
Population in 1990: 12,384.
Place of birth for U.S.-born residents:
This state: 4,710
Northeast: 71
Midwest: 3,212
South: 318
West: 88
64% of the 46327 zip code residents lived in the same house 5 years ago. Out of people who lived in different houses, 70% lived in this county. Out of people who lived in different counties, 50% lived in Indiana.
93% of the 46327 zip code residents lived in the same house 1 year ago. Out of people who lived in different houses, 32% moved from this county. Out of people who lived in different houses, 35% moved from different county within same state. Out of people who lived in different houses, 25% moved from different state. Out of people who lived in different houses, 14% moved from abroad.
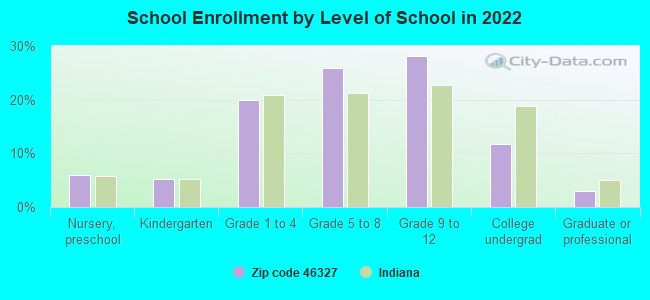
Private vs. public school enrollment:
Students in private schools in grades 1 to 8 (elementary and middle school): 86
Here:
6.5%
Indiana:
14.9%
Students in private schools in grades 9 to 12 (high school): 151
Here:
18.6%
Indiana:
11.4%
Students in private undergraduate colleges: 95
Here:
27.6%
Indiana:
22.3%
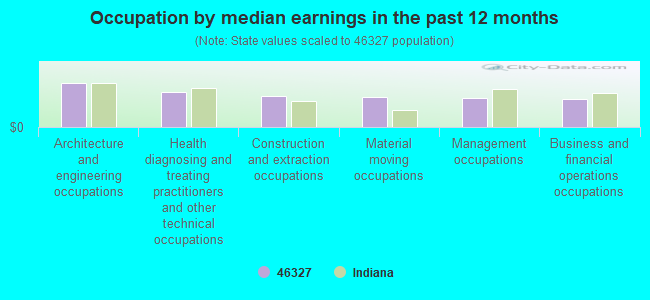
Occupation by median earnings in the past 12 months ($)
65,674Architecture and engineering occupations
52,351Health diagnosing and treating practitioners and other technical occupations
46,455Construction and extraction occupations
44,514Material moving occupations
43,223Management occupations
42,093Business and financial operations occupations
Companies with federal contracts located in this zip code:
LOCKER LAND PARTS PLUS, INC (19 143RD ST in HAMMOND, IN; small business)
$34,404 with Air Force for Engineering and Technical Services. Signed on 2002-08-15. Completion date: 2002-10-22.
Top industries in this zip code by the number of employees in 2005:
Construction: Plumbing, Heating, and Air-Conditioning Contractors (250-499 employees: 1 establishment)
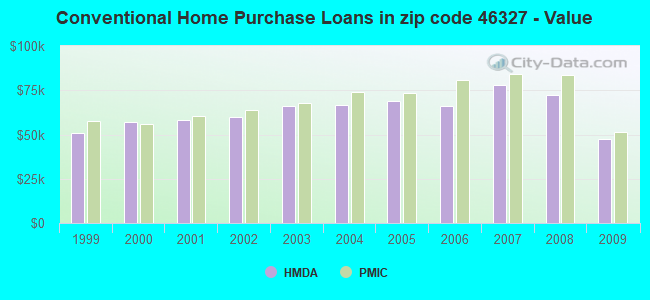
Detailed PMIC statistics for the following Tracts:0203.00
, 0204.00
2003 - 2018 National Fire Incident Reporting System (NFIRS) incidents
According to the data from the years 2003 - 2018 the average number of fire incidents per year is 32. The highest number of fire incidents - 83 took place in 2007, and the least - 0 in 2016. The data has a constant trend.
When looking into fire subcategories, the most incidents belonged to: Structure Fires (36.4%), and Outside Fires (36.0%).
Fire incident types reported to NFIRS in Zip Code 46327


 Nearest zip codes: 46324, 46312, 46394, 60409, 46323, 46320.
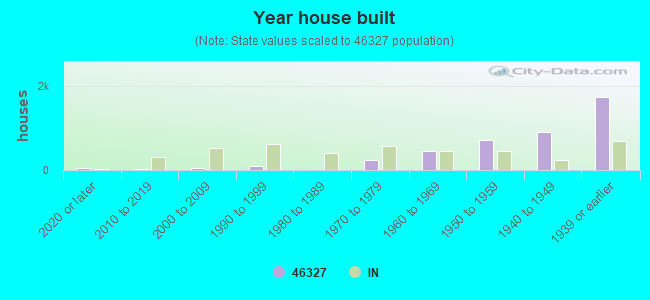


 According to the data from the years 2003 - 2018 the average number of fire incidents per year is 32. The highest number of fire incidents - 83 took place in 2007, and the least - 0 in 2016. The data has a constant trend.
 When looking into fire subcategories, the most incidents belonged to: Structure Fires (36.4%), and Outside Fires (36.0%).