Estimated zip code population in 2022: 23,615 Zip code population in 2010: 22,743 Zip code population in 2000: 23,624
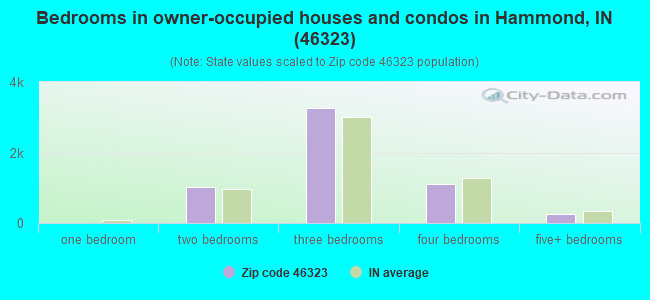
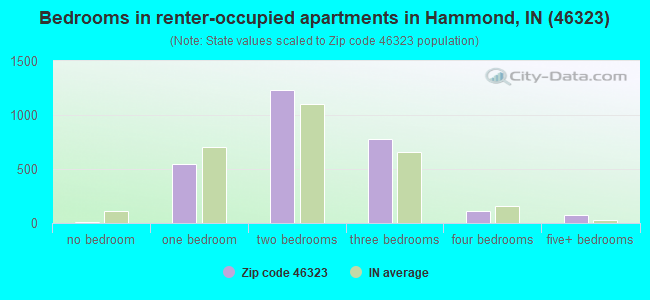
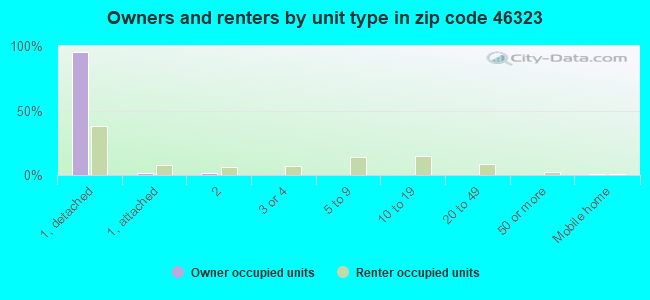
Houses and condos: 8,990 Renter-occupied apartments: 2,767
% of renters here:
33%
State:
29%
March 2022 cost of living index in zip code 46323: 94.6 (less than average, U.S. average is 100)
Land area: 6.2 sq. mi. Water area: 0.0 sq. mi.
Population density: 3,808 people per square mile
(average).
OSM Map
General Map
Google Map
MSN Map
OSM Map
General Map
Google Map
MSN Map
OSM Map
General Map
Google Map
MSN Map
OSM Map
General Map
Google Map
MSN Map
Please wait while loading the map...
Real estate property taxes paid for housing units in 2022:
This zip code:
1.0% ($1,437)
Indiana:
0.7% ($1,467)
Median real estate property taxes paid for housing units with mortgages in 2022: $1,471 (0.9%) Median real estate property taxes paid for housing units with no mortgage in 2022: $1,419 (1.0%)
Business Search- 14 Million verified businesses
Males: 11,065
(46.9%)
Females: 12,549
(53.1%)
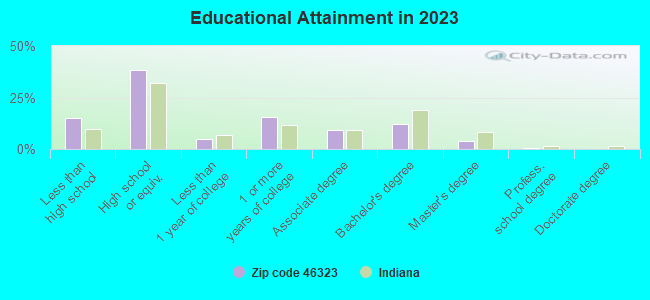
For population 25 years and over in 46323:
High school or higher: 85.2%
Bachelor's degree or higher: 14.9%
Graduate or professional degree: 3.8%
Unemployed: 4.4%
Mean travel time to work (commute): 23.7 minutes
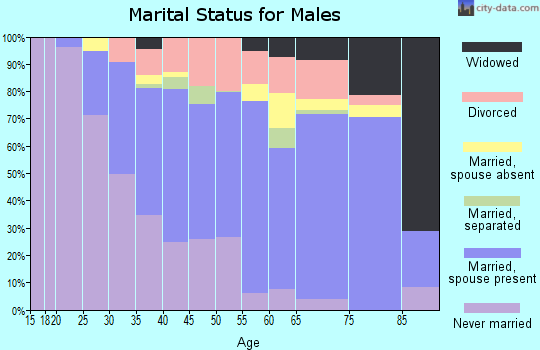
For population 15 years and over in 46323:
Never married: 41.8%
Now married: 41.1%
Separated: 1.1%
Widowed: 5.6%
Divorced: 10.4%
Zip code 46323 compared to state average:
Black race population percentage above state average.
Hispanic race population percentage significantly above state average.
Foreign-born population percentage above state average.
Length of stay since moving in significantly above state average.
Percentage of population with a bachelor's degree or higher below state average.
Estimated median house/condo value in 2022: $151,069
46323:
$151,069
Indiana:
$208,700
Median resident age:
This zip code:
36.9 years
Indiana median age:
38.2 years
Average household size:
This zip code:
2.7 people
Indiana:
2.4 people
Averages for the 2020 tax year for zip code 46323, filed in 2021:
Average Adjusted Gross Income (AGI) in 2020: $40,488 (Individual Income Tax Returns)
Here:
$40,488
State:
$64,978
Salary/wage: $38,340 (reported on 85.1% of returns)
Here:
$38,340
State:
$55,245
(% of AGI for various income ranges: 1096.1% for AGIs below $25k, 3587.4% for AGIs $25k-50k, 6409.4% for AGIs $50k-75k, 9312.1% for AGIs $75k-100k, 15770.3% for AGIs $100k-200k)
Taxable interest for individuals: $620 (reported on 13.9% of returns)
This zip code:
$620
Indiana:
$1,351
(% of AGI for various income ranges: 7.1% for AGIs below $25k, 7.7% for AGIs $25k-50k, 14.0% for AGIs $50k-75k, 23.4% for AGIs $75k-100k, 29.2% for AGIs $100k-200k)
Ordinary dividends: $2,738 (reported on 6.0% of returns)
Here:
$2,738
State:
$5,827
(% of AGI for various income ranges: 6.0% for AGIs below $25k, 10.9% for AGIs $25k-50k, 25.4% for AGIs $50k-75k, 35.3% for AGIs $75k-100k, 175.1% for AGIs $100k-200k)
Net capital gain/loss in AGI: +$3,180 (reported on 4.9% of returns)
Here:
+$3,180
State:
+$17,730
(% of AGI for various income ranges: 2.7% for AGIs below $25k, 8.0% for AGIs $25k-50k, 30.7% for AGIs $50k-75k, 49.0% for AGIs $75k-100k, 158.7% for AGIs $100k-200k)
Profit/loss from business: +$4,926 (reported on 11.6% of returns)
Here:
+$4,926
State:
+$12,144
(% of AGI for various income ranges: 86.8% for AGIs below $25k, 40.0% for AGIs $25k-50k, 62.7% for AGIs $50k-75k, 40.5% for AGIs $75k-100k, 223.8% for AGIs $100k-200k)
Taxable individual retirement arrangement distribution: $11,718 (reported on 4.7% of returns)
46323:
$11,718
Indiana:
$18,302
(% of AGI for various income ranges: 27.4% for AGIs below $25k, 37.5% for AGIs $25k-50k, 88.8% for AGIs $50k-75k, 180.6% for AGIs $75k-100k, 396.4% for AGIs $100k-200k)
Total itemized deductions: $22,422 (reported on 2.6% of returns)
Here:
$22,422
State:
$35,601
(% of AGI for various income ranges: 10.6% for AGIs below $25k, 42.7% for AGIs $25k-50k, 130.9% for AGIs $50k-75k, 189.0% for AGIs $75k-100k, 437.7% for AGIs $100k-200k)
Charity contributions: $7,600 (reported on 1.8% of returns)
Here:
$7,600
State:
$15,596
(% of AGI for various income ranges: 10.5% for AGIs $25k-50k, 35.5% for AGIs $50k-75k, 33.4% for AGIs $75k-100k, 128.7% for AGIs $100k-200k)
Taxes paid: $5,726 (reported on 2.6% of returns)
46323:
$5,726
State:
$7,542
(% of AGI for various income ranges: 1.8% for AGIs below $25k, 7.7% for AGIs $25k-50k, 31.0% for AGIs $50k-75k, 60.8% for AGIs $75k-100k, 130.0% for AGIs $100k-200k)
Earned income credit: $2,357 (reported on 24.4% of returns)
Here:
$2,357
State:
$2,298
(% of AGI for various income ranges: 114.4% for AGIs below $25k, 77.7% for AGIs $25k-50k, 0.9% for AGIs $50k-75k)
Percentage of individuals using paid preparers for their 2020 taxes: 93.6%
Here:
94%
State:
94%
(% for various income ranges: 93.4% for AGIs below $25k, 94.1% for AGIs $25k-50k, 93.7% for AGIs $50k-75k, 93.8% for AGIs $75k-100k, 91.7% for AGIs $100k-200k, 100.0% for AGIs over 200k)
Averages for the 2012 tax year for zip code 46323, filed in 2013:
Average Adjusted Gross Income (AGI) in 2012: $38,029 (Individual Income Tax Returns)
Here:
$38,029
State:
$52,932
Salary/wage: $36,705 (reported on 85.4% of returns)
Here:
$36,705
State:
$45,173
(% of AGI for various income ranges: 72.7% for AGIs below $25k, 84.0% for AGIs $25k-50k, 85.7% for AGIs $50k-75k, 86.5% for AGIs $75k-100k, 84.7% for AGIs $100k-200k, 41.1% for AGIs over 200k)
Taxable interest for individuals: $672 (reported on 18.7% of returns)
This zip code:
$672
Indiana:
$1,311
(% of AGI for various income ranges: 0.6% for AGIs below $25k, 0.4% for AGIs $25k-50k, 0.3% for AGIs $50k-75k, 0.2% for AGIs $75k-100k, 0.3% for AGIs $100k-200k)
Ordinary dividends: $2,163 (reported on 8.7% of returns)
Here:
$2,163
State:
$4,690
(% of AGI for various income ranges: 0.7% for AGIs below $25k, 0.4% for AGIs $25k-50k, 0.4% for AGIs $50k-75k, 0.3% for AGIs $75k-100k, 0.7% for AGIs $100k-200k)
Net capital gain/loss in AGI: +$1,594 (reported on 4.9% of returns)
Here:
+$1,594
State:
+$10,406
(% of AGI for various income ranges: 0.1% for AGIs $75k-100k, 1.1% for AGIs $100k-200k)
Profit/loss from business: +$8,931 (reported on 9.0% of returns)
Here:
+$8,931
State:
+$11,105
(% of AGI for various income ranges: 7.1% for AGIs below $25k, 1.8% for AGIs $25k-50k, 0.9% for AGIs $50k-75k, 1.0% for AGIs $75k-100k, 1.3% for AGIs $100k-200k)
Taxable individual retirement arrangement distribution: $9,388 (reported on 6.5% of returns)
46323:
$9,388
Indiana:
$13,841
(% of AGI for various income ranges: 1.9% for AGIs below $25k, 1.4% for AGIs $25k-50k, 1.9% for AGIs $50k-75k, 1.5% for AGIs $75k-100k, 1.5% for AGIs $100k-200k)
Total itemized deductions: $15,363 (23% of AGI, reported on 17.9% of returns)
Here:
$15,363
State:
$20,913
Here:
22.9% of AGI
State:
18.2% of AGI
(% of AGI for various income ranges: 5.1% for AGIs below $25k, 6.4% for AGIs $25k-50k, 7.9% for AGIs $50k-75k, 7.5% for AGIs $75k-100k, 9.9% for AGIs $100k-200k)
Charity contributions: $2,715 (reported on 13.1% of returns)
Here:
$2,715
State:
$4,697
(% of AGI for various income ranges: 0.4% for AGIs below $25k, 0.6% for AGIs $25k-50k, 1.1% for AGIs $50k-75k, 1.1% for AGIs $75k-100k, 1.5% for AGIs $100k-200k)
Taxes paid: $4,291 (reported on 17.9% of returns)
46323:
$4,291
State:
$7,456
(% of AGI for various income ranges: 0.9% for AGIs below $25k, 1.4% for AGIs $25k-50k, 2.1% for AGIs $50k-75k, 2.4% for AGIs $75k-100k, 3.6% for AGIs $100k-200k)
Earned income credit: $2,389 (reported on 25.6% of returns)
Here:
$2,389
State:
$2,265
(% of AGI for various income ranges: 8.5% for AGIs below $25k, 1.3% for AGIs $25k-50k)
Percentage of individuals using paid preparers for their 2012 taxes: 55.5%
Here:
56%
State:
53%
(% for various income ranges: 51.3% for AGIs below $25k, 55.7% for AGIs $25k-50k, 61.4% for AGIs $50k-75k, 64.4% for AGIs $75k-100k, 65.5% for AGIs $100k-200k)
Averages for the 2004 tax year for zip code 46323, filed in 2005:
Average Adjusted Gross Income (AGI) in 2004: $34,841 (Individual Income Tax Returns)
Here:
$34,841
State:
$44,790
Salary/wage: $33,602 (reported on 86.6% of returns)
Here:
$33,602
State:
$39,615
(% of AGI for various income ranges: 85.7% for AGIs below $10k, 75.0% for AGIs $10k-25k, 85.3% for AGIs $25k-50k, 87.7% for AGIs $50k-75k, 88.5% for AGIs $75k-100k, 73.0% for AGIs over 100k)
Taxable interest for individuals: $915 (reported on 35.1% of returns)
This zip code:
$915
Indiana:
$1,535
(% of AGI for various income ranges: 3.0% for AGIs below $10k, 1.8% for AGIs $10k-25k, 0.8% for AGIs $25k-50k, 0.6% for AGIs $50k-75k, 0.6% for AGIs $75k-100k, 1.0% for AGIs over 100k)
Taxable dividends: $1,861 (reported on 13.0% of returns)
Here:
$1,861
State:
$2,998
(% of AGI for various income ranges: 1.0% for AGIs below $10k, 1.0% for AGIs $10k-25k, 0.5% for AGIs $25k-50k, 0.5% for AGIs $50k-75k, 0.2% for AGIs $75k-100k, 1.9% for AGIs over 100k)
Net capital gain/loss: +$4,245 (reported on 7.9% of returns)
Here:
+$4,245
State:
+$8,619
(% of AGI for various income ranges: -0.7% for AGIs below $10k, -0.0% for AGIs $10k-25k, 0.2% for AGIs $25k-50k, 0.3% for AGIs $50k-75k, 0.5% for AGIs $75k-100k, 6.1% for AGIs over 100k)
Profit/loss from business: +$7,001 (reported on 7.4% of returns)
Here:
+$7,001
State:
+$10,071
(% of AGI for various income ranges: 1.8% for AGIs below $10k, 2.9% for AGIs $10k-25k, 1.1% for AGIs $25k-50k, 1.3% for AGIs $50k-75k, 0.8% for AGIs $75k-100k, 2.2% for AGIs over 100k)
IRA payment deduction: $1,959 (reported on 1.7% of returns)
46323:
$1,959
Indiana:
$2,840
(% of AGI for various income ranges: 0.1% for AGIs $10k-25k, 0.1% for AGIs $25k-50k, 0.1% for AGIs $50k-75k, 0.1% for AGIs $75k-100k)
Total itemized deductions: $13,107 (22% of AGI, reported on 22.4% of returns)
Here:
$13,107
State:
$17,065
Here:
22.0% of AGI
State:
19.5% of AGI
(% of AGI for various income ranges: 7.6% for AGIs below $10k, 4.9% for AGIs $10k-25k, 8.1% for AGIs $25k-50k, 9.4% for AGIs $50k-75k, 9.0% for AGIs $75k-100k, 10.4% for AGIs over 100k)
Charity contributions deductions: $2,176 (3% of AGI, reported on 18.5% of returns)
Here:
$2,176
State:
$3,550
Here:
3.5% of AGI
State:
3.8% of AGI
(% of AGI for various income ranges: 0.2% for AGIs below $10k, 0.5% for AGIs $10k-25k, 1.0% for AGIs $25k-50k, 1.4% for AGIs $50k-75k, 1.3% for AGIs $75k-100k, 1.6% for AGIs over 100k)
Total tax: $4,196 (reported on 70.9% of returns)
46323:
$4,196
State:
$6,914
(% of AGI for various income ranges: 1.5% for AGIs below $10k, 3.5% for AGIs $10k-25k, 6.5% for AGIs $25k-50k, 9.0% for AGIs $50k-75k, 11.1% for AGIs $75k-100k, 16.5% for AGIs over 100k)
Earned income credit: $1,751 (reported on 19.1% of returns)
Here:
$1,751
State:
$1,685
Percentage of individuals using paid preparers for their 2004 taxes: 59.8%
Here:
60%
State:
59%
(% for various income ranges: 50.6% for AGIs below $10k, 62.5% for AGIs $10k-25k, 61.1% for AGIs $25k-50k, 63.1% for AGIs $50k-75k, 61.6% for AGIs $75k-100k, 64.3% for AGIs over 100k)
Likely homosexual households (counted as self-reported same-sex unmarried-partner households)
Lesbian couples: 0.7% of all households
Gay men: 0.0% of all households
Household received Food Stamps/SNAP in the past 12 months: 1,402 Household did not receive Food Stamps/SNAP in the past 12 months: 7,049
Women who had a birth in the past 12 months: 448 (162 now married, 253 unmarried) Women who did not have a birth in the past 12 months: 5,716 (1,737 now married, 3,966 unmarried)
Housing units in zip code 46323 with a mortgage: 3,292 (365 second mortgage, 36 home equity loan, 307 both second mortgage and home equity loan) Houses without a mortgage: 104
Median monthly owner costs for units with a mortgage: $1,125 Median monthly owner costs for units without a mortgage: $450
Residents with income below the poverty level in 2022:
This zip code:
15.8%
Whole state:
12.6%
Residents with income below 50% of the poverty level in 2022:
This zip code:
6.2%
Whole state:
6.3%
Median number of rooms in houses and condos:
Here:
6.0
State:
6.6
Median number of rooms in apartments:
Here:
4.5
State:
4.3
Notable locations in this zip code not listed on our city pages
Notable locations in zip code 46323: Kennedy Industrial Park (A), Andrey A Potter Laboratory Building (B), Hansen Branch Hammond Public Library (C), Hammond Fire Department Station 8 (D), Hammond Fire Department Station 6 (E), Student Faculty Library Center (F), Millard E Gyte Building (G), Gyte Annex (H), Gene Stratton Porter Hall (I), Edward D Anderson Building (J), Donald S Powers Computer Education Building (K), C H Lawshe Hall (L). Display/hide their locations on the map
Churches in zip code 46323 include: Cline Gardens Church (A), Assembly of God Church of Hessville (B), Briar East Baptist Church (C), Church of God of Prophecy (D), Cline Gardens Christian Church (E), Covenant Presbyterian Church (F), Faith United Church of Christ (G), First Christian Church of Hessville (H), Hessville Baptist Church (I). Display/hide their locations on the map
Parks in zip code 46323 include: Phrommer Park (1), Harding Park (2), Dowling Park (3), Gibson Woods Park (4), Lost Park (5), Hessville Park (6), Kennedy Park (7), Optimist Park (8). Display/hide their locations on the map
2,216 married couples with children.
2,043 single-parent households (367 men, 1,676 women).
76.6% of residents of 46323 zip code speak English at home.
21.7% of residents speak Spanish at home (60% very well, 22% well, 16% not well, 2% not at all).
1.4% of residents speak other Indo-European language at home (44% very well, 46% well, 10% not well).
0.3% of residents speak Asian or Pacific Island language at home (47% very well, 43% well, 10% not well).
1.1% of residents speak other language at home (83% very well, 12% well, 5% not at all).
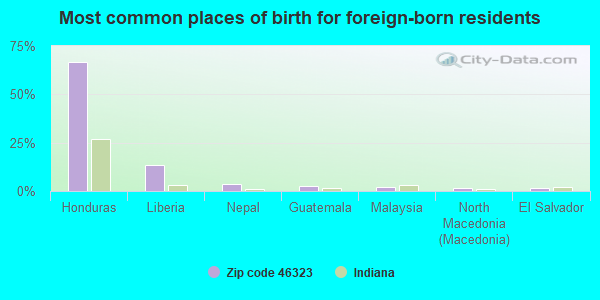
Foreign born population: 2,198 (9.3%) (50.2% of them are naturalized citizens)
This zip code:
9.3%
Whole state:
6.1%
67%Honduras
13%Liberia
4%Nepal
3%Guatemala
2%Malaysia
2%North Macedonia (Macedonia)
1%El Salvador
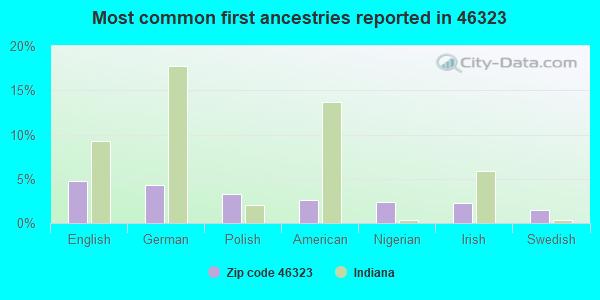
5%English
4%German
3%Polish
3%American
2%Nigerian
2%Irish
1%Swedish
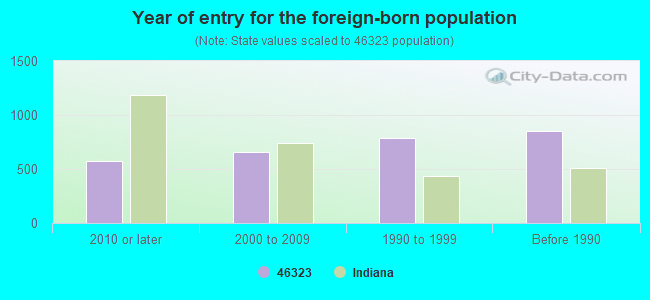
Year of entry for the foreign-born population
5782010 or later
6622000 to 2009
7831990 to 1999
852Before 1990
Major facilities with environmental interests located in this zip code:
HALSTAB DIV HAMMOND LEAD (3100 MICHIGAN ST. in HAMMOND, IN)
AIR SYNTHETIC MINOR (AIRS/AFS) STATE MASTER (Indiana facility tracking) - ACES-OP-08900218, AIR PROGRAM, CRTK-1607, EPCRA, RBLC-1032, AIR MAJOR COMPLIANCE ACTIVITY (Tracking inspections of insecticide, fungicide, and rodenticide, and toxic substances) CRITERIA AND HAZARDOUS AIR POLLUTANT INVENTORY (Inventory of air pollution sources) Large Quantity Generators, more that 1000 kg of hazardous waste/month (Resource Conservation and Recovery Act (tracking hazardous waste)) TRI REPORTER (Tracking of toxic chemicals releasing facilities) Business SIC classification: INDUSTRIAL INORGANIC CHEMICALS Business NAICS classification: INORGANIC DYE AND PIGMENT MANUFACTURING.; ALL OTHER MISCELLANEOUS CHEMICAL PRODUCT AND PREPARATION MANUFACTURING. Organizations: HALSTAB DIV HAMMOND GROUP INC (CONTACT/OPERATOR)
, HAMMOND GROUP INC (CONTACT/OWNER)
Alternative names: HAMMOND GROUP INC., HALSTAB DIV., HAMMOND GROUP INC. HALSTAB DIV., HAMMOND LEAD-HALSTAB, HAMMOND LEAD PROD HALSTAB DIV
HARBISON WALKER REFRACTORIES (5501 KENNEDY AVE in HAMMOND, IN)
AIR MAJOR (AIRS/AFS) STATE MASTER (Indiana facility tracking) - ACES-OP-08900222, AIR PROGRAM, CRTK-1740, EPCRA COMPLIANCE ACTIVITY (Tracking inspections of insecticide, fungicide, and rodenticide, and toxic substances) CRITERIA AND HAZARDOUS AIR POLLUTANT INVENTORY (Inventory of air pollution sources) National Pollutant Discharge Elimination System NON-MAJOR (Tracking pollutant discharge elimination systems) - permit (Resource Conservation and Recovery Act (tracking hazardous waste)) TRI REPORTER (Tracking of toxic chemicals releasing facilities) Business SIC classification: NONCLAY REFRACTORIES Business NAICS classification: NONCLAY REFRACTORY MANUFACTURING. Organizations: NO CERTIFIED OPERATOR (CONTACT/OPERATOR)
, HARBISON WALKER REFRACTORIES DRESSER IND (CONTACT/OWNER)
, RESCO PRODUCTS INC (CONTACT/OWNER)
Alternative names: HARBISON-WALKER REFRACTORIES CHAMMOND PLANT, HARBISON WALKER REFRACTORIES HAMMOND WOR, RESCO PRODS. INC.
AGA GAS INCORPORATED (3930 MICHIGAN AVE in HAMMOND, IN)
ENFORCEMENT/COMPLIANCE ACTIVITY (Integrated Compliance Information System) STATE MASTER (Indiana facility tracking) - CRTK-2836, EPCRA, LUST-198910038, LEAKING STORAGE TANK, UST-927, UNDERGROUND STORAGE TANK PROGRAM COMPLIANCE ACTIVITY (Tracking inspections of insecticide, fungicide, and rodenticide, and toxic substances) National Pollutant Discharge Elimination System NON-MAJOR (Tracking pollutant discharge elimination systems) - permit Conditionally Exempt Small Quantity Generators, less than 100 kg/month of hazardous waste (Resource Conservation and Recovery Act (tracking hazardous waste)) TRI REPORTER (Tracking of toxic chemicals releasing facilities) Business SIC classification: INDUSTRIAL GASES; CHEMICALS AND ALLIED PRODUCTS Organizations: CHARLES MORSE (CONTACT/OPERATOR)
Alternative names: AGA GAS CENTRAL, LINDE GAS, LINDE GAS LLC
DANA TRANSPORT (5723 KENNEDY AVE in HAMMOND, IN)
STATE MASTER (Indiana facility tracking) - ACES-OP-08900258, AIR PROGRAM, LUST-198906150, LEAKING STORAGE TANK, LUST-198909517, UST-7842, UNDERGROUND STORAGE TANK PROGRAM National Pollutant Discharge Elimination System NON-MAJOR (Tracking pollutant discharge elimination systems) - permit HAZARDOUS WASTE BIENNIAL REPORTER (Resource Conservation and Recovery Act (tracking hazardous waste)) (Resource Conservation and Recovery Act (tracking hazardous waste)) Business NAICS classification: GENERAL AUTOMOTIVE REPAIR. Organizations: GEORGE WADE (CONTACT/OWNER)
, DANA RON (CONTACT/OWNER)
AMOCO NO 6233 (6860 KENNEDY AVE in HAMMOND, IN)
STATE MASTER (Indiana facility tracking) - CRTK-7338, EPCRA, UST-11489, UNDERGROUND STORAGE TANK PROGRAM (Resource Conservation and Recovery Act (tracking hazardous waste)) Organizations: AMOCO OIL CO (CONTACT/OWNER)
Alternative names: AMOCO 6233, AMOCO DANS
HAMMOND GROUP INCORPORATED HALOX DIVISION (2340 165TH ST in HAMMOND, IN)
AIR MINOR (AIRS/AFS) STATE MASTER (Indiana facility tracking) - CRTK-1606, EPCRA (Resource Conservation and Recovery Act (tracking hazardous waste)) Business SIC classification: INDUSTRIAL INORGANIC CHEMICALS Organizations: HAMMOND LEAD PRODUCTS INC (CONTACT/OWNER)
Alternative names: HAMMOND LEAD PRODUCTS INC HALSTAB DIV
AMOCO SERVICE STATION 6281 (6850 INDIANAPOLIS BLV in HAMMOND, IN)
STATE MASTER (Indiana facility tracking) - CRTK-7341, EPCRA, UST-11989, UNDERGROUND STORAGE TANK PROGRAM (Resource Conservation and Recovery Act (tracking hazardous waste)) Conditionally Exempt Small Quantity Generators, less than 100 kg/month of hazardous waste (Resource Conservation and Recovery Act (tracking hazardous waste)) - notification TRANSPORTER (Resource Conservation and Recovery Act (tracking hazardous waste)) - notification Organizations: AMOCO OIL CO (CONTACT/OWNER)
, BP PRODUCTS NORTH AMERICA INC (CONTACT/OWNER)
Alternative names: ACA MANAGEMENT, AMOCO 6281
POMPS TIRE SERVICE INC (7930 NEW JERSEY AVE in HAMMOND, IN)
AIR SYNTHETIC MINOR (AIRS/AFS) STATE MASTER (Indiana facility tracking) - ACES-OP-08900255, AIR PROGRAM CRITERIA AND HAZARDOUS AIR POLLUTANT INVENTORY (Inventory of air pollution sources) (Resource Conservation and Recovery Act (tracking hazardous waste)) Business SIC classification: TIRE RETREADING AND REPAIR SHOPS Business NAICS classification: ALL OTHER AUTOMOTIVE REPAIR AND MAINTENANCE. Organizations: METRO RESOURCE INV (CONTACT/OWNER)
Alternative names: HOBART CORP
PURDUE UNIVERSITY CALUMET (2200 169TH ST in HAMMOND, IN)
AIR MINOR (AIRS/AFS) STATE MASTER (Indiana facility tracking) - ACES-OP-08900249, AIR PROGRAM, CRTK-9646, EPCRA COMPLIANCE ACTIVITY (Tracking inspections of insecticide, fungicide, and rodenticide, and toxic substances) CRITERIA AND HAZARDOUS AIR POLLUTANT INVENTORY (Inventory of air pollution sources) Business SIC classification: COLLEGES, UNIVERSITIES, AND PROFESSIONAL SCHOOLS Alternative names: PURDUE UNIVERSITY/ CALUMET CENTER
HAMMOND GROUP INC (6530 SCHNEIDER RD in HAMMOND, IN)
STATE MASTER (Indiana facility tracking) - LUST-199101541, LEAKING STORAGE TANK, UST-20204, UNDERGROUND STORAGE TANK PROGRAM (Resource Conservation and Recovery Act (tracking hazardous waste)) Organizations: WESTINGHOUSE ELECTRIC (CONTACT/OWNER)
Alternative names: VALRECON
HAMMOND HIGH SCHOOL (5926 CALUMET AVE in HAMMOND, IN)
(Geographic Names Information System) STATE MASTER (Indiana facility tracking) (National Center for Education Statistics) - STATE ID-4415 Conditionally Exempt Small Quantity Generators, less than 100 kg/month of hazardous waste (Resource Conservation and Recovery Act (tracking hazardous waste)) - notification Organizations: SCHOOL CITY OF HAMMOND (CONTACT/OWNER)
HAMMOND MORTON HIGH SCHOOL (6915 GRAND AVE in HAMMOND, IN)
(Geographic Names Information System) STATE MASTER (Indiana facility tracking) - CRTK-9624, EPCRA Conditionally Exempt Small Quantity Generators, less than 100 kg/month of hazardous waste (Resource Conservation and Recovery Act (tracking hazardous waste)) HAZARDOUS WASTE BIENNIAL REPORTER (Resource Conservation and Recovery Act (tracking hazardous waste)) Organizations: SCHOOL CITY OF HAMMOND (CONTACT/OWNER)
Alternative names: MORTON SENIOR HIGH SCHOOL
PROVAR INC (6217 KENNEDY in HAMMOND, IN)
STATE MASTER (Indiana facility tracking) - CRTK-9177, EPCRA (Resource Conservation and Recovery Act (tracking hazardous waste))
Housing units lacking complete plumbing facilities: 2.1% Housing units lacking complete kitchen facilities: 3.7%
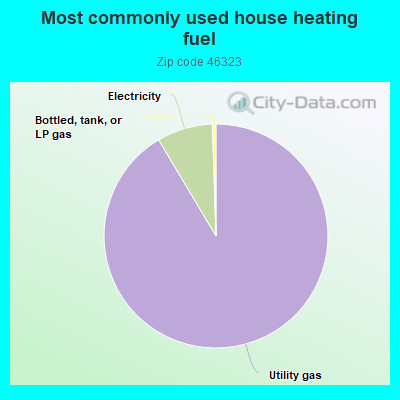
90.9%Utility gas
8.0%Electricity
0.5%Bottled, tank, or LP gas
Population in 1990: 23,456. Population change in the 1990s: +168 (+0.7%).
Place of birth for U.S.-born residents:
This state: 11,817
Northeast: 185
Midwest: 6,881
South: 1,502
West: 368
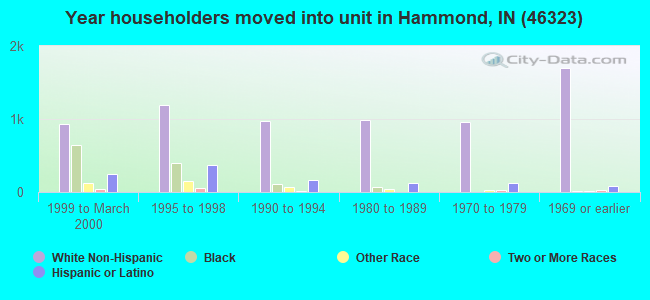
61% of the 46323 zip code residents lived in the same house 5 years ago. Out of people who lived in different houses, 67% lived in this county. Out of people who lived in different counties, 50% lived in Indiana.
89% of the 46323 zip code residents lived in the same house 1 year ago. Out of people who lived in different houses, 49% moved from this county. Out of people who lived in different houses, 16% moved from different county within same state. Out of people who lived in different houses, 31% moved from different state. Out of people who lived in different houses, 5% moved from abroad.
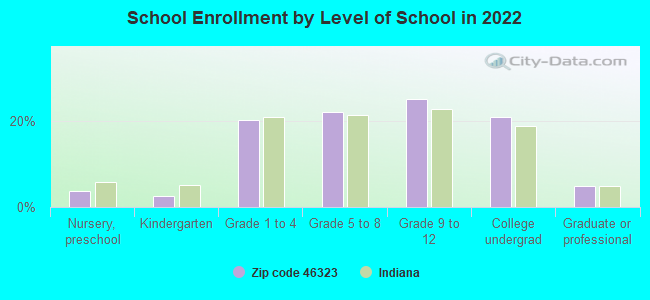
Private vs. public school enrollment:
Students in private schools in grades 1 to 8 (elementary and middle school): 539
Here:
20.3%
Indiana:
14.9%
Students in private schools in grades 9 to 12 (high school): 18
Here:
1.2%
Indiana:
11.4%
Students in private undergraduate colleges: 214
Here:
16.3%
Indiana:
22.3%
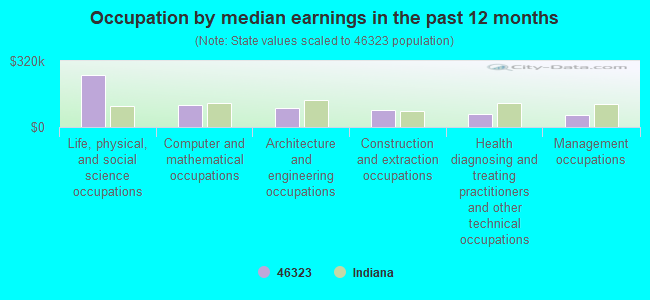
Occupation by median earnings in the past 12 months ($)
253,095Life, physical, and social science occupations
105,771Computer and mathematical occupations
92,798Architecture and engineering occupations
80,557Construction and extraction occupations
61,368Health diagnosing and treating practitioners and other technical occupations
57,525Management occupations
Companies with federal contracts located in this zip code:
PRIMET FLUID POWER CO , INC (7917 NEW JERSEY STREET in HAMMOND, IN; small business) : $173,470 in 9 contractsfrom 2001 to 2006
Contracts for Power and Hand Pumps, Valves, Nonpowered, Centrifugals, Separators, and Pressure and Vacuum Filters, Valves, Powered, and moreby Defense Logistics Agency, Bureau of Reclamation Signed by year:2000: $0; 2001: $33,240; 2002: $0; 2003: $83,979; 2004: $38,992; 2005: $12,613; 2006: $4,646.
Biggest contracts:
$83,979 with Defense Logistics Agency for Power and Hand Pumps. Signed on 2003-10-17. Completion date: 2004-08-12.
$33,240 with Defense Logistics Agency for Valves, Nonpowered. Signed on 2001-12-17. Completion date: 2002-04-16.
$33,034 with Defense Logistics Agency for Centrifugals, Separators, and Pressure and Vacuum Filters. Signed on 2004-04-10. Completion date: 2004-07-09.
$5,458 with Defense Logistics Agency for Valves, Powered. Signed on 2005-05-11. Completion date: 2005-07-04.
CROWELL INDUSTRIES (7242 KENNEDY AVE in HAMMOND, IN; small business)
$28,125 with Navy for Individual Equipment. Signed on 2000-05-25. Completion date: 2000-05-25.
Top industries in this zip code by the number of employees in 2005:
2003 - 2015 National Fire Incident Reporting System (NFIRS) incidents
According to the data from the years 2003 - 2015 the average number of fire incidents per year is 55. The highest number of fire incidents - 104 took place in 2007, and the least - 18 in 2015. The data has a decreasing trend.
When looking into fire subcategories, the most reports belonged to: Outside Fires (36.6%), and Structure Fires (30.9%).
Fire incident types reported to NFIRS in Zip Code 46323

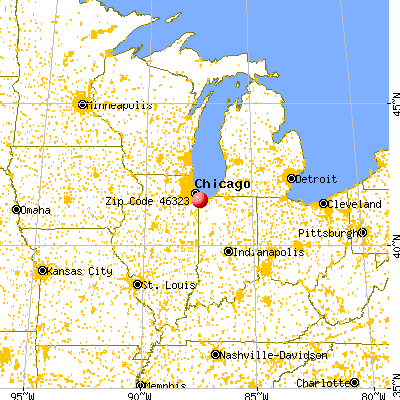


 Nearest zip codes: 46322, 46406, 46324, 46312, 46327, 46321.


 According to the data from the years 2003 - 2015 the average number of fire incidents per year is 55. The highest number of fire incidents - 104 took place in 2007, and the least - 18 in 2015. The data has a decreasing trend.
 When looking into fire subcategories, the most reports belonged to: Outside Fires (36.6%), and Structure Fires (30.9%).