Estimated zip code population in 2022: 23,901 Zip code population in 2010: 23,603 Zip code population in 2000: 21,511
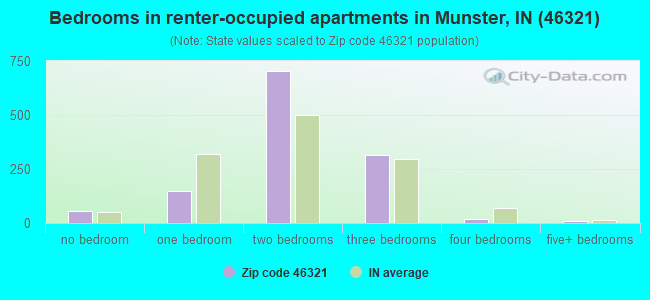
Houses and condos: 9,918 Renter-occupied apartments: 1,257
% of renters here:
13%
State:
29%
March 2022 cost of living index in zip code 46321: 95.6 (near average, U.S. average is 100)
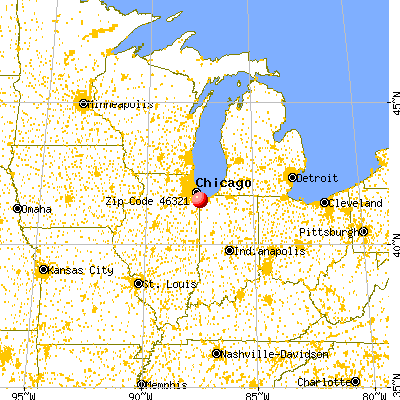
Land area: 7.6 sq. mi. Water area: 0.1 sq. mi.
Population density: 3,157 people per square mile
(average).
OSM Map
General Map
Google Map
MSN Map
OSM Map
General Map
Google Map
MSN Map
OSM Map
General Map
Google Map
MSN Map
OSM Map
General Map
Google Map
MSN Map
Please wait while loading the map...
Real estate property taxes paid for housing units in 2022:
This zip code:
1.2% ($3,699)
Indiana:
0.7% ($1,467)
Median real estate property taxes paid for housing units with mortgages in 2022: $3,723 (1.1%) Median real estate property taxes paid for housing units with no mortgage in 2022: $3,745 (1.3%)
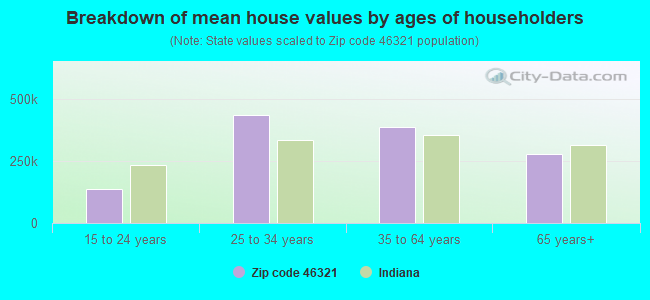
Estimated median house/condo value in 2022: $320,780
46321:
$320,780
Indiana:
$208,700
According to our research of Indiana and other state lists, there were 2 registered sex offenders living in 46321 zip code as of April 27, 2024. The ratio of all residents to sex offenders in zip code 46321 is 11,717 to 1. The ratio of registered sex offenders to all residents in this zip code is much lower than the state average.
Median resident age:
This zip code:
45.8 years
Indiana median age:
38.2 years
Average household size:
This zip code:
2.5 people
Indiana:
2.4 people
Averages for the 2020 tax year for zip code 46321, filed in 2021:
Average Adjusted Gross Income (AGI) in 2020: $102,118 (Individual Income Tax Returns)
Here:
$102,118
State:
$64,978
Salary/wage: $87,312 (reported on 77.2% of returns)
Here:
$87,312
State:
$55,245
(% of AGI for various income ranges: 1099.1% for AGIs below $25k, 3206.8% for AGIs $25k-50k, 6005.4% for AGIs $50k-75k, 8957.4% for AGIs $75k-100k, 17827.0% for AGIs $100k-200k, 78904.1% for AGIs over 200k)
Taxable interest for individuals: $2,503 (reported on 41.9% of returns)
This zip code:
$2,503
Indiana:
$1,351
(% of AGI for various income ranges: 42.4% for AGIs below $25k, 65.0% for AGIs $25k-50k, 86.5% for AGIs $50k-75k, 98.7% for AGIs $75k-100k, 191.2% for AGIs $100k-200k, 1536.2% for AGIs over 200k)
Ordinary dividends: $8,242 (reported on 34.0% of returns)
Here:
$8,242
State:
$5,827
(% of AGI for various income ranges: 69.5% for AGIs below $25k, 102.2% for AGIs $25k-50k, 221.1% for AGIs $50k-75k, 287.3% for AGIs $75k-100k, 496.4% for AGIs $100k-200k, 4622.4% for AGIs over 200k)
Net capital gain/loss in AGI: +$19,968 (reported on 29.9% of returns)
Here:
+$19,968
State:
+$17,730
(% of AGI for various income ranges: 38.8% for AGIs below $25k, 63.2% for AGIs $25k-50k, 140.0% for AGIs $50k-75k, 261.5% for AGIs $75k-100k, 633.9% for AGIs $100k-200k, 14740.5% for AGIs over 200k)
Profit/loss from business: +$16,018 (reported on 14.3% of returns)
Here:
+$16,018
State:
+$12,144
(% of AGI for various income ranges: 108.9% for AGIs below $25k, 130.2% for AGIs $25k-50k, 175.9% for AGIs $50k-75k, 230.3% for AGIs $75k-100k, 497.0% for AGIs $100k-200k, 2967.0% for AGIs over 200k)
Taxable individual retirement arrangement distribution: $21,592 (reported on 14.6% of returns)
46321:
$21,592
Indiana:
$18,302
(% of AGI for various income ranges: 107.0% for AGIs below $25k, 205.1% for AGIs $25k-50k, 376.0% for AGIs $50k-75k, 536.2% for AGIs $75k-100k, 914.7% for AGIs $100k-200k, 2260.8% for AGIs over 200k)
Self-employed (Keogh) retirement plans: $25,711 (reported on 0.8% of returns)
46321:
$25,711
Indiana:
$27,160
(% of AGI for various income ranges: 28.7% for AGIs $100k-200k, 502.7% for AGIs over 200k)
Total itemized deductions: $32,859 (reported on 11.8% of returns)
Here:
$32,859
State:
$35,601
(% of AGI for various income ranges: 76.4% for AGIs below $25k, 198.4% for AGIs $25k-50k, 364.3% for AGIs $50k-75k, 547.8% for AGIs $75k-100k, 867.2% for AGIs $100k-200k, 4957.6% for AGIs over 200k)
Charity contributions: $9,616 (reported on 9.8% of returns)
Here:
$9,616
State:
$15,596
(% of AGI for various income ranges: 5.1% for AGIs below $25k, 22.6% for AGIs $25k-50k, 55.2% for AGIs $50k-75k, 98.0% for AGIs $75k-100k, 208.9% for AGIs $100k-200k, 1586.2% for AGIs over 200k)
Taxes paid: $8,349 (reported on 11.8% of returns)
46321:
$8,349
State:
$7,542
(% of AGI for various income ranges: 11.0% for AGIs below $25k, 35.9% for AGIs $25k-50k, 95.0% for AGIs $50k-75k, 171.9% for AGIs $75k-100k, 273.8% for AGIs $100k-200k, 1035.1% for AGIs over 200k)
Earned income credit: $2,020 (reported on 7.0% of returns)
Here:
$2,020
State:
$2,298
(% of AGI for various income ranges: 58.3% for AGIs below $25k, 40.4% for AGIs $25k-50k)
Percentage of individuals using paid preparers for their 2020 taxes: 91.3%
Here:
91%
State:
94%
(% for various income ranges: 89.9% for AGIs below $25k, 90.7% for AGIs $25k-50k, 92.0% for AGIs $50k-75k, 90.9% for AGIs $75k-100k, 92.2% for AGIs $100k-200k, 93.8% for AGIs over 200k)
Averages for the 2012 tax year for zip code 46321, filed in 2013:
Average Adjusted Gross Income (AGI) in 2012: $84,741 (Individual Income Tax Returns)
Here:
$84,741
State:
$52,932
Salary/wage: $71,852 (reported on 78.0% of returns)
Here:
$71,852
State:
$45,173
(% of AGI for various income ranges: 62.1% for AGIs below $25k, 66.8% for AGIs $25k-50k, 69.2% for AGIs $50k-75k, 72.5% for AGIs $75k-100k, 77.8% for AGIs $100k-200k, 53.7% for AGIs over 200k)
Taxable interest for individuals: $1,947 (reported on 49.7% of returns)
This zip code:
$1,947
Indiana:
$1,311
(% of AGI for various income ranges: 3.5% for AGIs below $25k, 1.7% for AGIs $25k-50k, 1.2% for AGIs $50k-75k, 1.0% for AGIs $75k-100k, 0.8% for AGIs $100k-200k, 1.1% for AGIs over 200k)
Ordinary dividends: $7,543 (reported on 35.7% of returns)
Here:
$7,543
State:
$4,690
(% of AGI for various income ranges: 4.5% for AGIs below $25k, 2.6% for AGIs $25k-50k, 2.5% for AGIs $50k-75k, 2.7% for AGIs $75k-100k, 2.2% for AGIs $100k-200k, 4.4% for AGIs over 200k)
Net capital gain/loss in AGI: +$9,814 (reported on 27.0% of returns)
Here:
+$9,814
State:
+$10,406
(% of AGI for various income ranges: 0.3% for AGIs $25k-50k, 0.7% for AGIs $50k-75k, 0.8% for AGIs $75k-100k, 0.7% for AGIs $100k-200k, 7.5% for AGIs over 200k)
Profit/loss from business: +$22,012 (reported on 13.0% of returns)
Here:
+$22,012
State:
+$11,105
(% of AGI for various income ranges: 6.3% for AGIs below $25k, 3.4% for AGIs $25k-50k, 3.2% for AGIs $50k-75k, 2.7% for AGIs $75k-100k, 2.5% for AGIs $100k-200k, 4.1% for AGIs over 200k)
Taxable individual retirement arrangement distribution: $23,011 (reported on 17.2% of returns)
46321:
$23,011
Indiana:
$13,841
(% of AGI for various income ranges: 7.1% for AGIs below $25k, 5.2% for AGIs $25k-50k, 5.1% for AGIs $50k-75k, 4.0% for AGIs $75k-100k, 4.4% for AGIs $100k-200k, 4.6% for AGIs over 200k)
Self-employment retirement plans: $23,367 (reported on 1.0% of returns)
46321:
$23,367
Indiana:
$21,482
Total itemized deductions: $23,996 (17% of AGI, reported on 45.8% of returns)
Here:
$23,996
State:
$20,913
Here:
16.9% of AGI
State:
18.2% of AGI
(% of AGI for various income ranges: 18.1% for AGIs below $25k, 13.5% for AGIs $25k-50k, 14.5% for AGIs $50k-75k, 14.1% for AGIs $75k-100k, 14.1% for AGIs $100k-200k, 10.6% for AGIs over 200k)
Charity contributions: $3,837 (reported on 39.6% of returns)
Here:
$3,837
State:
$4,697
(% of AGI for various income ranges: 1.3% for AGIs below $25k, 1.5% for AGIs $25k-50k, 1.7% for AGIs $50k-75k, 1.8% for AGIs $75k-100k, 1.9% for AGIs $100k-200k, 1.8% for AGIs over 200k)
Taxes paid: $9,932 (reported on 45.6% of returns)
46321:
$9,932
State:
$7,456
(% of AGI for various income ranges: 3.8% for AGIs below $25k, 3.8% for AGIs $25k-50k, 4.7% for AGIs $50k-75k, 5.1% for AGIs $75k-100k, 6.1% for AGIs $100k-200k, 5.5% for AGIs over 200k)
Earned income credit: $1,875 (reported on 7.0% of returns)
Here:
$1,875
State:
$2,265
(% of AGI for various income ranges: 2.9% for AGIs below $25k, 0.5% for AGIs $25k-50k)
Percentage of individuals using paid preparers for their 2012 taxes: 61.2%
Here:
61%
State:
53%
(% for various income ranges: 54.1% for AGIs below $25k, 62.3% for AGIs $25k-50k, 64.8% for AGIs $50k-75k, 61.2% for AGIs $75k-100k, 63.4% for AGIs $100k-200k, 79.3% for AGIs over 200k)
Averages for the 2004 tax year for zip code 46321, filed in 2005:
Average Adjusted Gross Income (AGI) in 2004: $69,801 (Individual Income Tax Returns)
Here:
$69,801
State:
$44,790
Salary/wage: $60,092 (reported on 76.6% of returns)
Here:
$60,092
State:
$39,615
(% of AGI for various income ranges: 123.8% for AGIs below $10k, 52.3% for AGIs $10k-25k, 66.3% for AGIs $25k-50k, 73.4% for AGIs $50k-75k, 78.3% for AGIs $75k-100k, 61.1% for AGIs over 100k)
Taxable interest for individuals: $2,448 (reported on 69.8% of returns)
This zip code:
$2,448
Indiana:
$1,535
(% of AGI for various income ranges: 20.6% for AGIs below $10k, 7.5% for AGIs $10k-25k, 3.8% for AGIs $25k-50k, 2.6% for AGIs $50k-75k, 1.5% for AGIs $75k-100k, 1.9% for AGIs over 100k)
Taxable dividends: $4,361 (reported on 45.0% of returns)
Here:
$4,361
State:
$2,998
(% of AGI for various income ranges: 15.3% for AGIs below $10k, 4.8% for AGIs $10k-25k, 3.0% for AGIs $25k-50k, 2.5% for AGIs $50k-75k, 1.7% for AGIs $75k-100k, 2.8% for AGIs over 100k)
Net capital gain/loss: +$11,430 (reported on 33.7% of returns)
Here:
+$11,430
State:
+$8,619
(% of AGI for various income ranges: -5.5% for AGIs below $10k, 0.6% for AGIs $10k-25k, 0.8% for AGIs $25k-50k, 0.8% for AGIs $50k-75k, 1.4% for AGIs $75k-100k, 8.9% for AGIs over 100k)
Profit/loss from business: +$23,434 (reported on 13.4% of returns)
Here:
+$23,434
State:
+$10,071
(% of AGI for various income ranges: 3.9% for AGIs below $10k, 4.7% for AGIs $10k-25k, 4.1% for AGIs $25k-50k, 2.7% for AGIs $50k-75k, 3.1% for AGIs $75k-100k, 5.3% for AGIs over 100k)
IRA payment deduction: $3,435 (reported on 3.9% of returns)
46321:
$3,435
Indiana:
$2,840
(% of AGI for various income ranges: 0.9% for AGIs below $10k, 0.3% for AGIs $10k-25k, 0.4% for AGIs $25k-50k, 0.3% for AGIs $50k-75k, 0.2% for AGIs $75k-100k, 0.1% for AGIs over 100k)
Self-employed pension: $17,757 (reported on 1.5% of returns)
Here:
$17,757
Indiana:
$15,305
Total itemized deductions: $20,347 (17% of AGI, reported on 45.3% of returns)
Here:
$20,347
State:
$17,065
Here:
17.3% of AGI
State:
19.5% of AGI
(% of AGI for various income ranges: 28.8% for AGIs below $10k, 17.9% for AGIs $10k-25k, 15.1% for AGIs $25k-50k, 15.2% for AGIs $50k-75k, 14.9% for AGIs $75k-100k, 11.5% for AGIs over 100k)
Charity contributions deductions: $3,865 (3% of AGI, reported on 41.6% of returns)
Here:
$3,865
State:
$3,550
Here:
3.1% of AGI
State:
3.8% of AGI
(% of AGI for various income ranges: 1.4% for AGIs below $10k, 1.7% for AGIs $10k-25k, 1.9% for AGIs $25k-50k, 2.1% for AGIs $50k-75k, 2.3% for AGIs $75k-100k, 2.5% for AGIs over 100k)
Total tax: $13,452 (reported on 79.5% of returns)
46321:
$13,452
State:
$6,914
(% of AGI for various income ranges: 4.0% for AGIs below $10k, 4.3% for AGIs $10k-25k, 7.6% for AGIs $25k-50k, 9.2% for AGIs $50k-75k, 10.5% for AGIs $75k-100k, 20.0% for AGIs over 100k)
Earned income credit: $1,335 (reported on 5.0% of returns)
Here:
$1,335
State:
$1,685
Percentage of individuals using paid preparers for their 2004 taxes: 61.7%
Here:
62%
State:
59%
(% for various income ranges: 53.8% for AGIs below $10k, 60.5% for AGIs $10k-25k, 63.4% for AGIs $25k-50k, 63.1% for AGIs $50k-75k, 63.2% for AGIs $75k-100k, 68.3% for AGIs over 100k)
Household received Food Stamps/SNAP in the past 12 months: 149 Household did not receive Food Stamps/SNAP in the past 12 months: 9,382
Women who had a birth in the past 12 months: 103 (96 now married, 12 unmarried) Women who did not have a birth in the past 12 months: 5,253 (2,241 now married, 3,010 unmarried)
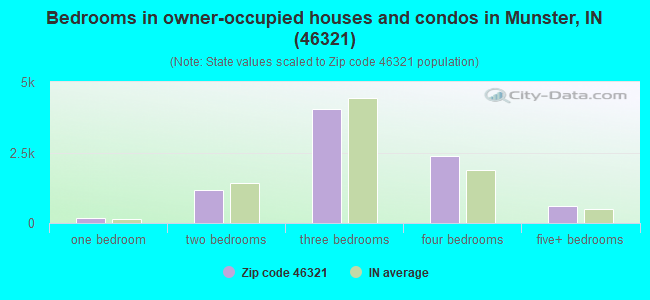
Housing units in zip code 46321 with a mortgage: 5,241 (624 second mortgage, 76 home equity loan, 558 both second mortgage and home equity loan) Houses without a mortgage: 165
Median monthly owner costs for units with a mortgage: $1,743 Median monthly owner costs for units without a mortgage: $690
Residents with income below the poverty level in 2022:
This zip code:
7.5%
Whole state:
12.6%
Residents with income below 50% of the poverty level in 2022:
This zip code:
3.8%
Whole state:
6.3%
Median number of rooms in houses and condos:
Here:
6.8
State:
6.6
Median number of rooms in apartments:
Here:
4.3
State:
4.3
Notable locations in this zip code not listed on our city pages
Notable locations in zip code 46321: Munster Town Hall (A), Munster Branch Lake County Public Library (B), Munster Fire Department Station 2 (C), Munster Fire Department Station 1 (D), Munster Fire Department Station 3 (E). Display/hide their locations on the map
Churches in zip code 46321 include: Saint Pauls Evangelical Lutheran Church (A), Fair Meadows Community Church (B), First Church of God (C), Munster Christian Church (D), New Harvest Church of God (E), Saint Thomas More Church (F), Trinity Reformed Church (G), Faith Baptist Church (H), Munster Bible Church (I). Display/hide their locations on the map
Parks in zip code 46321 include: Bieker Woods Park (1), Circle Park (2), Stewart Park (3), Beech Park (4), Orchard Park (5), Twin Creek Park (6). Display/hide their locations on the map
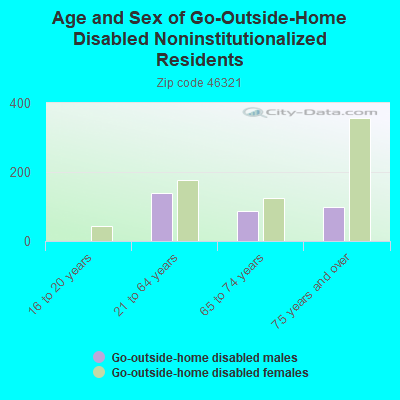
In group quarters: 360 (-1 institutionalized population)
Size of family households: 2,943 2-persons, 1,649 3-persons, 1,299 4-persons, 457 5-persons, 81 6-persons, 87 7-or-more-persons
Size of nonfamily households: 2,623 1-person, 370 2-persons, 28 4-persons
3,526 married couples with children.
615 single-parent households (182 men, 433 women).
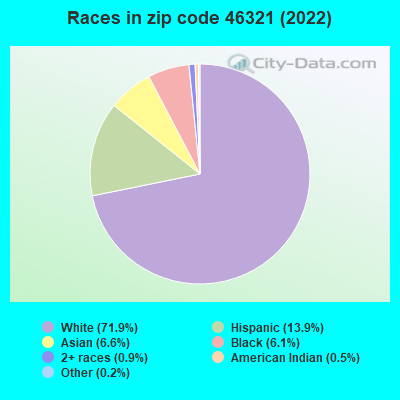
84.4% of residents of 46321 zip code speak English at home.
7.3% of residents speak Spanish at home (80% very well, 8% well, 10% not well, 2% not at all).
5.7% of residents speak other Indo-European language at home (72% very well, 21% well, 6% not well, 1% not at all).
2.2% of residents speak Asian or Pacific Island language at home (52% very well, 26% well, 14% not well, 8% not at all).
1.5% of residents speak other language at home (95% very well, 5% well).
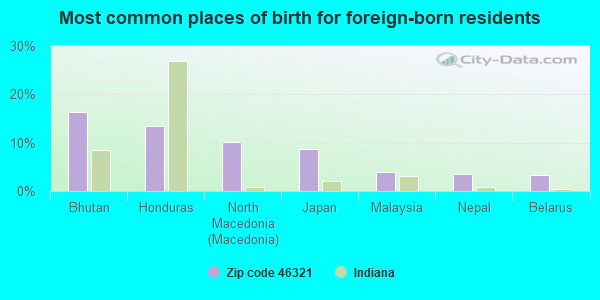
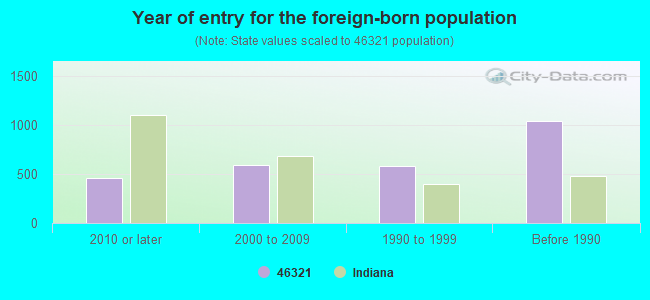
Foreign born population: 2,569 (10.8%) (73.7% of them are naturalized citizens)
Major facilities with environmental interests located in this zip code:
PEPSI COLA BOTTLING CO (9300 S CALUMET in MUNSTER, IN)
(Integrated Compliance Information System) - ICIS-05-1999-0418, FORMAL ENFORCEMENT ACTION STATE MASTER (Indiana facility tracking) - ACES-OP-08900436, AIR PROGRAM, CRTK-2060, EPCRA, LUST-199009522, LEAKING STORAGE TANK, SPILL-199009037, RELEASE ASSESSMENT, UST-7931, UNDERGROUND STORAGE TANK PROGRAM COMPLIANCE ACTIVITY (Tracking inspections of insecticide, fungicide, and rodenticide, and toxic substances) National Pollutant Discharge Elimination System NON-MAJOR (Tracking pollutant discharge elimination systems) - permit Conditionally Exempt Small Quantity Generators, less than 100 kg/month of hazardous waste (Resource Conservation and Recovery Act (tracking hazardous waste)) - notification TRI REPORTER (Tracking of toxic chemicals releasing facilities) Business SIC classification: BOTTLED AND CANNED SOFT DRINKS AND CARBONATED WATERS Organizations: PEPSI AMERICAS (CONTACT/OWNER)
Alternative names: PEPSI COLA GENERAL BOTTLERS, PEPSI-COLA GENERAL BOTTLERS OF MUNSTER, PEPSI (HAMMOND)
MUNSTER HIGH SCHOOL (8808 COLUMBIA AVE in MUNSTER, IN)
(Geographic Names Information System) STATE MASTER (Indiana facility tracking) - LUST-198708104, LEAKING STORAGE TANK, UST-20056, UNDERGROUND STORAGE TANK PROGRAM (National Center for Education Statistics) - STATE ID-4332 Conditionally Exempt Small Quantity Generators, less than 100 kg/month of hazardous waste (Resource Conservation and Recovery Act (tracking hazardous waste)) - notification Organizations: SCHOOL TOWN OF MUNSTER (CONTACT/OWNER)
Alternative names: SCHOOL TOWN OF MUNSTER
MUNSTER STEEL COMPANY INCORPORATED (9505 CALUMET AVENUE in MUNSTER, IN)
AIR MAJOR (AIRS/AFS) STATE MASTER (Indiana facility tracking) - ACES-OP-08900090, AIR PROGRAM, CRTK-9723, EPCRA COMPLIANCE ACTIVITY (Tracking inspections of insecticide, fungicide, and rodenticide, and toxic substances) CRITERIA AND HAZARDOUS AIR POLLUTANT INVENTORY (Inventory of air pollution sources) Small Quantity Generators, between 100 kg and 1000 kg of hazardous waste/month (Resource Conservation and Recovery Act (tracking hazardous waste)) - notification TRI REPORTER (Tracking of toxic chemicals releasing facilities) Business SIC classification: COLD-ROLLED STEEL SHEET, STRIP, AND BARS; FABRICATED STRUCTURAL METAL Business NAICS classification: FABRICATED STRUCTURAL METAL MANUFACTURING.; FABRICATED STRUCTURAL METAL MANUFACTURING. Organizations: MUNSTER STEEL CO INC (CONTACT/OPERATOR)
AMOCO NO 6258 (747 RIDGE RD in MUNSTER, IN)
STATE MASTER (Indiana facility tracking) - CRTK-7342, EPCRA, LUST-199407121, LEAKING STORAGE TANK, UST-11492, UNDERGROUND STORAGE TANK PROGRAM (Resource Conservation and Recovery Act (tracking hazardous waste)) Organizations: AMOCO OIL CO (CONTACT/OWNER)
Alternative names: AMOCO 6258
CHEMLAWN CORP (519 45TH ST in MUNSTER, IN)
STATE MASTER (Indiana facility tracking) - UST-3539, UNDERGROUND STORAGE TANK PROGRAM (Resource Conservation and Recovery Act (tracking hazardous waste))
CONRAIL ENV DEPT MUNSTER INDIANA (CALUMET AND 45TH AVE in MUNSTER, IN)
(Integrated Compliance Information System) - ICIS-05-1978-0029, FORMAL ENFORCEMENT ACTION STATE MASTER (Indiana facility tracking) (Resource Conservation and Recovery Act (tracking hazardous waste)) Organizations: CONSOLIDATED RAIL CORPORATION (CONTACT/OWNER)
AMOCO SVC STA 3804 (10444 CALUMET AVE in MUNSTER, IN)
STATE MASTER (Indiana facility tracking) - CRTK-19841, EPCRA, LUST-199409503, LEAKING STORAGE TANK, UST-19221, UNDERGROUND STORAGE TANK PROGRAM Conditionally Exempt Small Quantity Generators, less than 100 kg/month of hazardous waste (Resource Conservation and Recovery Act (tracking hazardous waste)) - notification Conditionally Exempt Small Quantity Generators, less than 100 kg/month of hazardous waste (Resource Conservation and Recovery Act (tracking hazardous waste)) - notification Organizations: AMOCO DIRECT RETAIL OPERATIONS (CONTACT/OWNER)
, BP PRODUCTS NORTH AMERICA INC (CONTACT/OWNER)
Alternative names: AMOCO 3804, AMOCO ACA MGMT SVCS
CHECKER 7680 (444 RIDGE RD in MUNSTER, IN)
STATE MASTER (Indiana facility tracking) - CRTK-5567, EPCRA, LUST-199408513, LEAKING STORAGE TANK, UST-3528, UNDERGROUND STORAGE TANK PROGRAM (Resource Conservation and Recovery Act (tracking hazardous waste)) Organizations: EMRO MARKETING (CONTACT/OWNER)
Alternative names: EMRO MARKETING CHEKER 7680
RILEYS NORTHSIDE MARATHON #2354 (7890 CALUMET AVE in MUNSTER, IN)
STATE MASTER (Indiana facility tracking) - CRTK-10509, EPCRA, LUST-199003563, LEAKING STORAGE TANK, LUST-199108533, UST-5448, UNDERGROUND STORAGE TANK PROGRAM (Resource Conservation and Recovery Act (tracking hazardous waste)) Organizations: MARATHON OIL CO (CONTACT/OWNER)
MONTGOMERY WARD AUTO EXPRESS (8005 CALUMET AVE in MUNSTER, IN)
STATE MASTER (Indiana facility tracking) - LUST-199407520, LEAKING STORAGE TANK, UST-5906, UNDERGROUND STORAGE TANK PROGRAM (Resource Conservation and Recovery Act (tracking hazardous waste)) Organizations: ST ANDREWS PROPERTIES (CONTACT/OWNER)
COMMUNITY HOSPITAL (901 MACARTHUR BLVD in MUNSTER, IN)
STATE MASTER (Indiana facility tracking) - ACES-OP-08900426, AIR PROGRAM, UST-18083, UNDERGROUND STORAGE TANK PROGRAM Conditionally Exempt Small Quantity Generators, less than 100 kg/month of hazardous waste (Resource Conservation and Recovery Act (tracking hazardous waste)) - notification
PHILLIPS 66 SERVICE STATION (323 RIDGE RD in MUNSTER, IN)
STATE MASTER (Indiana facility tracking) - CRTK-1976, EPCRA, UST-7559, UNDERGROUND STORAGE TANK PROGRAM Conditionally Exempt Small Quantity Generators, less than 100 kg/month of hazardous waste (Resource Conservation and Recovery Act (tracking hazardous waste)) - notification Organizations: PHILLIPS PETROLEUM CO (CONTACT/OWNER)
Alternative names: PHILLIPS PETROLEUM CO SS14432
MUNSTER SHELL INC (750 BROADMOOR AVE in MUNSTER, IN)
STATE MASTER (Indiana facility tracking) - CRTK-8848, EPCRA, LUST-199508522, LEAKING STORAGE TANK, LUST-199903558, UST-603, UNDERGROUND STORAGE TANK PROGRAM Conditionally Exempt Small Quantity Generators, less than 100 kg/month of hazardous waste (Resource Conservation and Recovery Act (tracking hazardous waste)) - notification Organizations: SHELL OIL CO (CONTACT/OWNER)
Alternative names: SHELL OIL CO
Housing units lacking complete plumbing facilities: 0.4% Housing units lacking complete kitchen facilities: 1.7%
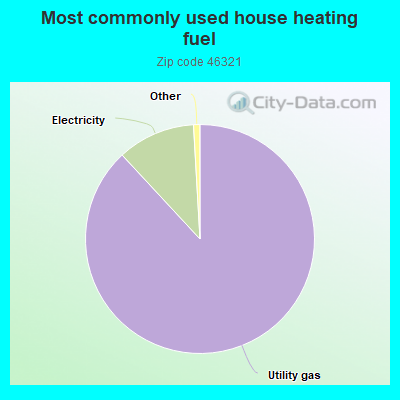
88.1%Utility gas
11.0%Electricity
Population in 1990: 19,906. Population change in the 1990s: +1,605 (+8.1%).
Place of birth for U.S.-born residents:
This state: 11,869
Northeast: 526
Midwest: 7,914
South: 629
West: 328
70% of the 46321 zip code residents lived in the same house 5 years ago. Out of people who lived in different houses, 59% lived in this county. Out of people who lived in different counties, 50% lived in Indiana.
94% of the 46321 zip code residents lived in the same house 1 year ago. Out of people who lived in different houses, 45% moved from this county. Out of people who lived in different houses, 23% moved from different county within same state. Out of people who lived in different houses, 35% moved from different state. Out of people who lived in different houses, 3% moved from abroad.
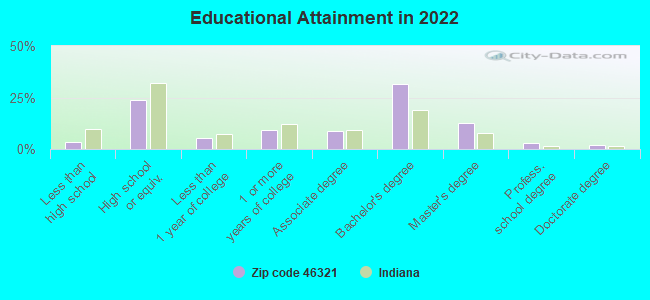
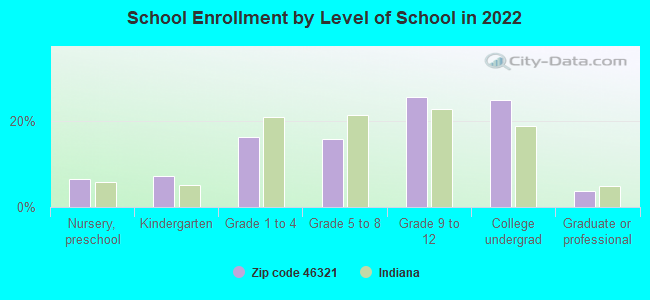
Private vs. public school enrollment:
Students in private schools in grades 1 to 8 (elementary and middle school): 308
Here:
17.6%
Indiana:
14.9%
Students in private schools in grades 9 to 12 (high school): 70
Here:
5.1%
Indiana:
11.4%
Students in private undergraduate colleges: 142
Here:
10.5%
Indiana:
22.3%
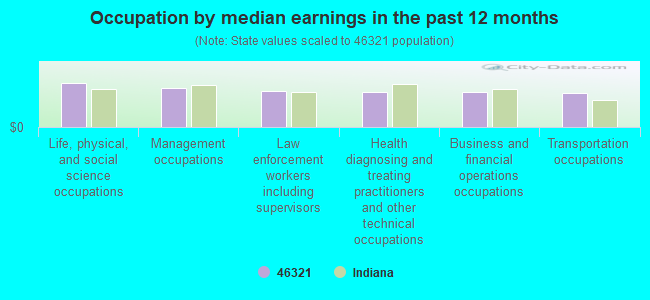
Occupation by median earnings in the past 12 months ($)
116,549Life, physical, and social science occupations
102,299Management occupations
96,472Law enforcement workers including supervisors
93,031Health diagnosing and treating practitioners and other technical occupations
93,006Business and financial operations occupations
89,775Transportation occupations
Companies with federal contracts located in this zip code (MUNSTER, IN):
TRI-STATE HOSE & FITTING INC (616 PROGRESS AVE; small business) : $384,775 in 40 contractsfrom 2000 to 2006
Contracts for Hose and Flexible Tubing, Hose, Pipe, Tube, Lubrication, and Railing Fittings, Centrifugals, Separators, and Pressure and Vacuum Filters, Bending and Forming Machines, and moreby Defense Logistics Agency Signed by year:2000: $26,967; 2001: $37,814; 2002: $32,800; 2003: $26,087; 2004: $73,687; 2005: $119,232; 2006: $68,188.
Biggest contracts:
$37,814 with Defense Logistics Agency for Hose and Flexible Tubing. Signed on 2001-04-30. Completion date: 2001-10-21.
$37,556 with Defense Logistics Agency for Hose, Pipe, Tube, Lubrication, and Railing Fittings. Signed on 2006-01-26. Completion date: 2006-05-11.
$32,800 with Defense Logistics Agency for Hose and Flexible Tubing. Signed on 2002-01-29. Completion date: 2002-01-31.
$26,967 with Defense Logistics Agency for Centrifugals, Separators, and Pressure and Vacuum Filters. Signed on 2000-04-21. Completion date: 2000-08-14.
HEHN & ASSOCIATES (1127 WESTMINSTER LANE; small business) : $60,959 in 3 contractsfrom 2003 to 2004
$23,303 with U.S. Army Corps of Engineers - civil program financing only for Other Professional Services. Signed on 2003-05-06. Completion date: 2003-06-30.
$18,828 with Army for Other Professional Services. Taking place in MI. Signed on 2004-07-30. Completion date: 2005-01-26.
$18,828 with U.S. Army Corps of Engineers - civil program financing only for Other Professional Services. Taking place in MI. Signed on 2004-07-30. Completion date: 2005-01-26.
STAR CASE MANUFACTURING COMPAN (648 SUPERIOR AVE; small business) : $48,369 in 12 contractsfrom 2002 to 2006
Contracts for Phonographs, Radio and Television Sets: Home Type, Other Professional Services, Miscellaneous Communication Equipment, Specialized Shipping and Storage Containers, and moreby Army, Defense Logistics Agency, Navy, U.S. Coast Guard, and others Signed by year:2000: $0; 2001: $0; 2002: $2,771; 2003: $3,390; 2004: $15,495; 2005: $24,800; 2006: $1,913.
Biggest contracts:
$13,290 with Army for Phonographs, Radio and Television Sets: Home Type. Signed on 2005-08-03. Completion date: 2005-08-12.
$6,895 with Defense Logistics Agency for Other Professional Services. Signed on 2004-10-01. Completion date: 2005-09-30.
$5,152, same as above.Signed on 2004-10-01. Completion date: 2005-09-30.
$3,848 with Navy for Miscellaneous Communication Equipment. Signed on 2005-09-22. Completion date: 2005-09-30.
KALIAPPAN GOPALAN (1329 FITZGERALD DRIVE; small business)
$25,520 with Air Force for Other Professional Services. Taking place in NY. Signed on 2002-05-02. Completion date: 2002-09-30.
PURFYBR INC (9384 CALUMET AVE; small business)
$25,490 with Defense Logistics Agency for Memorials: Cemeterial and Mortuary Equipment and Supplies. Signed on 2004-11-16. Completion date: 2005-01-14.
Top industries in this zip code by the number of employees in 2005:
Health Care and Social Assistance: General Medical and Surgical Hospitals (over 1000 employees: 1 establishment, 250-499 employees: 1 establishment)
Health Care and Social Assistance: Offices of Physicians (except Mental Health Specialists) (250-499: 2, 50-99: 1, 20-49: 13, 10-19: 17, 5-9: 26, 1-4: 53)
Health Care and Social Assistance: Continuing Care Retirement Communities (250-499: 1)
Health Care and Social Assistance: Nursing Care Facilities (250-499: 1)
Other Services (except Public Administration): Commercial and Industrial Machinery and Equipment (except Automotive and Electronic) Repair and Maintenance (250-499: 1)
Information: Newspaper Publishers (250-499: 1)
Health Care and Social Assistance: Offices of Dentists (50-99: 1, 10-19: 5, 5-9: 18, 1-4: 14)
People in group quarters in 2010:
275 people in nursing facilities/skilled-nursing facilities
15 people in other noninstitutional facilities
6 people in in-patient hospice facilities
People in group quarters in 2000:
305 people in nursing homes
12 people in homes for the mentally ill
12 people in other nonhousehold living situations
6 people in hospitals/wards and hospices for chronically ill
6 people in hospices or homes for chronically ill
Fatal accident statistics in 2014:
Fatal accident count: 2
Vehicles involved in fatal accidents: 4
Fatal accidents caused by drunken drivers: 0
Fatalities: 2
Persons involved in fatal accidents: 4
Pedestrians involved in fatal accidents: 0
Fatal accident statistics in 2012:
Fatal accident count: 1
Vehicles involved in fatal accidents: 1
Fatal accidents caused by drunken drivers: 1
Fatalities: 1
Persons involved in fatal accidents: 2
Pedestrians involved in fatal accidents: 0
Home Mortgage Disclosure Act Aggregated Statistics For Year 2009 (Based on 7 full and 2 partial tracts)
A) FHA, FSA/RHS & VA Home Purchase Loans
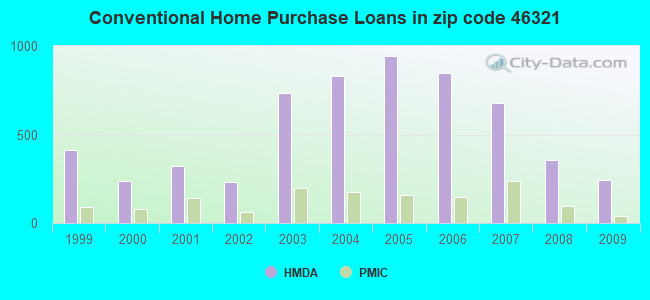
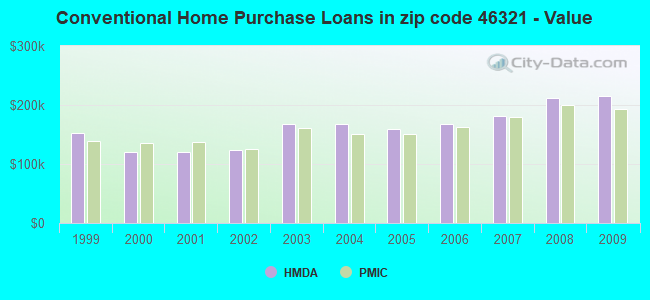
B) Conventional Home Purchase Loans
C) Refinancings
D) Home Improvement Loans
F) Non-occupant Loans on < 5 Family Dwellings (A B C & D)
Number
Average Value
Number
Average Value
Number
Average Value
Number
Average Value
Number
Average Value
LOANS ORIGINATED
168
$184,391
243
$214,600
1,367
$197,267
41
$65,456
46
$145,958
APPLICATIONS APPROVED, NOT ACCEPTED
5
$157,682
15
$157,325
118
$206,847
9
$46,686
6
$120,883
APPLICATIONS DENIED
39
$158,254
49
$186,311
355
$209,474
20
$25,744
15
$135,243
APPLICATIONS WITHDRAWN
6
$131,900
21
$179,113
222
$204,055
2
$21,085
6
$134,615
FILES CLOSED FOR INCOMPLETENESS
4
$149,510
4
$183,345
77
$239,132
4
$23,915
0
$0
Aggregated Statistics For Year 2008 (Based on 7 full and 2 partial tracts)
A) FHA, FSA/RHS & VA Home Purchase Loans
B) Conventional Home Purchase Loans
C) Refinancings
D) Home Improvement Loans
E) Loans on Dwellings For 5+ Families
F) Non-occupant Loans on < 5 Family Dwellings (A B C & D)
G) Loans On Manufactured Home Dwelling (A B C & D)
Number
Average Value
Number
Average Value
Number
Average Value
Number
Average Value
Number
Average Value
Number
Average Value
Number
Average Value
LOANS ORIGINATED
80
$173,607
357
$212,010
610
$185,447
89
$54,994
1
$1,131,000
54
$119,168
1
$38,000
APPLICATIONS APPROVED, NOT ACCEPTED
4
$173,102
34
$214,220
89
$192,109
22
$99,329
0
$0
4
$35,305
0
$0
APPLICATIONS DENIED
20
$176,874
46
$198,865
269
$203,496
46
$80,600
0
$0
10
$113,117
0
$0
APPLICATIONS WITHDRAWN
5
$264,632
20
$214,814
119
$206,858
16
$127,572
0
$0
10
$133,534
0
$0
FILES CLOSED FOR INCOMPLETENESS
1
$282,640
1
$531,000
38
$211,050
4
$203,760
0
$0
0
$0
0
$0
Aggregated Statistics For Year 2007 (Based on 7 full and 2 partial tracts)
A) FHA, FSA/RHS & VA Home Purchase Loans
B) Conventional Home Purchase Loans
C) Refinancings
D) Home Improvement Loans
F) Non-occupant Loans on < 5 Family Dwellings (A B C & D)
G) Loans On Manufactured Home Dwelling (A B C & D)
Number
Average Value
Number
Average Value
Number
Average Value
Number
Average Value
Number
Average Value
Number
Average Value
LOANS ORIGINATED
33
$163,984
676
$182,021
607
$174,254
97
$63,947
68
$128,086
0
$0
APPLICATIONS APPROVED, NOT ACCEPTED
0
$0
58
$223,754
108
$194,094
35
$55,415
10
$156,451
0
$0
APPLICATIONS DENIED
4
$193,408
84
$176,675
275
$184,126
73
$68,624
24
$157,427
1
$44,020
APPLICATIONS WITHDRAWN
8
$165,678
47
$144,044
111
$172,634
13
$73,245
12
$105,929
0
$0
FILES CLOSED FOR INCOMPLETENESS
0
$0
12
$231,652
44
$229,380
5
$50,452
6
$162,063
0
$0
Aggregated Statistics For Year 2006 (Based on 7 full and 2 partial tracts)
A) FHA, FSA/RHS & VA Home Purchase Loans
B) Conventional Home Purchase Loans
C) Refinancings
D) Home Improvement Loans
F) Non-occupant Loans on < 5 Family Dwellings (A B C & D)
G) Loans On Manufactured Home Dwelling (A B C & D)
Number
Average Value
Number
Average Value
Number
Average Value
Number
Average Value
Number
Average Value
Number
Average Value
LOANS ORIGINATED
42
$173,384
850
$168,376
676
$164,449
90
$49,800
97
$128,536
0
$0
APPLICATIONS APPROVED, NOT ACCEPTED
2
$223,820
89
$204,584
134
$186,741
24
$83,868
11
$127,014
0
$0
APPLICATIONS DENIED
5
$112,284
139
$140,531
349
$172,918
62
$36,520
17
$109,114
2
$27,280
APPLICATIONS WITHDRAWN
3
$121,270
85
$138,319
228
$192,912
12
$102,210
12
$115,890
0
$0
FILES CLOSED FOR INCOMPLETENESS
0
$0
12
$166,958
80
$228,679
0
$0
2
$91,230
0
$0
Aggregated Statistics For Year 2005 (Based on 7 full and 2 partial tracts)
A) FHA, FSA/RHS & VA Home Purchase Loans
B) Conventional Home Purchase Loans
C) Refinancings
D) Home Improvement Loans
E) Loans on Dwellings For 5+ Families
F) Non-occupant Loans on < 5 Family Dwellings (A B C & D)
G) Loans On Manufactured Home Dwelling (A B C & D)
Number
Average Value
Number
Average Value
Number
Average Value
Number
Average Value
Number
Average Value
Number
Average Value
Number
Average Value
LOANS ORIGINATED
39
$166,652
945
$159,709
800
$171,355
89
$60,744
1
$90,000
104
$123,868
0
$0
APPLICATIONS APPROVED, NOT ACCEPTED
1
$160,300
78
$157,804
130
$161,488
18
$63,646
0
$0
18
$149,907
0
$0
APPLICATIONS DENIED
7
$140,323
158
$154,345
376
$168,865
54
$55,848
0
$0
22
$124,104
2
$189,375
APPLICATIONS WITHDRAWN
1
$138,000
101
$129,620
287
$177,254
27
$226,280
0
$0
33
$122,769
0
$0
FILES CLOSED FOR INCOMPLETENESS
2
$203,125
18
$225,812
96
$182,577
6
$35,210
0
$0
0
$0
0
$0
Aggregated Statistics For Year 2004 (Based on 7 full and 2 partial tracts)
A) FHA, FSA/RHS & VA Home Purchase Loans
B) Conventional Home Purchase Loans
C) Refinancings
D) Home Improvement Loans
F) Non-occupant Loans on < 5 Family Dwellings (A B C & D)
Number
Average Value
Number
Average Value
Number
Average Value
Number
Average Value
Number
Average Value
LOANS ORIGINATED
24
$134,962
830
$167,243
836
$160,423
95
$46,471
85
$128,417
APPLICATIONS APPROVED, NOT ACCEPTED
2
$156,665
51
$175,680
132
$175,632
19
$54,953
9
$64,966
APPLICATIONS DENIED
2
$146,055
65
$165,449
245
$173,936
48
$63,194
27
$128,361
APPLICATIONS WITHDRAWN
5
$136,640
50
$153,117
253
$152,171
19
$155,252
9
$102,521
FILES CLOSED FOR INCOMPLETENESS
2
$189,295
21
$160,009
88
$164,629
3
$29,900
6
$100,997
Aggregated Statistics For Year 2003 (Based on 7 full and 2 partial tracts)
A) FHA, FSA/RHS & VA Home Purchase Loans
B) Conventional Home Purchase Loans
C) Refinancings
D) Home Improvement Loans
F) Non-occupant Loans on < 5 Family Dwellings (A B C & D)
Number
Average Value
Number
Average Value
Number
Average Value
Number
Average Value
Number
Average Value
LOANS ORIGINATED
49
$118,331
735
$168,451
2,324
$154,260
101
$37,607
83
$100,457
APPLICATIONS APPROVED, NOT ACCEPTED
1
$115,970
53
$187,641
195
$165,911
10
$24,125
13
$81,902
APPLICATIONS DENIED
5
$128,180
49
$111,310
369
$143,143
44
$41,282
9
$64,069
APPLICATIONS WITHDRAWN
0
$0
66
$159,992
274
$155,594
15
$25,965
17
$78,249
FILES CLOSED FOR INCOMPLETENESS
0
$0
17
$163,472
87
$171,512
2
$89,665
4
$79,230
Aggregated Statistics For Year 2002 (Based on 2 full and 2 partial tracts)
A) FHA, FSA/RHS & VA Home Purchase Loans
B) Conventional Home Purchase Loans
C) Refinancings
D) Home Improvement Loans
F) Non-occupant Loans on < 5 Family Dwellings (A B C & D)
Number
Average Value
Number
Average Value
Number
Average Value
Number
Average Value
Number
Average Value
LOANS ORIGINATED
17
$106,439
231
$123,758
542
$115,928
40
$31,464
37
$76,695
APPLICATIONS APPROVED, NOT ACCEPTED
0
$0
16
$161,033
58
$122,857
4
$30,492
2
$146,155
APPLICATIONS DENIED
2
$127,580
20
$157,868
94
$114,513
17
$13,120
1
$30,940
APPLICATIONS WITHDRAWN
2
$182,355
2
$127,990
56
$123,508
2
$11,925
4
$89,702
FILES CLOSED FOR INCOMPLETENESS
0
$0
6
$208,658
19
$139,101
0
$0
0
$0
Aggregated Statistics For Year 2001 (Based on 2 full and 2 partial tracts)
A) FHA, FSA/RHS & VA Home Purchase Loans
B) Conventional Home Purchase Loans
C) Refinancings
D) Home Improvement Loans
F) Non-occupant Loans on < 5 Family Dwellings (A B C & D)
Number
Average Value
Number
Average Value
Number
Average Value
Number
Average Value
Number
Average Value
LOANS ORIGINATED
35
$114,440
321
$120,826
388
$109,990
36
$34,953
38
$75,654
APPLICATIONS APPROVED, NOT ACCEPTED
0
$0
14
$151,931
69
$99,301
23
$32,590
3
$56,860
APPLICATIONS DENIED
4
$110,632
8
$96,860
83
$98,254
13
$26,336
4
$87,710
APPLICATIONS WITHDRAWN
6
$110,705
25
$156,625
101
$109,073
6
$22,147
6
$74,045
FILES CLOSED FOR INCOMPLETENESS
2
$129,570
4
$86,215
24
$160,502
6
$61,463
0
$0
Aggregated Statistics For Year 2000 (Based on 2 full and 2 partial tracts)
A) FHA, FSA/RHS & VA Home Purchase Loans
B) Conventional Home Purchase Loans
C) Refinancings
D) Home Improvement Loans
F) Non-occupant Loans on < 5 Family Dwellings (A B C & D)
Number
Average Value
Number
Average Value
Number
Average Value
Number
Average Value
Number
Average Value
LOANS ORIGINATED
21
$106,042
236
$119,857
80
$80,142
64
$23,113
21
$72,913
APPLICATIONS APPROVED, NOT ACCEPTED
2
$127,580
20
$120,485
29
$83,648
16
$24,422
2
$115,605
APPLICATIONS DENIED
0
$0
12
$111,918
53
$64,966
13
$14,288
4
$92,195
APPLICATIONS WITHDRAWN
6
$108,640
14
$83,320
22
$72,520
0
$0
2
$57,695
FILES CLOSED FOR INCOMPLETENESS
0
$0
1
$64,250
2
$181,080
0
$0
0
$0
Aggregated Statistics For Year 1999 (Based on 2 full tracts)
A) FHA, FSA/RHS & VA Home Purchase Loans
B) Conventional Home Purchase Loans
C) Refinancings
D) Home Improvement Loans
E) Loans on Dwellings For 5+ Families
F) Non-occupant Loans on < 5 Family Dwellings (A B C & D)
2003 - 2018 National Fire Incident Reporting System (NFIRS) incidents
According to the data from the years 2003 - 2018 the average number of fire incidents per year is 38. The highest number of fire incidents - 57 took place in 2008, and the least - 14 in 2014. The data has an increasing trend.
When looking into fire subcategories, the most reports belonged to: Outside Fires (43.7%), and Structure Fires (34.7%).
Fire incident types reported to NFIRS in Zip Code 46321


 Nearest zip codes: 46324, 46322, 60438, 46323, 46375, 46327.


 According to the data from the years 2003 - 2018 the average number of fire incidents per year is 38. The highest number of fire incidents - 57 took place in 2008, and the least - 14 in 2014. The data has an increasing trend.
 When looking into fire subcategories, the most reports belonged to: Outside Fires (43.7%), and Structure Fires (34.7%).