Estimated zip code population in 2022: 21,858 Zip code population in 2010: 23,165 Zip code population in 2000: 23,248
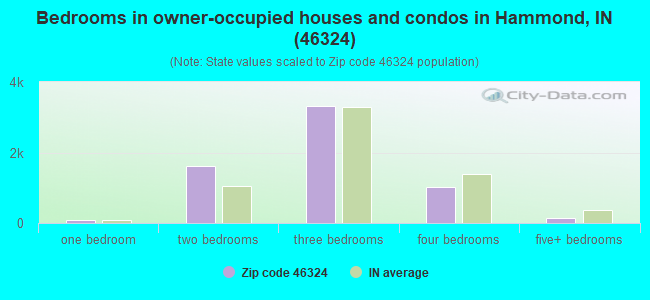
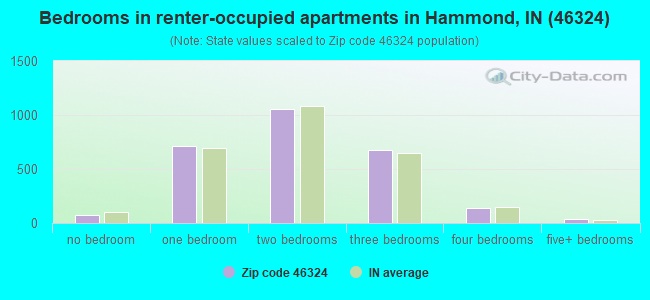
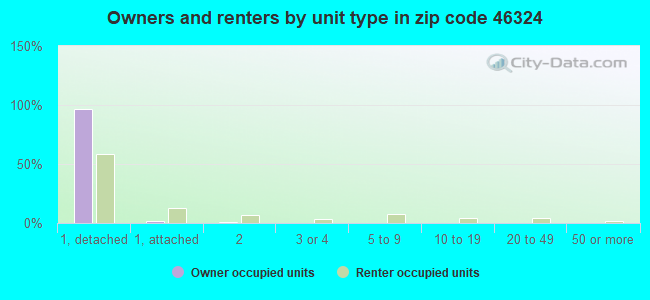
Houses and condos: 9,517 Renter-occupied apartments: 2,707
% of renters here:
30%
State:
29%
March 2022 cost of living index in zip code 46324: 94.2 (less than average, U.S. average is 100)
Land area: 4.4 sq. mi. Water area: 0.0 sq. mi.
Population density: 4,955 people per square mile
(average).
OSM Map
General Map
Google Map
MSN Map
OSM Map
General Map
Google Map
MSN Map
OSM Map
General Map
Google Map
MSN Map
OSM Map
General Map
Google Map
MSN Map
Please wait while loading the map...
Real estate property taxes paid for housing units in 2022:
This zip code:
1.0% ($1,545)
Indiana:
0.7% ($1,467)
Median real estate property taxes paid for housing units with mortgages in 2022: $1,560 (1.0%) Median real estate property taxes paid for housing units with no mortgage in 2022: $1,556 (1.2%)
Business Search- 14 Million verified businesses
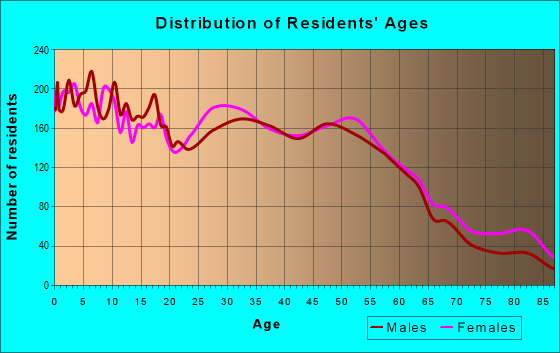
Males: 10,693
(48.9%)
Females: 11,164
(51.1%)
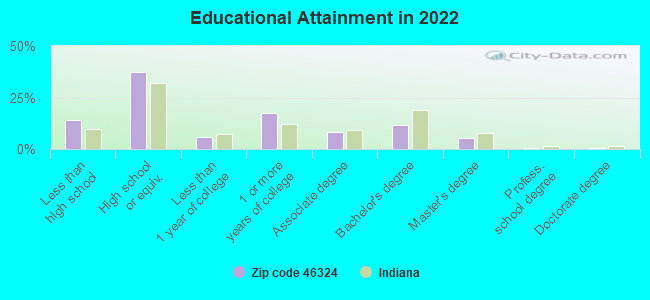
For population 25 years and over in 46324:
High school or higher: 84.9%
Bachelor's degree or higher: 17.2%
Graduate or professional degree: 5.9%
Unemployed: 4.5%
Mean travel time to work (commute): 24.5 minutes
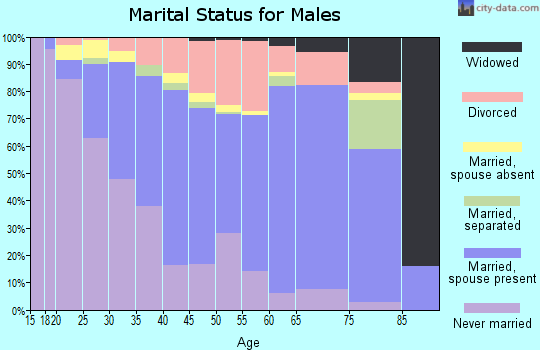
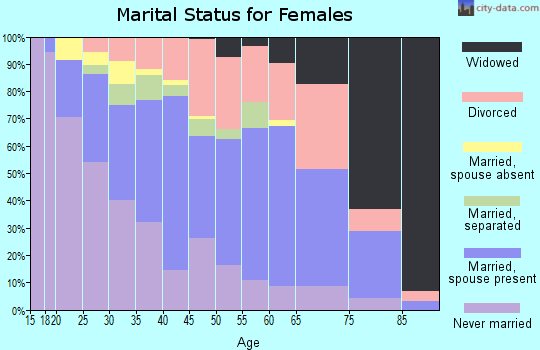
For population 15 years and over in 46324:
Never married: 40.1%
Now married: 42.1%
Separated: 2.1%
Widowed: 6.3%
Divorced: 9.3%
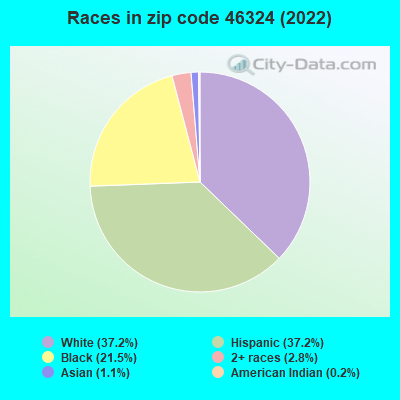
Zip code 46324 compared to state average:
Black race population percentage above state average.
Hispanic race population percentage significantly above state average.
Foreign-born population percentage above state average.
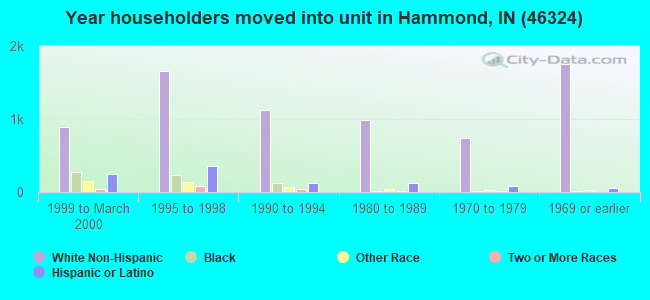
Length of stay since moving in significantly above state average.
House age above state average.
Percentage of population with a bachelor's degree or higher below state average.
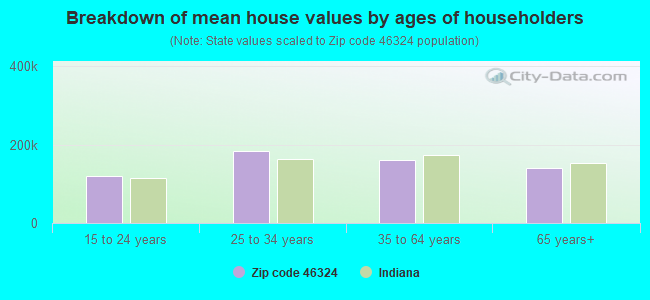
Estimated median house/condo value in 2022: $150,955
46324:
$150,955
Indiana:
$208,700
According to our research of Indiana and other state lists, there was 1 registered sex offender living in 46324 zip code as of April 27, 2024. The ratio of all residents to sex offenders in zip code 46324 is 22,626 to 1. The ratio of registered sex offenders to all residents in this zip code is much lower than the state average.
Median resident age:
This zip code:
38.0 years
Indiana median age:
38.2 years
Average household size:
This zip code:
2.4 people
Indiana:
2.4 people
Averages for the 2020 tax year for zip code 46324, filed in 2021:
Average Adjusted Gross Income (AGI) in 2020: $42,190 (Individual Income Tax Returns)
Here:
$42,190
State:
$64,978
Salary/wage: $39,409 (reported on 84.3% of returns)
Here:
$39,409
State:
$55,245
(% of AGI for various income ranges: 1110.6% for AGIs below $25k, 3486.4% for AGIs $25k-50k, 6349.6% for AGIs $50k-75k, 9588.4% for AGIs $75k-100k, 15793.1% for AGIs $100k-200k, 52050.0% for AGIs over 200k)
Taxable interest for individuals: $757 (reported on 14.8% of returns)
This zip code:
$757
Indiana:
$1,351
(% of AGI for various income ranges: 6.2% for AGIs below $25k, 9.5% for AGIs $25k-50k, 14.2% for AGIs $50k-75k, 32.6% for AGIs $75k-100k, 50.8% for AGIs $100k-200k, 595.0% for AGIs over 200k)
Ordinary dividends: $3,097 (reported on 7.5% of returns)
Here:
$3,097
State:
$5,827
(% of AGI for various income ranges: 8.9% for AGIs below $25k, 14.3% for AGIs $25k-50k, 28.5% for AGIs $50k-75k, 48.1% for AGIs $75k-100k, 144.4% for AGIs $100k-200k, 2460.0% for AGIs over 200k)
Net capital gain/loss in AGI: +$3,762 (reported on 6.3% of returns)
Here:
+$3,762
State:
+$17,730
(% of AGI for various income ranges: 1.0% for AGIs below $25k, 5.2% for AGIs $25k-50k, 16.4% for AGIs $50k-75k, 44.2% for AGIs $75k-100k, 305.4% for AGIs $100k-200k, 2985.0% for AGIs over 200k)
Profit/loss from business: +$6,200 (reported on 13.0% of returns)
Here:
+$6,200
State:
+$12,144
(% of AGI for various income ranges: 101.5% for AGIs below $25k, 71.6% for AGIs $25k-50k, 87.9% for AGIs $50k-75k, 106.0% for AGIs $75k-100k, 335.6% for AGIs $100k-200k)
Taxable individual retirement arrangement distribution: $14,148 (reported on 5.1% of returns)
46324:
$14,148
Indiana:
$18,302
(% of AGI for various income ranges: 26.7% for AGIs below $25k, 44.8% for AGIs $25k-50k, 83.2% for AGIs $50k-75k, 139.2% for AGIs $75k-100k, 866.7% for AGIs $100k-200k)
Total itemized deductions: $26,143 (reported on 3.4% of returns)
Here:
$26,143
State:
$35,601
(% of AGI for various income ranges: 16.6% for AGIs below $25k, 58.4% for AGIs $25k-50k, 161.4% for AGIs $50k-75k, 279.7% for AGIs $75k-100k, 832.1% for AGIs $100k-200k)
Charity contributions: $8,189 (reported on 2.7% of returns)
Here:
$8,189
State:
$15,596
(% of AGI for various income ranges: 12.7% for AGIs $25k-50k, 39.6% for AGIs $50k-75k, 104.8% for AGIs $75k-100k, 203.3% for AGIs $100k-200k)
Taxes paid: $5,803 (reported on 3.4% of returns)
46324:
$5,803
State:
$7,542
(% of AGI for various income ranges: 3.0% for AGIs below $25k, 10.3% for AGIs $25k-50k, 35.3% for AGIs $50k-75k, 76.3% for AGIs $75k-100k, 187.4% for AGIs $100k-200k)
Earned income credit: $2,540 (reported on 24.2% of returns)
Here:
$2,540
State:
$2,298
(% of AGI for various income ranges: 129.5% for AGIs below $25k, 82.5% for AGIs $25k-50k, 1.1% for AGIs $50k-75k)
Percentage of individuals using paid preparers for their 2020 taxes: 92.9%
Here:
93%
State:
94%
(% for various income ranges: 92.3% for AGIs below $25k, 93.9% for AGIs $25k-50k, 93.3% for AGIs $50k-75k, 92.8% for AGIs $75k-100k, 92.1% for AGIs $100k-200k, 83.3% for AGIs over 200k)
Averages for the 2012 tax year for zip code 46324, filed in 2013:
Average Adjusted Gross Income (AGI) in 2012: $38,241 (Individual Income Tax Returns)
Here:
$38,241
State:
$52,932
Salary/wage: $36,686 (reported on 84.5% of returns)
Here:
$36,686
State:
$45,173
(% of AGI for various income ranges: 73.1% for AGIs below $25k, 83.5% for AGIs $25k-50k, 86.1% for AGIs $50k-75k, 83.4% for AGIs $75k-100k, 83.9% for AGIs $100k-200k, 39.0% for AGIs over 200k)
Taxable interest for individuals: $760 (reported on 20.4% of returns)
This zip code:
$760
Indiana:
$1,311
(% of AGI for various income ranges: 0.5% for AGIs below $25k, 0.3% for AGIs $25k-50k, 0.3% for AGIs $50k-75k, 0.4% for AGIs $75k-100k, 0.5% for AGIs $100k-200k, 0.5% for AGIs over 200k)
Ordinary dividends: $2,831 (reported on 9.4% of returns)
Here:
$2,831
State:
$4,690
(% of AGI for various income ranges: 0.8% for AGIs below $25k, 0.4% for AGIs $25k-50k, 0.6% for AGIs $50k-75k, 0.9% for AGIs $75k-100k, 1.2% for AGIs $100k-200k)
Net capital gain/loss in AGI: +$1,700 (reported on 5.8% of returns)
Here:
+$1,700
State:
+$10,406
(% of AGI for various income ranges: 0.1% for AGIs $25k-50k, 0.1% for AGIs $50k-75k, 0.6% for AGIs $75k-100k, 0.6% for AGIs $100k-200k)
Profit/loss from business: +$8,505 (reported on 11.3% of returns)
Here:
+$8,505
State:
+$11,105
(% of AGI for various income ranges: 9.0% for AGIs below $25k, 2.0% for AGIs $25k-50k, 1.0% for AGIs $50k-75k, 0.3% for AGIs $75k-100k, 2.3% for AGIs $100k-200k)
Taxable individual retirement arrangement distribution: $11,351 (reported on 6.6% of returns)
46324:
$11,351
Indiana:
$13,841
(% of AGI for various income ranges: 2.1% for AGIs below $25k, 1.3% for AGIs $25k-50k, 1.2% for AGIs $50k-75k, 3.1% for AGIs $75k-100k, 3.0% for AGIs $100k-200k)
Total itemized deductions: $15,555 (22% of AGI, reported on 19.4% of returns)
Here:
$15,555
State:
$20,913
Here:
22.1% of AGI
State:
18.2% of AGI
(% of AGI for various income ranges: 4.4% for AGIs below $25k, 7.4% for AGIs $25k-50k, 8.7% for AGIs $50k-75k, 8.1% for AGIs $75k-100k, 10.4% for AGIs $100k-200k, 9.1% for AGIs over 200k)
Charity contributions: $3,030 (reported on 15.0% of returns)
Here:
$3,030
State:
$4,697
(% of AGI for various income ranges: 0.4% for AGIs below $25k, 0.9% for AGIs $25k-50k, 1.4% for AGIs $50k-75k, 1.4% for AGIs $75k-100k, 1.8% for AGIs $100k-200k, 1.1% for AGIs over 200k)
Taxes paid: $4,476 (reported on 19.4% of returns)
46324:
$4,476
State:
$7,456
(% of AGI for various income ranges: 0.7% for AGIs below $25k, 1.6% for AGIs $25k-50k, 2.5% for AGIs $50k-75k, 2.6% for AGIs $75k-100k, 3.6% for AGIs $100k-200k, 4.8% for AGIs over 200k)
Earned income credit: $2,588 (reported on 27.1% of returns)
Here:
$2,588
State:
$2,265
(% of AGI for various income ranges: 9.8% for AGIs below $25k, 1.4% for AGIs $25k-50k)
Percentage of individuals using paid preparers for their 2012 taxes: 55.5%
Here:
55%
State:
53%
(% for various income ranges: 50.9% for AGIs below $25k, 57.0% for AGIs $25k-50k, 58.7% for AGIs $50k-75k, 64.8% for AGIs $75k-100k, 65.4% for AGIs $100k-200k, 66.7% for AGIs over 200k)
Averages for the 2004 tax year for zip code 46324, filed in 2005:
Average Adjusted Gross Income (AGI) in 2004: $35,270 (Individual Income Tax Returns)
Here:
$35,270
State:
$44,790
Salary/wage: $33,660 (reported on 86.5% of returns)
Here:
$33,660
State:
$39,615
(% of AGI for various income ranges: 81.2% for AGIs below $10k, 76.6% for AGIs $10k-25k, 86.7% for AGIs $25k-50k, 87.9% for AGIs $50k-75k, 86.7% for AGIs $75k-100k, 65.7% for AGIs over 100k)
Taxable interest for individuals: $1,171 (reported on 36.0% of returns)
This zip code:
$1,171
Indiana:
$1,535
(% of AGI for various income ranges: 3.3% for AGIs below $10k, 2.1% for AGIs $10k-25k, 0.8% for AGIs $25k-50k, 0.6% for AGIs $50k-75k, 0.6% for AGIs $75k-100k, 2.4% for AGIs over 100k)
Taxable dividends: $1,947 (reported on 14.5% of returns)
Here:
$1,947
State:
$2,998
(% of AGI for various income ranges: 1.5% for AGIs below $10k, 1.2% for AGIs $10k-25k, 0.5% for AGIs $25k-50k, 0.5% for AGIs $50k-75k, 0.7% for AGIs $75k-100k, 1.5% for AGIs over 100k)
Net capital gain/loss: +$2,974 (reported on 9.1% of returns)
Here:
+$2,974
State:
+$8,619
(% of AGI for various income ranges: -0.5% for AGIs below $10k, 0.2% for AGIs $10k-25k, 0.2% for AGIs $25k-50k, 0.5% for AGIs $50k-75k, 0.7% for AGIs $75k-100k, 3.2% for AGIs over 100k)
Profit/loss from business: +$8,408 (reported on 8.9% of returns)
Here:
+$8,408
State:
+$10,071
(% of AGI for various income ranges: 5.6% for AGIs below $10k, 3.6% for AGIs $10k-25k, 1.5% for AGIs $25k-50k, 1.2% for AGIs $50k-75k, 1.1% for AGIs $75k-100k, 4.1% for AGIs over 100k)
IRA payment deduction: $2,219 (reported on 1.7% of returns)
46324:
$2,219
Indiana:
$2,840
(% of AGI for various income ranges: 0.2% for AGIs $10k-25k, 0.1% for AGIs $25k-50k, 0.1% for AGIs $50k-75k, 0.1% for AGIs $75k-100k, 0.1% for AGIs over 100k)
Self-employed pension: $16,778 (reported on 0.2% of returns)
Here:
$16,778
Indiana:
$15,305
Total itemized deductions: $13,403 (22% of AGI, reported on 25.7% of returns)
Here:
$13,403
State:
$17,065
Here:
22.3% of AGI
State:
19.5% of AGI
(% of AGI for various income ranges: 4.2% for AGIs below $10k, 6.4% for AGIs $10k-25k, 10.0% for AGIs $25k-50k, 10.3% for AGIs $50k-75k, 10.0% for AGIs $75k-100k, 12.2% for AGIs over 100k)
Charity contributions deductions: $2,310 (4% of AGI, reported on 21.9% of returns)
Here:
$2,310
State:
$3,550
Here:
3.7% of AGI
State:
3.8% of AGI
(% of AGI for various income ranges: 0.2% for AGIs below $10k, 0.9% for AGIs $10k-25k, 1.3% for AGIs $25k-50k, 1.6% for AGIs $50k-75k, 1.4% for AGIs $75k-100k, 2.2% for AGIs over 100k)
Total tax: $4,576 (reported on 69.7% of returns)
46324:
$4,576
State:
$6,914
(% of AGI for various income ranges: 1.7% for AGIs below $10k, 3.4% for AGIs $10k-25k, 6.7% for AGIs $25k-50k, 9.3% for AGIs $50k-75k, 11.4% for AGIs $75k-100k, 17.5% for AGIs over 100k)
Earned income credit: $1,847 (reported on 20.7% of returns)
Here:
$1,847
State:
$1,685
Percentage of individuals using paid preparers for their 2004 taxes: 61.0%
Here:
61%
State:
59%
(% for various income ranges: 54.4% for AGIs below $10k, 64.1% for AGIs $10k-25k, 62.6% for AGIs $25k-50k, 61.3% for AGIs $50k-75k, 57.7% for AGIs $75k-100k, 68.4% for AGIs over 100k)
Likely homosexual households (counted as self-reported same-sex unmarried-partner households)
Lesbian couples: 0.1% of all households
Gay men: 0.1% of all households
Household received Food Stamps/SNAP in the past 12 months: 1,099 Household did not receive Food Stamps/SNAP in the past 12 months: 7,823
Women who had a birth in the past 12 months: 257 (79 now married, 156 unmarried) Women who did not have a birth in the past 12 months: 5,373 (1,957 now married, 3,409 unmarried)
Housing units in zip code 46324 with a mortgage: 4,088 (241 second mortgage, 161 both second mortgage and home equity loan) Houses without a mortgage: 115
Median monthly owner costs for units with a mortgage: $1,127 Median monthly owner costs for units without a mortgage: $460
Residents with income below the poverty level in 2022:
This zip code:
13.8%
Whole state:
12.6%
Residents with income below 50% of the poverty level in 2022:
This zip code:
6.4%
Whole state:
6.3%
Median number of rooms in houses and condos:
Here:
6.0
State:
6.6
Median number of rooms in apartments:
Here:
4.5
State:
4.3
Notable locations in this zip code not listed on our city pages
Notable locations in zip code 46324: Woodmar Country Club (A), Sawyer Branch Hammond Public Library (B), Hammond Fire Department Station 7 (C), Hammond Fire Department Station 5 (D). Display/hide their locations on the map
Churches in zip code 46324 include: Trinity Evangelical Lutheran Church (A), Unity Church (B), Christ Lutheran Church (C), Church of God (D), Saint John Bosco Church (E), Woodmar Baptist Church (F), Woodmar United Methodist Church (G), Bethel Bible Church (H), Christian Fellowship Church (I). Display/hide their locations on the map
Cemeteries: Elmwood Cemetery (1), Saint Michaels Cemetery (2), Saint Johns Cemetery (3), Concordia Cemetery (4), Oak Hill Cemetery (5). Display/hide their locations on the map
In group quarters: 9 (-1 institutionalized population)
Size of family households: 2,648 2-persons, 1,034 3-persons, 861 4-persons, 581 5-persons, 246 6-persons, 133 7-or-more-persons
Size of nonfamily households: 2,815 1-person, 574 2-persons, 28 3-persons
2,627 married couples with children.
1,636 single-parent households (405 men, 1,231 women).
79.0% of residents of 46324 zip code speak English at home.
19.6% of residents speak Spanish at home (67% very well, 20% well, 9% not well, 4% not at all).
0.6% of residents speak other Indo-European language at home (78% very well, 17% well, 6% not well).
0.6% of residents speak Asian or Pacific Island language at home (96% very well, 4% well).
0.4% of residents speak other language at home (100% very well).
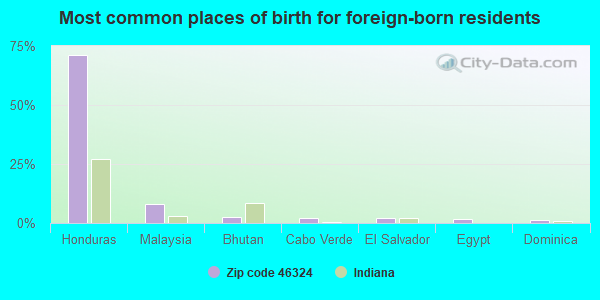
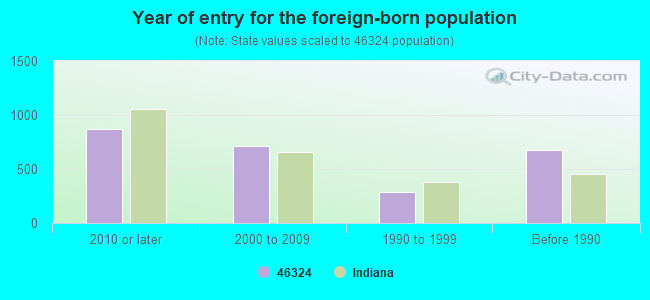
Foreign born population: 2,173 (9.9%) (52.2% of them are naturalized citizens)
This zip code:
9.9%
Whole state:
6.1%
71%Honduras
8%Malaysia
3%Bhutan
2%Cabo Verde
2%El Salvador
2%Egypt
1%Dominica
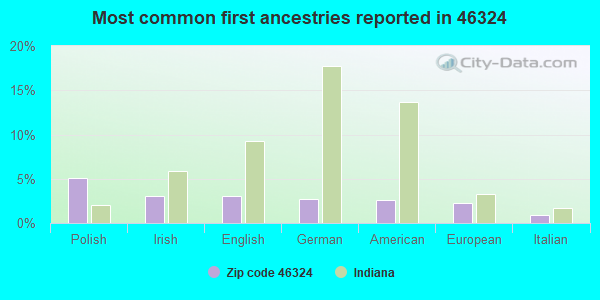
5%Polish
3%Irish
3%English
3%German
3%American
2%European
1%Italian
Year of entry for the foreign-born population
8692010 or later
7152000 to 2009
2901990 to 1999
680Before 1990
Major facilities with environmental interests located in this zip code:
AMOCO (7522-7530 CALUMET AVE in HAMMOND, IN)
STATE MASTER (Indiana facility tracking) - UST-16399, UNDERGROUND STORAGE TANK PROGRAM, CRTK-5168, EPCRA, LUST-199101547, LEAKING STORAGE TANK, LUST-199808506, UST-17736, UNDERGROUND STORAGE TANK PROGRAM (Resource Conservation and Recovery Act (tracking hazardous waste)) Organizations: SHELL OIL CO (CONTACT/OWNER)
Alternative names: AMOCO 14152, AMOCO OIL CO, SHELL OIL CO
AMOCO NO 6212 (6450 CALUMET AVE in HAMMOND, IN)
STATE MASTER (Indiana facility tracking) - CRTK-7337, EPCRA, UST-11990, UNDERGROUND STORAGE TANK PROGRAM Conditionally Exempt Small Quantity Generators, less than 100 kg/month of hazardous waste (Resource Conservation and Recovery Act (tracking hazardous waste)) (Resource Conservation and Recovery Act (tracking hazardous waste)) Organizations: AMOCO OIL CO (CONTACT/OWNER)
, BP PRODUCTS NORTH AMERICA (CONTACT/OWNER)
Alternative names: AMOCO 6212
AMOCO 2702 (7405 INDIANAPOLIS BLVD in HAMMOND, IN)
STATE MASTER (Indiana facility tracking) - CRTK-5167, EPCRA, LUST-198908533, LEAKING STORAGE TANK, UST-9683, UNDERGROUND STORAGE TANK PROGRAM (Resource Conservation and Recovery Act (tracking hazardous waste)) Organizations: ACA MANAGEMENT (CONTACT/OWNER)
AMOCO 6249 (7306 CALUMET AVE in HAMMOND, IN)
STATE MASTER (Indiana facility tracking) - CRTK-7340, EPCRA, LUST-199405521, LEAKING STORAGE TANK, UST-11491, UNDERGROUND STORAGE TANK PROGRAM (Resource Conservation and Recovery Act (tracking hazardous waste)) Organizations: AMOCO OIL CO (CONTACT/OWNER)
AMOCO SERVICE STATION 5434 (6906 COLUMBIA in HAMMOND, IN)
STATE MASTER (Indiana facility tracking) - CRTK-7330, EPCRA, LUST-199311501, LEAKING STORAGE TANK, UST-11481, UNDERGROUND STORAGE TANK PROGRAM, UST-17862, (Resource Conservation and Recovery Act (tracking hazardous waste)) Organizations: AMOCO OIL CO (CONTACT/OWNER)
Alternative names: AMOCO 5434
DENNYS WOODMAR SHELL (7306 INDIANAPOLIS BLVD in HAMMOND, IN)
STATE MASTER (Indiana facility tracking) - CRTK-8490, EPCRA, LUST-199611503, LEAKING STORAGE TANK, LUST-199903554, LUST-199905521, UST-590, UNDERGROUND STORAGE TANK PROGRAM (Resource Conservation and Recovery Act (tracking hazardous waste)) Organizations: SHELL OIL CO (CONTACT/OWNER)
Alternative names: SHELL OIL CO
MEIERS AMOCO (6906 HOHMAN AVE in HAMMOND, IN)
STATE MASTER (Indiana facility tracking) - CRTK-7324, EPCRA, LUST-199108527, LEAKING STORAGE TANK, UST-11475, UNDERGROUND STORAGE TANK PROGRAM Conditionally Exempt Small Quantity Generators, less than 100 kg/month of hazardous waste (Resource Conservation and Recovery Act (tracking hazardous waste)) - notification Conditionally Exempt Small Quantity Generators, less than 100 kg/month of hazardous waste (Resource Conservation and Recovery Act (tracking hazardous waste)) - notification Organizations: BP PRODUCTS NORTH AMERICA INC (CONTACT/OWNER)
, AMOCO OIL CO (CONTACT/OWNER)
Alternative names: AMOCO 18523, AMOCO OIL CO 18523, AMOCO OIL CO 18523, VOJAS AMOCO
NIPSCO HAMMOND OPERATING HEADQUARTERS (1313 167TH ST in HAMMOND, IN)
STATE MASTER (Indiana facility tracking) - LUST-199702521, LEAKING STORAGE TANK, UST-6089, UNDERGROUND STORAGE TANK PROGRAM, LUST-199101549, LEAKING STORAGE TANK, CRTK-4921, EPCRA, LUST-199003547, LEAKING STORAGE TANK Conditionally Exempt Small Quantity Generators, less than 100 kg/month of hazardous waste (Resource Conservation and Recovery Act (tracking hazardous waste)) - notification Business NAICS classification: ELECTRIC BULK POWER TRANSMISSION AND CONTROL.; ELECTRIC POWER DISTRIBUTION. Organizations: NIPSCO HAMMOND OPERATING HQ (CONTACT/OPERATOR)
, NISOURCE (CONTACT/OWNER)
CALUMET CONSTRUCTION CORP (1247 W 169TH ST in HAMMOND, IN)
STATE MASTER (Indiana facility tracking) - LUST-199003537, LEAKING STORAGE TANK, UST-3401, UNDERGROUND STORAGE TANK PROGRAM Conditionally Exempt Small Quantity Generators, less than 100 kg/month of hazardous waste (Resource Conservation and Recovery Act (tracking hazardous waste)) - notification
LEW WALLACE ELEMENTARY SCHOOL (6235 JEFFERSON AVE in HAMMOND, IN)
(Geographic Names Information System) (National Center for Education Statistics) - STATE ID-4479 Organizations: SCHOOL CITY OF HAMMOND (SCHOOL DISTRICT)
MAYWOOD ELEMENTARY SCHOOL (1001 165TH ST in HAMMOND, IN)
(Geographic Names Information System) (National Center for Education Statistics) - STATE ID-4465 Organizations: SCHOOL CITY OF HAMMOND (SCHOOL DISTRICT)
CLARK SERVICE STATION 221 (6318 CALUMET in HAMMOND, IN)
ENFORCEMENT/COMPLIANCE ACTIVITY (Integrated Compliance Information System) STATE MASTER (Indiana facility tracking) - LUST-199111121, LEAKING STORAGE TANK, UST-2984, UNDERGROUND STORAGE TANK PROGRAM, CRTK-8192, EPCRA Business SIC classification: GASOLINE SERVICE STATIONS Business NAICS classification: GASOLINE STATIONS WITH CONVENIENCE STORES. Alternative names: CLARK SERVICE STATION #221
DONALD E GAVIT MDL/HIGH SCH (1670 175TH ST in HAMMOND, IN)
(National Center for Education Statistics) - STATE ID-4413 Organizations: SCHOOL CITY OF HAMMOND (SCHOOL DISTRICT)
Housing units lacking complete plumbing facilities: 0.7% Housing units lacking complete kitchen facilities: 3.3%
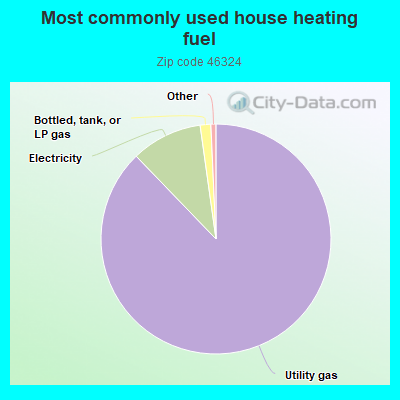
87.8%Utility gas
10.0%Electricity
1.5%Bottled, tank, or LP gas
Population in 1990: 23,585.
Place of birth for U.S.-born residents:
This state: 10,471
Northeast: 249
Midwest: 7,060
South: 1,386
West: 242
61% of the 46324 zip code residents lived in the same house 5 years ago. Out of people who lived in different houses, 65% lived in this county. Out of people who lived in different counties, 50% lived in Indiana.
92% of the 46324 zip code residents lived in the same house 1 year ago. Out of people who lived in different houses, 48% moved from this county. Out of people who lived in different houses, 20% moved from different county within same state. Out of people who lived in different houses, 32% moved from different state. Out of people who lived in different houses, 4% moved from abroad.
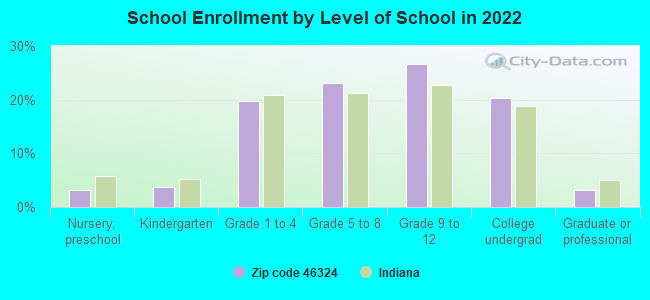
Private vs. public school enrollment:
Students in private schools in grades 1 to 8 (elementary and middle school): 600
Here:
24.5%
Indiana:
14.9%
Students in private schools in grades 9 to 12 (high school): 336
Here:
21.9%
Indiana:
11.4%
Students in private undergraduate colleges: 286
Here:
24.9%
Indiana:
22.3%
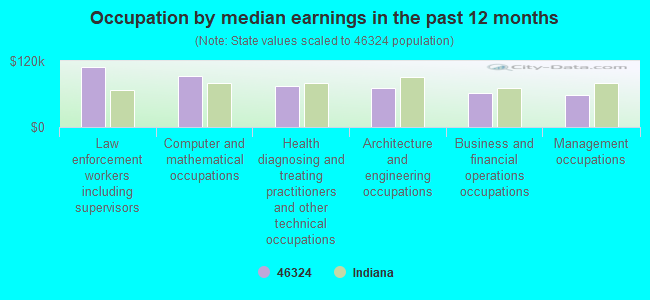
Occupation by median earnings in the past 12 months ($)
109,235Law enforcement workers including supervisors
92,594Computer and mathematical occupations
74,431Health diagnosing and treating practitioners and other technical occupations
71,339Architecture and engineering occupations
61,929Business and financial operations occupations
57,929Management occupations
Companies with federal contracts located in this zip code:
INDUSTRIAL TRADES IN-HOUSE TRA (443 CHERRY in HAMMOND, IN) : $44,250 in 4 contractsfrom 2000 to 2005
$37,050 with U.S. Army Corps of Engineers - civil program financing only for Education Services. Signed on 2000-09-16. Completion date: 2001-09-30.
$3,600 with Army for Books and Pamphlets. Taking place in WV. Signed on 2005-06-20. Completion date: 2005-06-09.
$3,600 with U.S. Army Corps of Engineers - civil program financing only for Books and Pamphlets. Taking place in WV. Signed on 2005-06-20. Completion date: 2005-06-09.
$0 with U.S. Army Corps of Engineers - civil program financing only for Education Services. Signed on 2000-09-16. Completion date: 2001-09-30.
Top industries in this zip code by the number of employees in 2005:
Health Care and Social Assistance: Medical Laboratories (250-499 employees: 1 establishment)
Utilities: Electric Power Distribution (50-99: 2, 20-49: 3, 10-19: 1, 5-9: 1)
2003 - 2018 National Fire Incident Reporting System (NFIRS) incidents
According to the data from the years 2003 - 2018 the average number of fire incidents per year is 38. The highest number of fire incidents - 78 took place in 2007, and the least - 0 in 2016. The data has a decreasing trend.
When looking into fire subcategories, the most reports belonged to: Structure Fires (36.7%), and Outside Fires (31.6%).
Fire incident types reported to NFIRS in Zip Code 46324
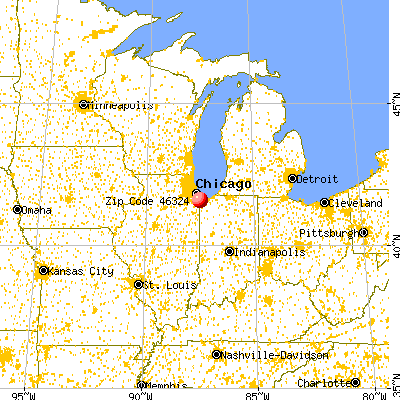


 Nearest zip codes: 46321, 46327, 46323, 60438, 46322, 60409.
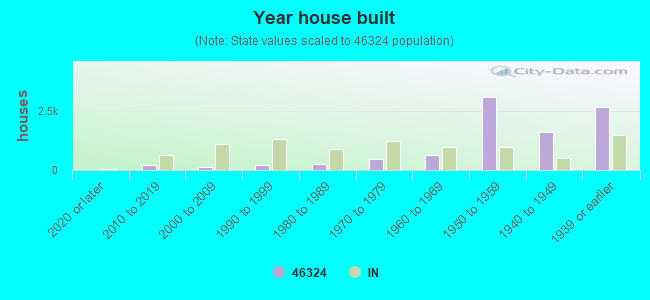


 According to the data from the years 2003 - 2018 the average number of fire incidents per year is 38. The highest number of fire incidents - 78 took place in 2007, and the least - 0 in 2016. The data has a decreasing trend.
 When looking into fire subcategories, the most reports belonged to: Structure Fires (36.7%), and Outside Fires (31.6%).