Estimated zip code population in 2022: 9,462 Zip code population in 2010: 9,405 Zip code population in 2000: 9,727
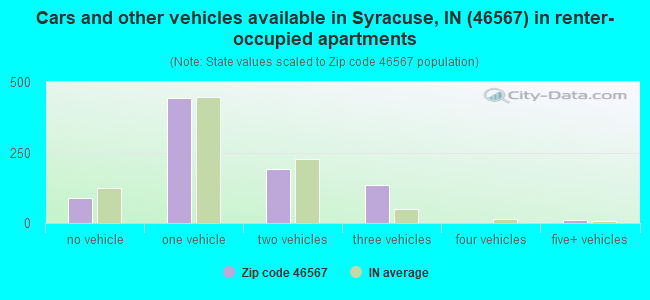
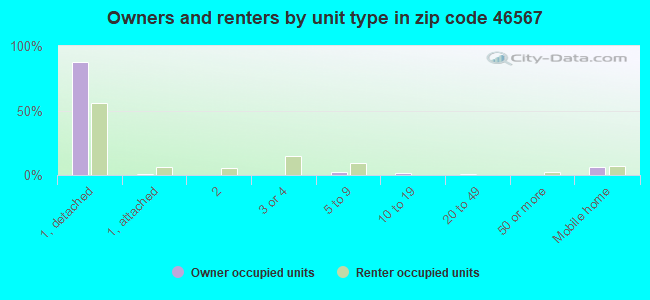
Houses and condos: 5,902 Renter-occupied apartments: 872
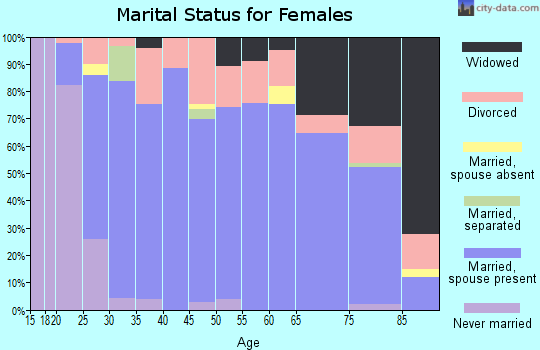
% of renters here:
21%
State:
29%
March 2022 cost of living index in zip code 46567: 79.1 (low, U.S. average is 100)
Land area: 55.6 sq. mi. Water area: 7.5 sq. mi.
Population density: 170 people per square mile
(very low).
OSM Map
General Map
Google Map
MSN Map
OSM Map
General Map
Google Map
MSN Map
OSM Map
General Map
Google Map
MSN Map
OSM Map
General Map
Google Map
MSN Map
Please wait while loading the map...
Real estate property taxes paid for housing units in 2022:
This zip code:
0.5% ($1,137)
Indiana:
0.7% ($1,467)
Median real estate property taxes paid for housing units with mortgages in 2022: $1,192 (0.5%) Median real estate property taxes paid for housing units with no mortgage in 2022: $1,044 (0.5%)
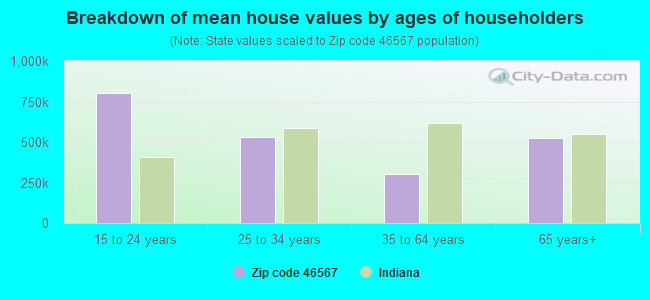
Estimated median house/condo value in 2022: $245,643
46567:
$245,643
Indiana:
$208,700
According to our research of Indiana and other state lists, there was 1 registered sex offender living in 46567 zip code as of April 26, 2024. The ratio of all residents to sex offenders in zip code 46567 is 8,981 to 1. The ratio of registered sex offenders to all residents in this zip code is much lower than the state average.
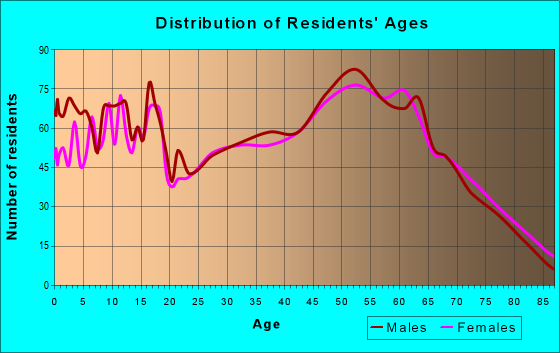
Median resident age:
This zip code:
49.0 years
Indiana median age:
38.2 years
Average household size:
This zip code:
2.3 people
Indiana:
2.4 people
Averages for the 2020 tax year for zip code 46567, filed in 2021:
Average Adjusted Gross Income (AGI) in 2020: $88,352 (Individual Income Tax Returns)
Here:
$88,352
State:
$64,978
Salary/wage: $58,095 (reported on 80.6% of returns)
Here:
$58,095
State:
$55,245
(% of AGI for various income ranges: 1102.4% for AGIs below $25k, 3610.5% for AGIs $25k-50k, 6251.4% for AGIs $50k-75k, 9112.4% for AGIs $75k-100k, 17290.6% for AGIs $100k-200k, 105566.7% for AGIs over 200k)
Taxable interest for individuals: $2,577 (reported on 34.2% of returns)
This zip code:
$2,577
Indiana:
$1,351
(% of AGI for various income ranges: 27.8% for AGIs below $25k, 24.2% for AGIs $25k-50k, 31.6% for AGIs $50k-75k, 114.5% for AGIs $75k-100k, 200.6% for AGIs $100k-200k, 4438.3% for AGIs over 200k)
Ordinary dividends: $11,100 (reported on 22.0% of returns)
Here:
$11,100
State:
$5,827
(% of AGI for various income ranges: 48.3% for AGIs below $25k, 50.9% for AGIs $25k-50k, 104.4% for AGIs $50k-75k, 210.3% for AGIs $75k-100k, 692.8% for AGIs $100k-200k, 12735.0% for AGIs over 200k)
Net capital gain/loss in AGI: +$66,205 (reported on 21.6% of returns)
Here:
+$66,205
State:
+$17,730
(% of AGI for various income ranges: 8.8% for AGIs below $25k, 40.5% for AGIs $25k-50k, 99.1% for AGIs $50k-75k, 302.7% for AGIs $75k-100k, 1122.8% for AGIs $100k-200k, 109673.3% for AGIs over 200k)
Profit/loss from business: +$19,029 (reported on 13.6% of returns)
Here:
+$19,029
State:
+$12,144
(% of AGI for various income ranges: 93.2% for AGIs below $25k, 115.6% for AGIs $25k-50k, 109.8% for AGIs $50k-75k, 279.1% for AGIs $75k-100k, 961.6% for AGIs $100k-200k, 10278.3% for AGIs over 200k)
Taxable individual retirement arrangement distribution: $20,024 (reported on 13.6% of returns)
46567:
$20,024
Indiana:
$18,302
(% of AGI for various income ranges: 97.3% for AGIs below $25k, 143.5% for AGIs $25k-50k, 258.0% for AGIs $50k-75k, 470.9% for AGIs $75k-100k, 1539.1% for AGIs $100k-200k, 5183.3% for AGIs over 200k)
Self-employed (Keogh) retirement plans: $24,500 (reported on 0.4% of returns)
46567:
$24,500
Indiana:
$27,160
(% of AGI for various income ranges: 153.1% for AGIs $100k-200k)
Total itemized deductions: $45,681 (reported on 7.4% of returns)
Here:
$45,681
State:
$35,601
(% of AGI for various income ranges: 154.0% for AGIs $25k-50k, 147.0% for AGIs $50k-75k, 361.2% for AGIs $75k-100k, 1139.1% for AGIs $100k-200k, 16153.3% for AGIs over 200k)
Charity contributions: $18,709 (reported on 6.4% of returns)
Here:
$18,709
State:
$15,596
(% of AGI for various income ranges: 15.7% for AGIs $25k-50k, 32.3% for AGIs $50k-75k, 93.6% for AGIs $75k-100k, 343.4% for AGIs $100k-200k, 7043.3% for AGIs over 200k)
Taxes paid: $8,167 (reported on 7.2% of returns)
46567:
$8,167
State:
$7,542
(% of AGI for various income ranges: 19.9% for AGIs $25k-50k, 25.5% for AGIs $50k-75k, 73.6% for AGIs $75k-100k, 273.8% for AGIs $100k-200k, 2455.0% for AGIs over 200k)
Earned income credit: $2,132 (reported on 12.6% of returns)
Here:
$2,132
State:
$2,298
(% of AGI for various income ranges: 74.4% for AGIs below $25k, 58.8% for AGIs $25k-50k)
Percentage of individuals using paid preparers for their 2020 taxes: 95.0%
Here:
95%
State:
94%
(% for various income ranges: 92.4% for AGIs below $25k, 96.6% for AGIs $25k-50k, 96.4% for AGIs $50k-75k, 96.0% for AGIs $75k-100k, 96.8% for AGIs $100k-200k, 93.1% for AGIs over 200k)
Averages for the 2012 tax year for zip code 46567, filed in 2013:
Average Adjusted Gross Income (AGI) in 2012: $61,321 (Individual Income Tax Returns)
Here:
$61,321
State:
$52,932
Salary/wage: $44,742 (reported on 81.6% of returns)
Here:
$44,742
State:
$45,173
(% of AGI for various income ranges: 70.3% for AGIs below $25k, 81.1% for AGIs $25k-50k, 78.4% for AGIs $50k-75k, 73.4% for AGIs $75k-100k, 64.5% for AGIs $100k-200k, 28.8% for AGIs over 200k)
Taxable interest for individuals: $2,398 (reported on 36.8% of returns)
This zip code:
$2,398
Indiana:
$1,311
(% of AGI for various income ranges: 2.2% for AGIs below $25k, 0.6% for AGIs $25k-50k, 0.9% for AGIs $50k-75k, 1.4% for AGIs $75k-100k, 1.7% for AGIs $100k-200k, 1.8% for AGIs over 200k)
Ordinary dividends: $7,184 (reported on 20.6% of returns)
Here:
$7,184
State:
$4,690
(% of AGI for various income ranges: 3.0% for AGIs below $25k, 0.9% for AGIs $25k-50k, 1.3% for AGIs $50k-75k, 2.1% for AGIs $75k-100k, 3.3% for AGIs $100k-200k, 3.2% for AGIs over 200k)
Net capital gain/loss in AGI: +$31,794 (reported on 18.4% of returns)
Here:
+$31,794
State:
+$10,406
(% of AGI for various income ranges: 0.3% for AGIs $25k-50k, 0.7% for AGIs $50k-75k, 2.2% for AGIs $75k-100k, 2.7% for AGIs $100k-200k, 27.5% for AGIs over 200k)
Profit/loss from business: +$9,206 (reported on 14.5% of returns)
Here:
+$9,206
State:
+$11,105
(% of AGI for various income ranges: 5.6% for AGIs below $25k, 2.2% for AGIs $25k-50k, 1.9% for AGIs $50k-75k, 1.4% for AGIs $75k-100k, 2.4% for AGIs $100k-200k, 1.7% for AGIs over 200k)
Taxable individual retirement arrangement distribution: $16,284 (reported on 13.8% of returns)
46567:
$16,284
Indiana:
$13,841
(% of AGI for various income ranges: 4.8% for AGIs below $25k, 2.9% for AGIs $25k-50k, 3.1% for AGIs $50k-75k, 3.6% for AGIs $75k-100k, 5.4% for AGIs $100k-200k, 3.1% for AGIs over 200k)
Total itemized deductions: $24,963 (18% of AGI, reported on 26.5% of returns)
Here:
$24,963
State:
$20,913
Here:
18.2% of AGI
State:
18.2% of AGI
(% of AGI for various income ranges: 10.2% for AGIs below $25k, 6.9% for AGIs $25k-50k, 8.6% for AGIs $50k-75k, 11.2% for AGIs $75k-100k, 14.5% for AGIs $100k-200k, 11.7% for AGIs over 200k)
Charity contributions: $6,402 (reported on 20.6% of returns)
Here:
$6,402
State:
$4,697
(% of AGI for various income ranges: 0.8% for AGIs below $25k, 0.9% for AGIs $25k-50k, 1.2% for AGIs $50k-75k, 1.8% for AGIs $75k-100k, 2.4% for AGIs $100k-200k, 3.6% for AGIs over 200k)
Taxes paid: $8,936 (reported on 26.5% of returns)
46567:
$8,936
State:
$7,456
(% of AGI for various income ranges: 2.1% for AGIs below $25k, 1.7% for AGIs $25k-50k, 2.4% for AGIs $50k-75k, 3.4% for AGIs $75k-100k, 5.4% for AGIs $100k-200k, 5.4% for AGIs over 200k)
Earned income credit: $2,090 (reported on 15.6% of returns)
Here:
$2,090
State:
$2,265
(% of AGI for various income ranges: 5.3% for AGIs below $25k, 1.0% for AGIs $25k-50k)
Percentage of individuals using paid preparers for their 2012 taxes: 61.6%
Here:
62%
State:
53%
(% for various income ranges: 57.1% for AGIs below $25k, 61.6% for AGIs $25k-50k, 61.3% for AGIs $50k-75k, 63.4% for AGIs $75k-100k, 73.0% for AGIs $100k-200k, 81.2% for AGIs over 200k)
Averages for the 2004 tax year for zip code 46567, filed in 2005:
Average Adjusted Gross Income (AGI) in 2004: $60,695 (Individual Income Tax Returns)
Here:
$60,695
State:
$44,790
Salary/wage: $41,001 (reported on 85.3% of returns)
Here:
$41,001
State:
$39,615
(% of AGI for various income ranges: 138.0% for AGIs below $10k, 73.8% for AGIs $10k-25k, 83.0% for AGIs $25k-50k, 82.1% for AGIs $50k-75k, 75.9% for AGIs $75k-100k, 35.1% for AGIs over 100k)
Taxable interest for individuals: $3,354 (reported on 44.9% of returns)
This zip code:
$3,354
Indiana:
$1,535
(% of AGI for various income ranges: 10.8% for AGIs below $10k, 3.4% for AGIs $10k-25k, 1.5% for AGIs $25k-50k, 1.4% for AGIs $50k-75k, 1.8% for AGIs $75k-100k, 3.0% for AGIs over 100k)
Taxable dividends: $5,826 (reported on 25.1% of returns)
Here:
$5,826
State:
$2,998
(% of AGI for various income ranges: 7.5% for AGIs below $10k, 2.1% for AGIs $10k-25k, 1.0% for AGIs $25k-50k, 1.1% for AGIs $50k-75k, 1.3% for AGIs $75k-100k, 3.4% for AGIs over 100k)
Net capital gain/loss: +$25,619 (reported on 20.4% of returns)
Here:
+$25,619
State:
+$8,619
(% of AGI for various income ranges: -0.6% for AGIs below $10k, 0.8% for AGIs $10k-25k, 1.0% for AGIs $25k-50k, 1.2% for AGIs $50k-75k, 1.6% for AGIs $75k-100k, 15.8% for AGIs over 100k)
Profit/loss from business: +$10,556 (reported on 14.4% of returns)
Here:
+$10,556
State:
+$10,071
(% of AGI for various income ranges: 1.4% for AGIs below $10k, 4.5% for AGIs $10k-25k, 2.2% for AGIs $25k-50k, 2.6% for AGIs $50k-75k, 1.4% for AGIs $75k-100k, 2.6% for AGIs over 100k)
IRA payment deduction: $3,284 (reported on 3.0% of returns)
46567:
$3,284
Indiana:
$2,840
(% of AGI for various income ranges: 0.2% for AGIs $10k-25k, 0.3% for AGIs $25k-50k, 0.2% for AGIs $50k-75k, 0.2% for AGIs $75k-100k, 0.1% for AGIs over 100k)
Self-employed pension: $13,960 (reported on 0.5% of returns)
Here:
$13,960
Indiana:
$15,305
Total itemized deductions: $25,362 (19% of AGI, reported on 31.4% of returns)
Here:
$25,362
State:
$17,065
Here:
19.1% of AGI
State:
19.5% of AGI
(% of AGI for various income ranges: 25.0% for AGIs below $10k, 9.0% for AGIs $10k-25k, 9.9% for AGIs $25k-50k, 12.0% for AGIs $50k-75k, 13.5% for AGIs $75k-100k, 14.7% for AGIs over 100k)
Charity contributions deductions: $5,359 (4% of AGI, reported on 25.5% of returns)
Here:
$5,359
State:
$3,550
Here:
4.1% of AGI
State:
3.8% of AGI
(% of AGI for various income ranges: 0.9% for AGIs below $10k, 1.0% for AGIs $10k-25k, 1.2% for AGIs $25k-50k, 1.7% for AGIs $50k-75k, 1.9% for AGIs $75k-100k, 3.0% for AGIs over 100k)
Total tax: $11,839 (reported on 75.8% of returns)
46567:
$11,839
State:
$6,914
(% of AGI for various income ranges: 3.2% for AGIs below $10k, 4.4% for AGIs $10k-25k, 6.9% for AGIs $25k-50k, 8.6% for AGIs $50k-75k, 10.3% for AGIs $75k-100k, 21.5% for AGIs over 100k)
Earned income credit: $1,560 (reported on 11.3% of returns)
Here:
$1,560
State:
$1,685
Percentage of individuals using paid preparers for their 2004 taxes: 66.7%
Here:
67%
State:
59%
(% for various income ranges: 57.8% for AGIs below $10k, 68.1% for AGIs $10k-25k, 67.4% for AGIs $25k-50k, 67.7% for AGIs $50k-75k, 72.0% for AGIs $75k-100k, 76.7% for AGIs over 100k)
Household received Food Stamps/SNAP in the past 12 months: 194 Household did not receive Food Stamps/SNAP in the past 12 months: 3,923
Women who had a birth in the past 12 months: 150 (137 now married, 19 unmarried) Women who did not have a birth in the past 12 months: 1,637 (773 now married, 864 unmarried)
Housing units in zip code 46567 with a mortgage: 1,900 (317 second mortgage, 21 home equity loan, 302 both second mortgage and home equity loan) Houses without a mortgage: 41
Median monthly owner costs for units with a mortgage: $1,366 Median monthly owner costs for units without a mortgage: $484
Residents with income below the poverty level in 2022:
This zip code:
5.3%
Whole state:
12.6%
Residents with income below 50% of the poverty level in 2022:
This zip code:
3.5%
Whole state:
6.3%
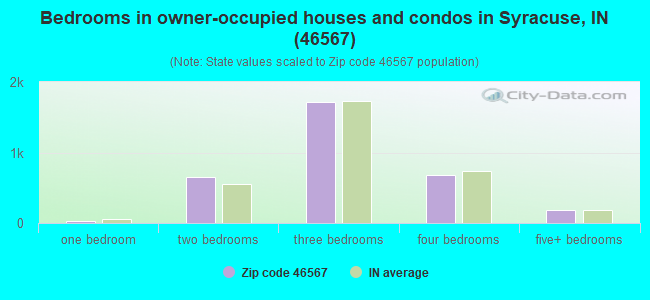
Median number of rooms in houses and condos:
Here:
6.8
State:
6.6
Median number of rooms in apartments:
Here:
4.9
State:
4.3
Notable locations in this zip code not listed on our city pages
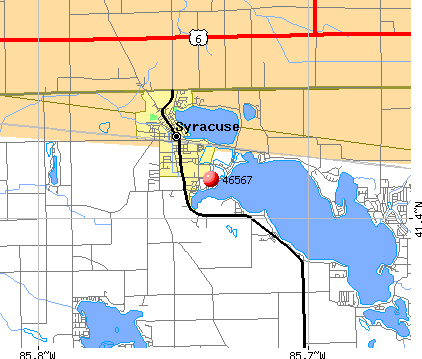
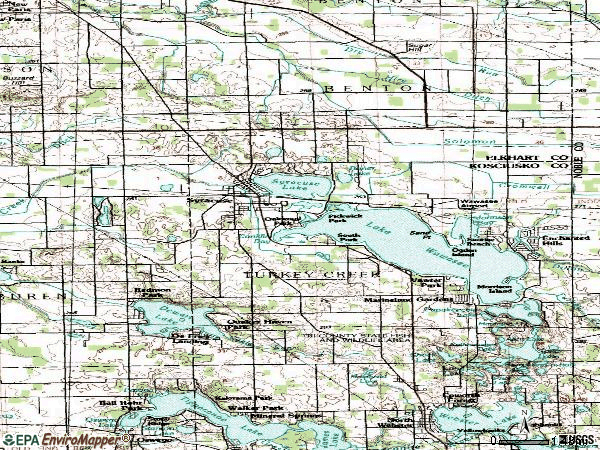
Notable locations in zip code 46567: Maxwelton Golf Club (A), Sand Point (B), Wawasee State Fish Hatchery (C), Wawasee Golf Club (D), South Shore Golf Club (E), Syracuse Fire Department Station 2 (F), Syracuse Fire Department Station 1 (G). Display/hide their locations on the map
Churches in zip code 46567 include: Church of the Little Flower (A), Lakeside Chapel (B), Concord Church (C), Solomon Creek Church (D), Zion Church (E). Display/hide their locations on the map
Cemeteries: Weybright Cemetery (1), Tamarack Cemetery (2), Cable Cemetery (3), Byers Cemetery (4), Union Cemetery (5), McClintic Cemetery (6). Display/hide their locations on the map
Lakes and reservoirs: Allen Lake (A), Lake Wawasee (B), Barel-and-a-Half Lake (C), Frog Pond (D), Rothenbeger Lake (E), Boner Lake (F), Dewart Lake (G), Shock Lake (H). Display/hide their locations on the map
Parks in zip code 46567 include: Wawasee Public Fishing Area (1), Tri-County State Fish And Game Area (2), Lakeview Park (3). Display/hide their locations on the map
1,405 married couples with children.
254 single-parent households (73 men, 181 women).
89.4% of residents of 46567 zip code speak English at home.
2.1% of residents speak Spanish at home (100% very well).
9.7% of residents speak other Indo-European language at home (30% very well, 54% well, 17% not well).
0.1% of residents speak Asian or Pacific Island language at home (45% very well, 18% well, 36% not well).
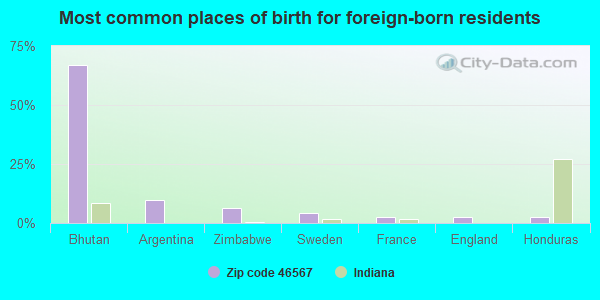
Foreign born population: 298 (3.2%) (57.1% of them are naturalized citizens)
This zip code:
3.2%
Whole state:
6.1%
67%Bhutan
10%Argentina
6%Zimbabwe
4%Sweden
3%France
2%England
2%Honduras
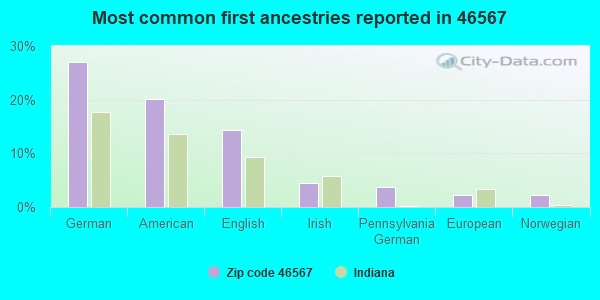
27%German
20%American
14%English
4%Irish
4%Pennsylvania German
2%European
2%Norwegian
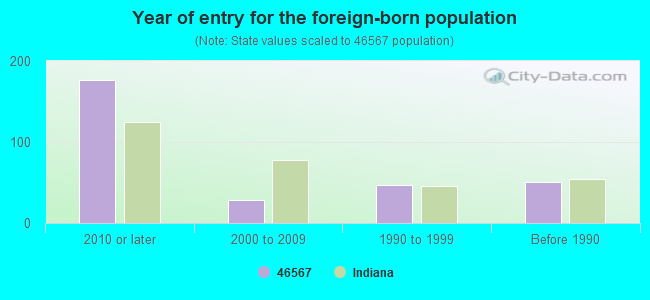
Year of entry for the foreign-born population
1762010 or later
292000 to 2009
471990 to 1999
51Before 1990
Major facilities with environmental interests located in this zip code:
RINKER BOAT COMPANY INCORPORATED (300 W CHICAGO in SYRACUSE, IN)
AIR MAJOR (AIRS/AFS) STATE MASTER (Indiana facility tracking) - ACES-OP-08500031, AIR PROGRAM, CRTK-2255, EPCRA, LUST-198907523, LEAKING STORAGE TANK, LUST-199411503, UST-8028, UNDERGROUND STORAGE TANK PROGRAM CRITERIA AND HAZARDOUS AIR POLLUTANT INVENTORY (Inventory of air pollution sources) National Pollutant Discharge Elimination System NON-MAJOR (Tracking pollutant discharge elimination systems) - permit HAZARDOUS WASTE BIENNIAL REPORTER (Resource Conservation and Recovery Act (tracking hazardous waste)) Large Quantity Generators, more that 1000 kg of hazardous waste/month (Resource Conservation and Recovery Act (tracking hazardous waste)) - notification TRI REPORTER (Tracking of toxic chemicals releasing facilities) Business SIC classification: BOAT BUILDING AND REPAIRING; MANUFACTURING INDUSTRIES Business NAICS classification: BOAT BUILDING. Organizations: RINKER BOAT CO INC (CONTACT/OPERATOR)
, RINKER BOAT CO LLC (CONTACT/OPERATOR)
, CERTIFIED OPERATOR (CONTACT/OPERATOR)
, RINKER BOAT C/O JOHN RINKER (CONTACT/OWNER)
, RINKER BOAT CO LLC (CONTACT/OWNER)
Alternative names: RINKER BOAT COMPANY, LLC
PARKER ENGINEERED SEALS (501 SOUTH SYCAMORE STREET in SYRACUSE, IN)
STATE MASTER (Indiana facility tracking) - ACES-OP-08500046, AIR PROGRAM, CRTK-3049, EPCRA, LUST-198908505, LEAKING STORAGE TANK, UST-751, UNDERGROUND STORAGE TANK PROGRAM CRITERIA AND HAZARDOUS AIR POLLUTANT INVENTORY (Inventory of air pollution sources) National Pollutant Discharge Elimination System NON-MAJOR (Tracking pollutant discharge elimination systems) - permit Conditionally Exempt Small Quantity Generators, less than 100 kg/month of hazardous waste (Resource Conservation and Recovery Act (tracking hazardous waste)) - notification TRI REPORTER (Tracking of toxic chemicals releasing facilities) Business SIC classification: MOLDED, EXTRUDED, AND LATHE-CUT MECHANICAL RUBBER GOODS; FABRICATED RUBBER PRODUCTS; MOTOR VEHICLE PARTS AND ACCESSORIES Organizations: CERTIFIED OPERATOR (CONTACT/OPERATOR)
, SYRACUSE RUBBER PRODUCTS INC (CONTACT/OWNER)
, PARKER-HANNIFIN (CONTACT/OWNER)
Alternative names: PARKER-GOSHEN, PARKER HANNIFIN, PARKER HANNIFIN ENG SEALS DIV, PARKER HANNIFIN ENGINEERED SEALS DIV, SYRACUSE RUBBER PRODS. INC.
PM AG PRODUCTS INCORPORATED (100 S HUNTINGTON MINERAL PLANT in SYRACUSE, IN)
AIR MINOR (AIRS/AFS) STATE MASTER (Indiana facility tracking) - ACES-OP-08500020, AIR PROGRAM, CRTK-5331, EPCRA, CRTK-8329, LUST-199811051, LEAKING STORAGE TANK, UST-8487, UNDERGROUND STORAGE TANK PROGRAM CRITERIA AND HAZARDOUS AIR POLLUTANT INVENTORY (Inventory of air pollution sources) TRI REPORTER (Tracking of toxic chemicals releasing facilities) Business SIC classification: PREPARED FEEDS AND FEED INGREDIENTS FOR ANIMALS AND FOWLS, EXCEPT DOGS AND CATS; CANE SUGAR, EXCEPT REFINING Alternative names: PM AG/SWEETLIX L.L.C., SWEETLIX L.L.C., SWEETLIX L.L.C.
COMMODORE HOMES SYSTEMS INC (72440 SR 13 N in SYRACUSE, IN)
AIR MAJOR (AIRS/AFS) STATE MASTER (Indiana facility tracking) - ACES-OP-03900467, AIR PROGRAM, CRTK-21335, EPCRA CRITERIA AND HAZARDOUS AIR POLLUTANT INVENTORY (Inventory of air pollution sources) Conditionally Exempt Small Quantity Generators, less than 100 kg/month of hazardous waste (Resource Conservation and Recovery Act (tracking hazardous waste)) - notification TRI REPORTER (Tracking of toxic chemicals releasing facilities) Business SIC classification: MOBILE HOMES; WOOD OFFICE AND STORE FIXTURES, PARTITIONS, SHELVING, AND LOCKERS Business NAICS classification: MANUFACTURED HOME (MOBILE HOME) MANUFACTURING. Organizations: SHEIN BARRY (CONTACT/OWNER)
Alternative names: AMERICAN CAMPER, COMMODORE CORP.
DNR FISH & WILDLIFE PUBLIC ACCESS NORTH (7548 E 850 N in SYRACUSE, IN)
STATE MASTER (Indiana facility tracking) - CRTK-19884, EPCRA, CRTK-5979, LUST-199201530, LEAKING STORAGE TANK, UST-17902, UNDERGROUND STORAGE TANK PROGRAM, UST-7753, (Resource Conservation and Recovery Act (tracking hazardous waste)) Organizations: INDIANA DEPT OF NATURAL RECREATION (CONTACT/OWNER)
LIBERTY HOMES (203 S HUNTINGTON in SYRACUSE, IN)
AIR SYNTHETIC MINOR (AIRS/AFS) STATE MASTER (Indiana facility tracking) - ACES-OP-08500043, AIR PROGRAM, UST-13309, UNDERGROUND STORAGE TANK PROGRAM Business SIC classification: MOBILE HOMES
MAPLE LEAF FARMS FEEDMILL (2764 E. 1300 N. in SYRACUSE, IN)
STATE MASTER (Indiana facility tracking) - CRTK-9113, EPCRA TRI REPORTER (Tracking of toxic chemicals releasing facilities) Business SIC classification: PREPARED FEEDS AND FEED INGREDIENTS FOR ANIMALS AND FOWLS, EXCEPT DOGS AND CATS Alternative names: MAPLE LEAF FARMS-INDIANA FEED MILL
PARKER HANNIFIN CORPORATION (ENGINEERED SEALS DIVISION in SYRACUSE, IN)
STATE MASTER (Indiana facility tracking) National Pollutant Discharge Elimination System NON-MAJOR (Tracking pollutant discharge elimination systems) - permit Business SIC classification: FABRICATED RUBBER PRODUCTS Organizations: CERTIFIED OPERATOR (CONTACT/OPERATOR)
Alternative names: PARKER HANNIFIN CORP., ENGINEE
PHILLIPS INDUSTRIES (1009 W BROOKLYN ST in SYRACUSE, IN)
STATE MASTER (Indiana facility tracking) (Resource Conservation and Recovery Act (tracking hazardous waste)) Organizations: ROBERT PHILLIPS (CONTACT/OWNER)
ABE CORP (9566 N 300 E in SYRACUSE, IN)
STATE MASTER (Indiana facility tracking) Conditionally Exempt Small Quantity Generators, less than 100 kg/month of hazardous waste (Resource Conservation and Recovery Act (tracking hazardous waste)) - notification Organizations: ALAN ABRAMS (CONTACT/OWNER)
BILL'S AUTOMOTIVE (1403 N INDIANA AVE in SYRACUSE, IN)
STATE MASTER (Indiana facility tracking) Conditionally Exempt Small Quantity Generators, less than 100 kg/month of hazardous waste (Resource Conservation and Recovery Act (tracking hazardous waste)) - notification Organizations: WILLIAM J SCHERER (CONTACT/OWNER)
CSX TRANSPORTATION (RTE 13 AT RR TRACK in SYRACUSE, IN)
STATE MASTER (Indiana facility tracking) Conditionally Exempt Small Quantity Generators, less than 100 kg/month of hazardous waste (Resource Conservation and Recovery Act (tracking hazardous waste)) - notification
ROGERS ELECTRO MATICS INC (405 W CHICAGO ST in SYRACUSE, IN)
STATE MASTER (Indiana facility tracking) Conditionally Exempt Small Quantity Generators, less than 100 kg/month of hazardous waste (Resource Conservation and Recovery Act (tracking hazardous waste)) - notification Organizations: HALLER ROBERT W (CONTACT/OWNER)
Housing units lacking complete plumbing facilities: 2.0% Housing units lacking complete kitchen facilities: 2.9%
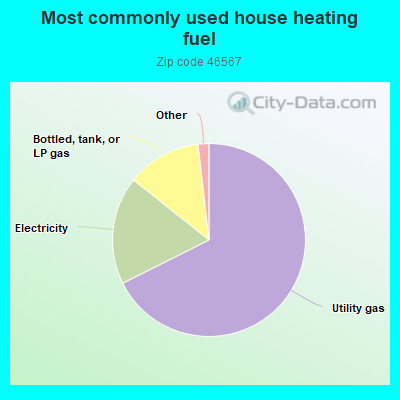
67.6%Utility gas
18.1%Electricity
12.5%Bottled, tank, or LP gas
0.9%Wood
0.6%Other fuel
Population in 1990: 7,695. Population change in the 1990s: +2,032 (+26.4%).
Place of birth for U.S.-born residents:
This state: 7,305
Northeast: 207
Midwest: 1,110
South: 361
West: 148
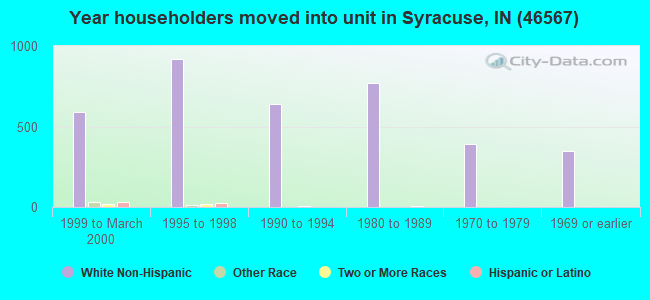
59% of the 46567 zip code residents lived in the same house 5 years ago. Out of people who lived in different houses, 51% lived in this county. Out of people who lived in different counties, 50% lived in Indiana.
91% of the 46567 zip code residents lived in the same house 1 year ago. Out of people who lived in different houses, 28% moved from this county. Out of people who lived in different houses, 36% moved from different county within same state. Out of people who lived in different houses, 17% moved from different state. Out of people who lived in different houses, 23% moved from abroad.
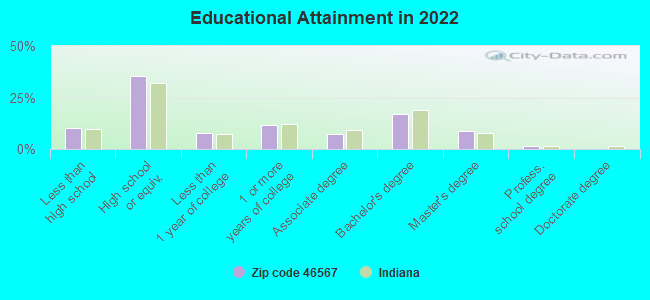
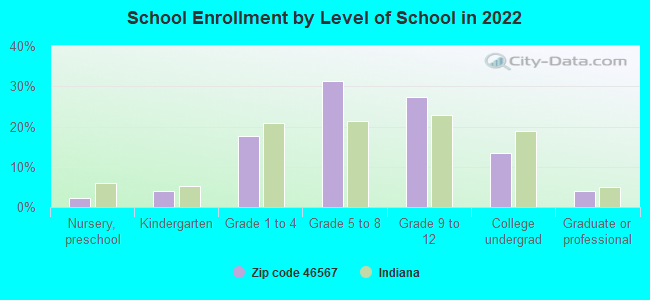
Private vs. public school enrollment:
Students in private schools in grades 1 to 8 (elementary and middle school): 186
Here:
25.2%
Indiana:
14.9%
Students in private schools in grades 9 to 12 (high school): 8
Here:
1.9%
Indiana:
11.4%
Students in private undergraduate colleges: 43
Here:
21.3%
Indiana:
22.3%
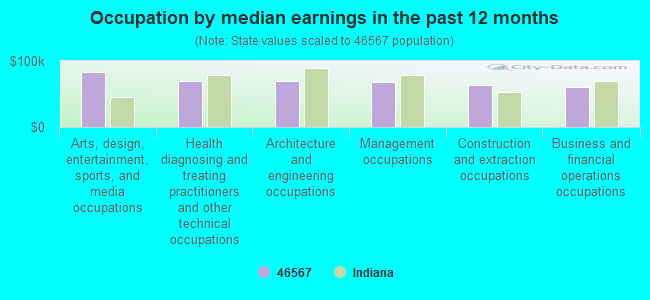
Occupation by median earnings in the past 12 months ($)
83,838Arts, design, entertainment, sports, and media occupations
70,095Health diagnosing and treating practitioners and other technical occupations
69,332Architecture and engineering occupations
67,989Management occupations
63,000Construction and extraction occupations
61,157Business and financial operations occupations
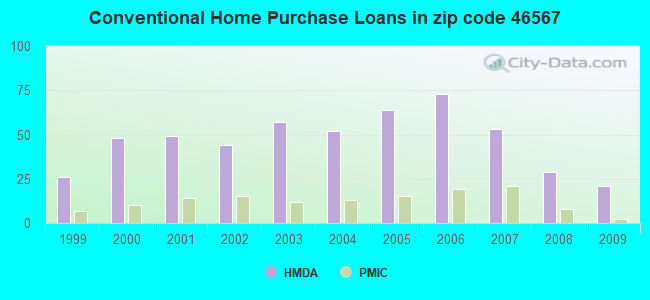
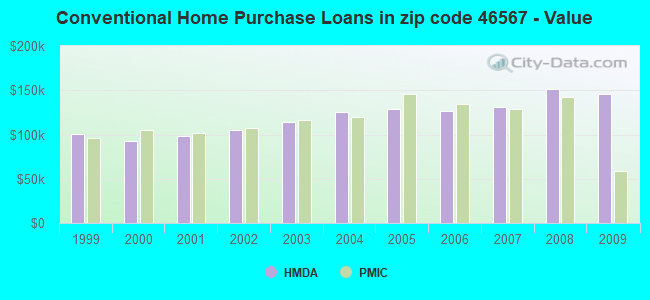
Top industries in this zip code by the number of employees in 2005:
Detailed PMIC statistics for the following Tracts:0009.00
, 0010.00
2002 - 2018 National Fire Incident Reporting System (NFIRS) incidents
According to the data from the years 2002 - 2018 the average number of fire incidents per year is 40. The highest number of fires - 88 took place in 2004, and the least - 1 in 2014. The data has a rising trend.
When looking into fire subcategories, the most incidents belonged to: Structure Fires (40.4%), and Outside Fires (32.7%).
Fire incident types reported to NFIRS in Zip Code 46567
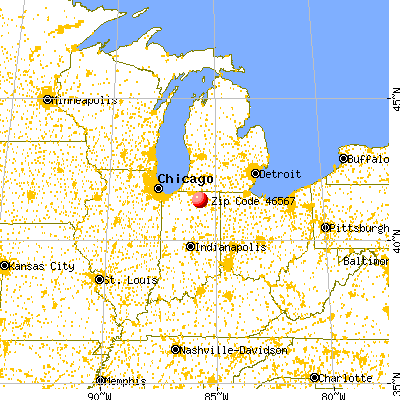


 Nearest zip codes: 46555, 46732, 46538, 46543, 46553, 46542.
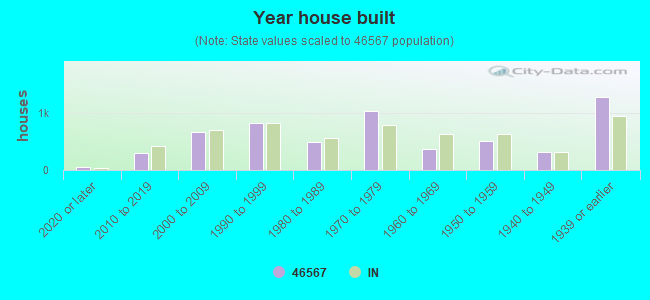


 According to the data from the years 2002 - 2018 the average number of fire incidents per year is 40. The highest number of fires - 88 took place in 2004, and the least - 1 in 2014. The data has a rising trend.
 When looking into fire subcategories, the most incidents belonged to: Structure Fires (40.4%), and Outside Fires (32.7%).