Estimated zip code population in 2022: 4,530 Zip code population in 2010: 3,867 Zip code population in 2000: 4,257
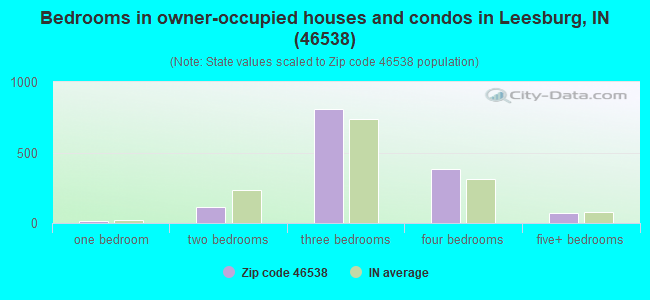
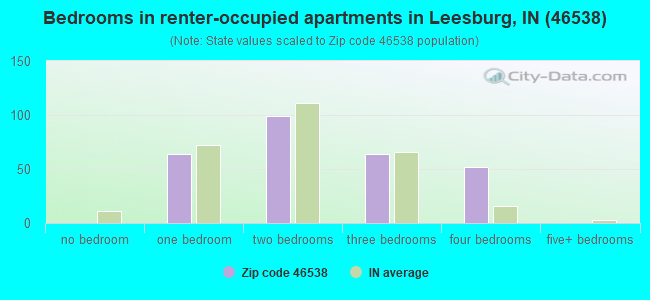
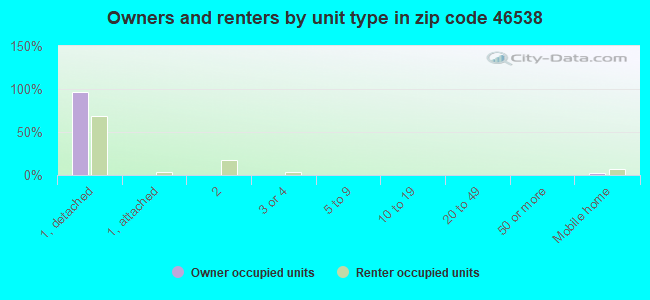
Houses and condos: 2,795 Renter-occupied apartments: 276
% of renters here:
17%
State:
29%
March 2022 cost of living index in zip code 46538: 86.8 (less than average, U.S. average is 100)
Land area: 30.7 sq. mi. Water area: 2.5 sq. mi.
Population density: 147 people per square mile
(very low).
OSM Map
General Map
Google Map
MSN Map
OSM Map
General Map
Google Map
MSN Map
OSM Map
General Map
Google Map
MSN Map
OSM Map
General Map
Google Map
MSN Map
Please wait while loading the map...
Real estate property taxes paid for housing units in 2022:
This zip code:
0.5% ($1,407)
Indiana:
0.7% ($1,467)
Median real estate property taxes paid for housing units with mortgages in 2022: $1,302 (0.5%) Median real estate property taxes paid for housing units with no mortgage in 2022: $1,631 (0.5%)
Business Search- 14 Million verified businesses
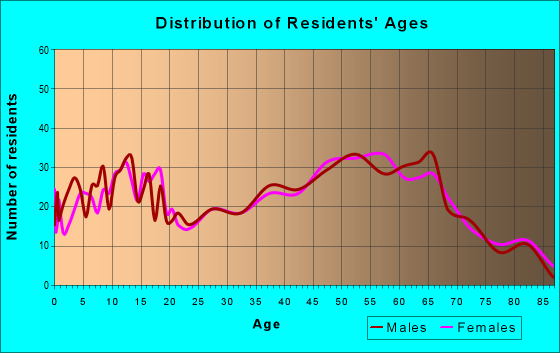
Males: 2,380
(52.5%)
Females: 2,150
(47.5%)
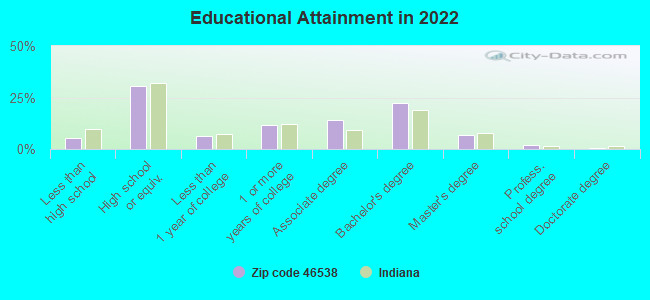
For population 25 years and over in 46538:
High school or higher: 94.7%
Bachelor's degree or higher: 31.9%
Graduate or professional degree: 9.3%
Unemployed: 6.1%
Mean travel time to work (commute): 26.6 minutes
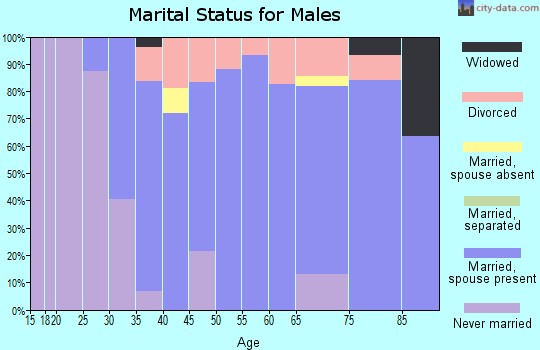
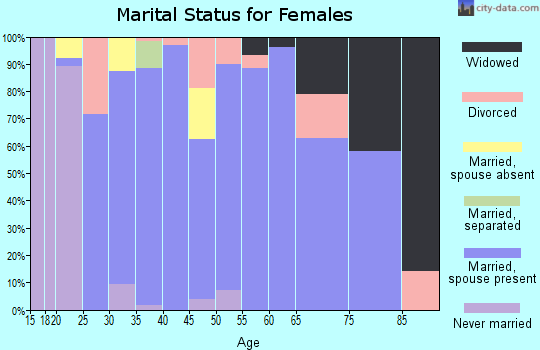
For population 15 years and over in 46538:
Never married: 18.5%
Now married: 65.2%
Separated: 1.9%
Widowed: 3.1%
Divorced: 11.2%
Zip code 46538 compared to state average:
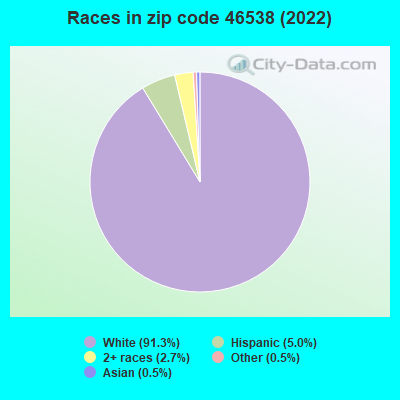
Black race population percentage significantly below state average.
Renting percentage below state average.
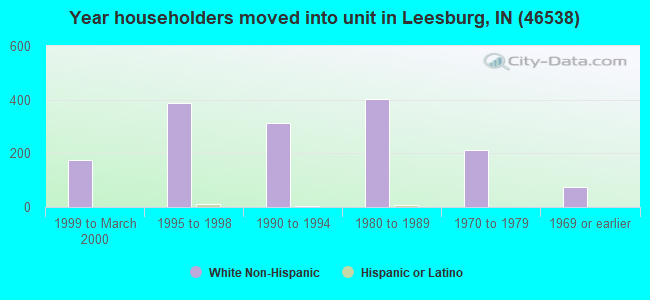
Length of stay since moving in significantly above state average.
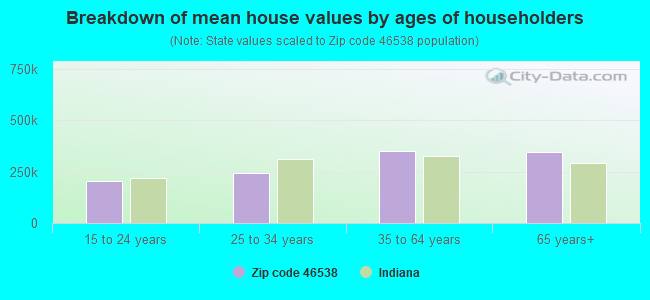
Estimated median house/condo value in 2022: $287,474
46538:
$287,474
Indiana:
$208,700
Median resident age:
This zip code:
39.7 years
Indiana median age:
38.2 years
Average household size:
This zip code:
2.7 people
Indiana:
2.4 people
Averages for the 2020 tax year for zip code 46538, filed in 2021:
Average Adjusted Gross Income (AGI) in 2020: $82,139 (Individual Income Tax Returns)
Here:
$82,139
State:
$64,978
Salary/wage: $64,737 (reported on 79.4% of returns)
Here:
$64,737
State:
$55,245
(% of AGI for various income ranges: 1086.1% for AGIs below $25k, 3601.5% for AGIs $25k-50k, 6067.1% for AGIs $50k-75k, 8736.7% for AGIs $75k-100k, 15138.6% for AGIs $100k-200k, 72532.5% for AGIs over 200k)
Taxable interest for individuals: $1,920 (reported on 39.2% of returns)
This zip code:
$1,920
Indiana:
$1,351
(% of AGI for various income ranges: 30.0% for AGIs below $25k, 26.5% for AGIs $25k-50k, 57.9% for AGIs $50k-75k, 62.2% for AGIs $75k-100k, 207.6% for AGIs $100k-200k, 1707.5% for AGIs over 200k)
Ordinary dividends: $9,675 (reported on 24.9% of returns)
Here:
$9,675
State:
$5,827
(% of AGI for various income ranges: 46.1% for AGIs below $25k, 39.4% for AGIs $25k-50k, 126.2% for AGIs $50k-75k, 168.3% for AGIs $75k-100k, 422.4% for AGIs $100k-200k, 8072.5% for AGIs over 200k)
Net capital gain/loss in AGI: +$21,445 (reported on 23.4% of returns)
Here:
+$21,445
State:
+$17,730
(% of AGI for various income ranges: 8.2% for AGIs below $25k, 13.2% for AGIs $25k-50k, 118.3% for AGIs $50k-75k, 250.6% for AGIs $75k-100k, 840.0% for AGIs $100k-200k, 19832.5% for AGIs over 200k)
Profit/loss from business: +$15,083 (reported on 14.4% of returns)
Here:
+$15,083
State:
+$12,144
(% of AGI for various income ranges: 86.3% for AGIs below $25k, 71.8% for AGIs $25k-50k, 220.4% for AGIs $50k-75k, 340.6% for AGIs $75k-100k, 447.1% for AGIs $100k-200k, 4680.0% for AGIs over 200k)
Taxable individual retirement arrangement distribution: $22,381 (reported on 14.8% of returns)
46538:
$22,381
Indiana:
$18,302
(% of AGI for various income ranges: 109.5% for AGIs below $25k, 140.6% for AGIs $25k-50k, 412.5% for AGIs $50k-75k, 413.9% for AGIs $75k-100k, 1323.8% for AGIs $100k-200k, 3822.5% for AGIs over 200k)
Total itemized deductions: $39,600 (reported on 6.7% of returns)
Here:
$39,600
State:
$35,601
(% of AGI for various income ranges: 405.4% for AGIs $50k-75k, 792.9% for AGIs $100k-200k, 7265.0% for AGIs over 200k)
Charity contributions: $16,367 (reported on 5.7% of returns)
Here:
$16,367
State:
$15,596
(% of AGI for various income ranges: 49.2% for AGIs $50k-75k, 194.3% for AGIs $100k-200k, 3595.0% for AGIs over 200k)
Taxes paid: $8,280 (reported on 7.2% of returns)
46538:
$8,280
State:
$7,542
(% of AGI for various income ranges: 72.5% for AGIs $50k-75k, 206.7% for AGIs $100k-200k, 1585.0% for AGIs over 200k)
Earned income credit: $2,400 (reported on 10.5% of returns)
Here:
$2,400
State:
$2,298
(% of AGI for various income ranges: 80.3% for AGIs below $25k, 65.6% for AGIs $25k-50k)
Percentage of individuals using paid preparers for their 2020 taxes: 95.2%
Here:
95%
State:
94%
(% for various income ranges: 91.5% for AGIs below $25k, 95.3% for AGIs $25k-50k, 97.1% for AGIs $50k-75k, 100.0% for AGIs $75k-100k, 94.3% for AGIs $100k-200k, 100.0% for AGIs over 200k)
Averages for the 2012 tax year for zip code 46538, filed in 2013:
Average Adjusted Gross Income (AGI) in 2012: $65,548 (Individual Income Tax Returns)
Here:
$65,548
State:
$52,932
Salary/wage: $51,799 (reported on 80.4% of returns)
Here:
$51,799
State:
$45,173
(% of AGI for various income ranges: 67.0% for AGIs below $25k, 79.5% for AGIs $25k-50k, 73.5% for AGIs $50k-75k, 74.1% for AGIs $75k-100k, 70.6% for AGIs $100k-200k, 41.3% for AGIs over 200k)
Taxable interest for individuals: $1,833 (reported on 41.2% of returns)
This zip code:
$1,833
Indiana:
$1,311
(% of AGI for various income ranges: 1.5% for AGIs below $25k, 0.7% for AGIs $25k-50k, 1.1% for AGIs $50k-75k, 1.1% for AGIs $75k-100k, 1.0% for AGIs $100k-200k, 1.4% for AGIs over 200k)
Ordinary dividends: $4,620 (reported on 25.1% of returns)
Here:
$4,620
State:
$4,690
(% of AGI for various income ranges: 1.9% for AGIs below $25k, 0.9% for AGIs $25k-50k, 1.3% for AGIs $50k-75k, 0.7% for AGIs $75k-100k, 2.1% for AGIs $100k-200k, 2.6% for AGIs over 200k)
Net capital gain/loss in AGI: +$11,795 (reported on 19.1% of returns)
Here:
+$11,795
State:
+$10,406
(% of AGI for various income ranges: 0.6% for AGIs $25k-50k, 1.2% for AGIs $75k-100k, 2.2% for AGIs $100k-200k, 9.2% for AGIs over 200k)
Profit/loss from business: +$15,545 (reported on 14.6% of returns)
Here:
+$15,545
State:
+$11,105
(% of AGI for various income ranges: 6.3% for AGIs below $25k, 1.8% for AGIs $25k-50k, 2.7% for AGIs $50k-75k, 1.2% for AGIs $75k-100k, 3.6% for AGIs $100k-200k, 4.8% for AGIs over 200k)
Taxable individual retirement arrangement distribution: $16,031 (reported on 14.6% of returns)
46538:
$16,031
Indiana:
$13,841
(% of AGI for various income ranges: 7.3% for AGIs below $25k, 3.4% for AGIs $25k-50k, 4.2% for AGIs $50k-75k, 4.6% for AGIs $75k-100k, 6.2% for AGIs $100k-200k)
Total itemized deductions: $24,588 (18% of AGI, reported on 29.1% of returns)
Here:
$24,588
State:
$20,913
Here:
18.0% of AGI
State:
18.2% of AGI
(% of AGI for various income ranges: 10.6% for AGIs below $25k, 6.5% for AGIs $25k-50k, 8.9% for AGIs $50k-75k, 11.0% for AGIs $75k-100k, 12.5% for AGIs $100k-200k, 12.6% for AGIs over 200k)
Charity contributions: $4,657 (reported on 23.6% of returns)
Here:
$4,657
State:
$4,697
(% of AGI for various income ranges: 1.0% for AGIs below $25k, 1.1% for AGIs $25k-50k, 1.6% for AGIs $50k-75k, 1.1% for AGIs $75k-100k, 2.5% for AGIs $100k-200k, 1.7% for AGIs over 200k)
Taxes paid: $8,021 (reported on 29.1% of returns)
46538:
$8,021
State:
$7,456
(% of AGI for various income ranges: 1.7% for AGIs below $25k, 1.4% for AGIs $25k-50k, 2.4% for AGIs $50k-75k, 3.0% for AGIs $75k-100k, 4.2% for AGIs $100k-200k, 5.2% for AGIs over 200k)
Earned income credit: $1,831 (reported on 13.1% of returns)
Here:
$1,831
State:
$2,265
(% of AGI for various income ranges: 4.1% for AGIs below $25k, 0.9% for AGIs $25k-50k)
Percentage of individuals using paid preparers for their 2012 taxes: 59.3%
Here:
59%
State:
53%
(% for various income ranges: 52.1% for AGIs below $25k, 58.1% for AGIs $25k-50k, 61.3% for AGIs $50k-75k, 66.7% for AGIs $75k-100k, 65.2% for AGIs $100k-200k, 87.5% for AGIs over 200k)
Averages for the 2004 tax year for zip code 46538, filed in 2005:
Average Adjusted Gross Income (AGI) in 2004: $54,272 (Individual Income Tax Returns)
Here:
$54,272
State:
$44,790
Salary/wage: $45,405 (reported on 83.5% of returns)
Here:
$45,405
State:
$39,615
(% of AGI for various income ranges: 106.4% for AGIs below $10k, 69.6% for AGIs $10k-25k, 81.0% for AGIs $25k-50k, 78.5% for AGIs $50k-75k, 79.6% for AGIs $75k-100k, 56.0% for AGIs over 100k)
Taxable interest for individuals: $2,278 (reported on 49.1% of returns)
This zip code:
$2,278
Indiana:
$1,535
(% of AGI for various income ranges: 10.2% for AGIs below $10k, 3.3% for AGIs $10k-25k, 1.6% for AGIs $25k-50k, 1.4% for AGIs $50k-75k, 1.4% for AGIs $75k-100k, 2.5% for AGIs over 100k)
Taxable dividends: $2,654 (reported on 31.3% of returns)
Here:
$2,654
State:
$2,998
(% of AGI for various income ranges: 4.2% for AGIs below $10k, 2.8% for AGIs $10k-25k, 0.9% for AGIs $25k-50k, 1.5% for AGIs $50k-75k, 1.1% for AGIs $75k-100k, 1.7% for AGIs over 100k)
Net capital gain/loss: +$9,100 (reported on 24.0% of returns)
Here:
+$9,100
State:
+$8,619
(% of AGI for various income ranges: -2.6% for AGIs below $10k, -0.3% for AGIs $10k-25k, 1.3% for AGIs $25k-50k, 1.6% for AGIs $50k-75k, 1.6% for AGIs $75k-100k, 8.1% for AGIs over 100k)
Profit/loss from business: +$15,759 (reported on 15.9% of returns)
Here:
+$15,759
State:
+$10,071
(% of AGI for various income ranges: 8.4% for AGIs below $10k, 3.3% for AGIs $10k-25k, 2.5% for AGIs $25k-50k, 2.5% for AGIs $50k-75k, 4.9% for AGIs $75k-100k, 6.5% for AGIs over 100k)
IRA payment deduction: $3,800 (reported on 2.5% of returns)
46538:
$3,800
Indiana:
$2,840
Self-employed pension: $14,500 (reported on 0.7% of returns)
Here:
$14,500
Indiana:
$15,305
Total itemized deductions: $18,311 (18% of AGI, reported on 35.0% of returns)
Here:
$18,311
State:
$17,065
Here:
18.3% of AGI
State:
19.5% of AGI
(% of AGI for various income ranges: 14.8% for AGIs below $10k, 11.9% for AGIs $10k-25k, 10.0% for AGIs $25k-50k, 10.9% for AGIs $50k-75k, 14.1% for AGIs $75k-100k, 12.0% for AGIs over 100k)
Charity contributions deductions: $3,182 (3% of AGI, reported on 28.7% of returns)
Here:
$3,182
State:
$3,550
Here:
2.9% of AGI
State:
3.8% of AGI
(% of AGI for various income ranges: 1.4% for AGIs $10k-25k, 1.1% for AGIs $25k-50k, 1.6% for AGIs $50k-75k, 2.5% for AGIs $75k-100k, 1.7% for AGIs over 100k)
Total tax: $8,515 (reported on 79.3% of returns)
46538:
$8,515
State:
$6,914
(% of AGI for various income ranges: 3.0% for AGIs below $10k, 3.9% for AGIs $10k-25k, 7.1% for AGIs $25k-50k, 8.9% for AGIs $50k-75k, 10.4% for AGIs $75k-100k, 18.7% for AGIs over 100k)
Earned income credit: $1,593 (reported on 8.3% of returns)
Here:
$1,593
State:
$1,685
Percentage of individuals using paid preparers for their 2004 taxes: 66.5%
Here:
66%
State:
59%
(% for various income ranges: 52.4% for AGIs below $10k, 67.3% for AGIs $10k-25k, 67.8% for AGIs $25k-50k, 72.4% for AGIs $50k-75k, 65.2% for AGIs $75k-100k, 78.2% for AGIs over 100k)
Likely homosexual households (counted as self-reported same-sex unmarried-partner households)
Lesbian couples: 0.4% of all households
Gay men: 0.0% of all households
Household received Food Stamps/SNAP in the past 12 months: 81 Household did not receive Food Stamps/SNAP in the past 12 months: 1,575
Women who had a birth in the past 12 months: 32 (12 now married, 18 unmarried) Women who did not have a birth in the past 12 months: 764 (528 now married, 239 unmarried)
Housing units in zip code 46538 with a mortgage: 762 (132 second mortgage, 116 both second mortgage and home equity loan) Houses without a mortgage: 33
Median monthly owner costs for units with a mortgage: $1,341 Median monthly owner costs for units without a mortgage: $482
Residents with income below the poverty level in 2022:
This zip code:
3.5%
Whole state:
12.6%
Residents with income below 50% of the poverty level in 2022:
This zip code:
2.3%
Whole state:
6.3%
Median number of rooms in houses and condos:
Here:
7.0
State:
6.6
Median number of rooms in apartments:
Here:
4.8
State:
4.3
Notable locations in this zip code not listed on our city pages
Notable locations in zip code 46538: Tippecanoe Country Club (A), Miller Hog Farm (B), Plain Township Leesburg Volunteer Fire Department (C). Display/hide their locations on the map
Lakes and reservoirs: Stanton Lake (A), Kuhn Lake (B), Heron Lake (C), Sawmill Lake (D), Banning Lake (E), James Lake (F), Shoe Lake (G), Tippecanoe Lake (H). Display/hide their locations on the map
Size of family households: 631 2-persons, 170 3-persons, 241 4-persons, 109 5-persons, 42 6-persons, 49 7-or-more-persons
Size of nonfamily households: 279 1-person, 116 2-persons, 14 3-persons
890 married couples with children.
191 single-parent households (73 men, 118 women).
90.4% of residents of 46538 zip code speak English at home.
4.4% of residents speak Spanish at home (53% very well, 41% well, 6% not well).
4.7% of residents speak other Indo-European language at home (70% very well, 15% well, 15% not well).
0.4% of residents speak Asian or Pacific Island language at home (50% very well, 6% not well, 44% not at all).
0.1% of residents speak other language at home (100% very well).
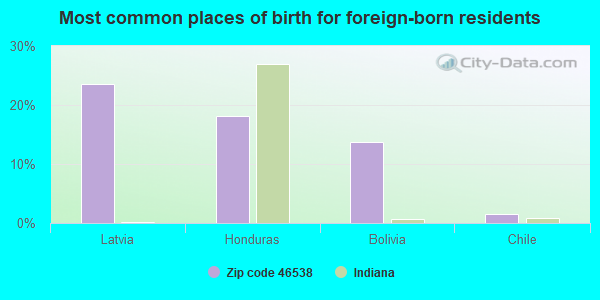
Foreign born population: 204 (4.5%) (44.8% of them are naturalized citizens)
This zip code:
4.5%
Whole state:
6.1%
24%Latvia
18%Honduras
14%Bolivia
1%Chile
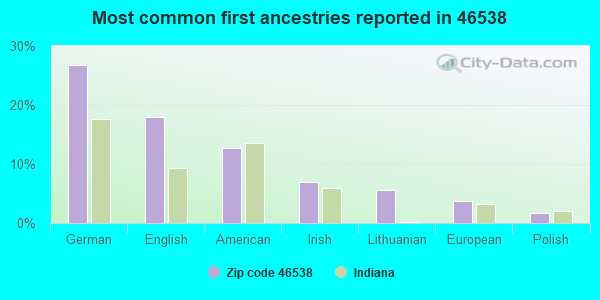
27%German
18%English
13%American
7%Irish
6%Lithuanian
4%European
2%Polish
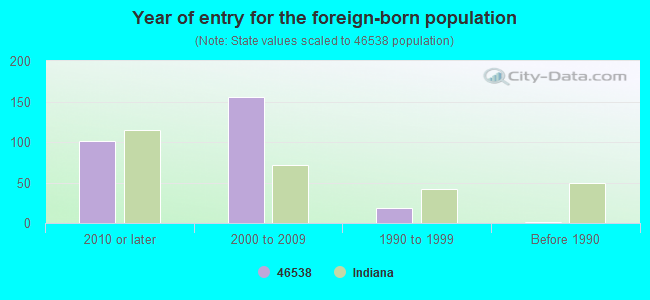
Year of entry for the foreign-born population
1012010 or later
1562000 to 2009
191990 to 1999
1Before 1990
Facilities with environmental interests located in this zip code:
GTI CORPORATION CIRCUITS DIVISION (300 SCHOOL STREET in LEESBURG, IN)
STATE MASTER (Indiana facility tracking) - ACES-OP-08500070, AIR PROGRAM, CRTK-21447, EPCRA, CRTK-764, Conditionally Exempt Small Quantity Generators, less than 100 kg/month of hazardous waste (Resource Conservation and Recovery Act (tracking hazardous waste)) TSD (Resource Conservation and Recovery Act (tracking hazardous waste)) TRI REPORTER (Tracking of toxic chemicals releasing facilities) Business SIC classification: PRINTED CIRCUIT BOARDS Organizations: FRONTLINE MFG INC (CONTACT/OPERATOR)
PHEND & BROWN INC. (76 WEST 600 NORTH in LEESBURG, IN)
AIR SYNTHETIC MINOR (AIRS/AFS) STATE MASTER (Indiana facility tracking) - ACES-OP-08503171, AIR PROGRAM, UST-12476, UNDERGROUND STORAGE TANK PROGRAM Business SIC classification: ASPHALT PAVING MIXTURES AND BLOCKS
PHEND & BROWN LEESBURG HMA PLT (67 W CR 600 N in LEESBURG, IN)
STATE MASTER (Indiana facility tracking) (Resource Conservation and Recovery Act (tracking hazardous waste)) Organizations: PHEND & BROWN INC (CONTACT/OWNER)
Housing units lacking complete plumbing facilities: 1.3% Housing units lacking complete kitchen facilities: 2.3%
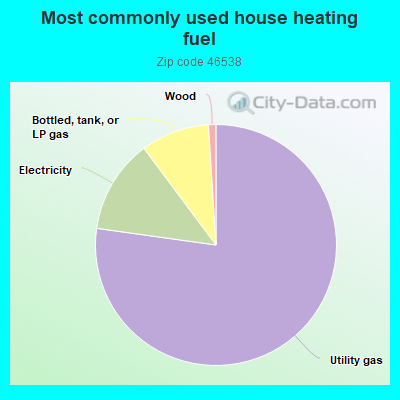
77.3%Utility gas
12.6%Electricity
9.2%Bottled, tank, or LP gas
1.0%Wood
Population in 1990: 1,823. Population change in the 1990s: +2,434 (+133.5%).
Place of birth for U.S.-born residents:
This state: 3,300
Northeast: 56
Midwest: 631
South: 174
West: 87
65% of the 46538 zip code residents lived in the same house 5 years ago. Out of people who lived in different houses, 62% lived in this county. Out of people who lived in different counties, 50% lived in Indiana.
94% of the 46538 zip code residents lived in the same house 1 year ago. Out of people who lived in different houses, 24% moved from this county. Out of people who lived in different houses, 59% moved from different county within same state. Out of people who lived in different houses, 22% moved from different state. Out of people who lived in different houses, 1% moved from abroad.
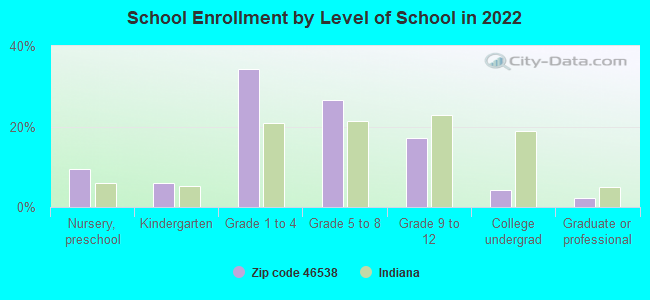
Private vs. public school enrollment:
Students in private schools in grades 1 to 8 (elementary and middle school): 36
Here:
5.5%
Indiana:
14.9%
Students in private schools in grades 9 to 12 (high school): 4
Here:
2.6%
Indiana:
11.4%
Students in private undergraduate colleges: 5
Here:
12.0%
Indiana:
22.3%
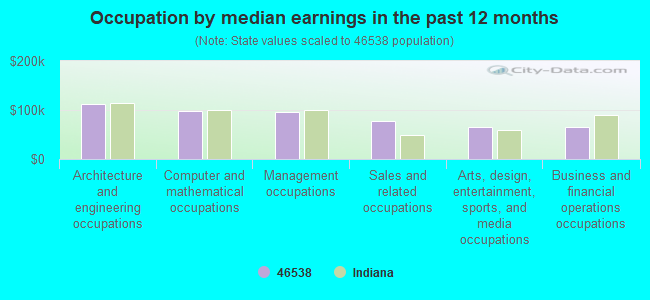
Occupation by median earnings in the past 12 months ($)
111,345Architecture and engineering occupations
98,739Computer and mathematical occupations
94,916Management occupations
77,571Sales and related occupations
64,936Arts, design, entertainment, sports, and media occupations
64,575Business and financial operations occupations
Top industries in this zip code by the number of employees in 2005:
Other Services (except Public Administration): Other Electronic and Precision Equipment Repair and Maintenance (50-99 employees: 1 establishment)
Construction: Other Heavy and Civil Engineering Construction (20-49: 1, 5-9: 1)
Arts, Entertainment, and Recreation: Golf Courses and Country Clubs (20-49: 1, 1-4: 1)
Wholesale Trade: Farm and Garden Machinery and Equipment Merchant Wholesalers (10-19: 2)
Accommodation and Food Services: Full-Service Restaurants (10-19: 1, 5-9: 1)
Fatal accident statistics in 2013:
Fatal accident count: 1
Vehicles involved in fatal accidents: 1
Fatal accidents caused by drunken drivers: 0
Fatalities: 1
Persons involved in fatal accidents: 2
Pedestrians involved in fatal accidents: 0
Fatal accident statistics in 2012:
Fatal accident count: 2
Vehicles involved in fatal accidents: 2
Fatal accidents caused by drunken drivers: 1
Fatalities: 2
Persons involved in fatal accidents: 2
Pedestrians involved in fatal accidents: 0
2002 - 2018 National Fire Incident Reporting System (NFIRS) incidents
According to the data from the years 2002 - 2018 the average number of fire incidents per year is 10. The highest number of reported fire incidents - 42 took place in 2008, and the least - 1 in 2014. The data has a decreasing trend.
When looking into fire subcategories, the most incidents belonged to: Structure Fires (46.5%), and Outside Fires (43.6%).
Fire incident types reported to NFIRS in Zip Code 46538
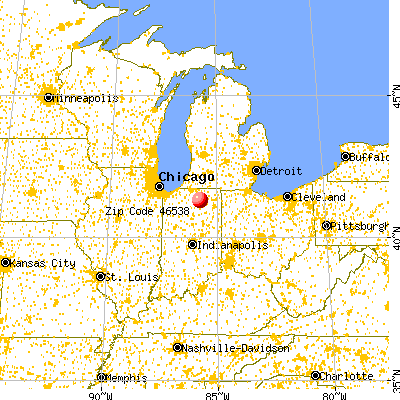


 Nearest zip codes: 46582, 46542, 46590, 46567, 46580, 46555.


 According to the data from the years 2002 - 2018 the average number of fire incidents per year is 10. The highest number of reported fire incidents - 42 took place in 2008, and the least - 1 in 2014. The data has a decreasing trend.
 When looking into fire subcategories, the most incidents belonged to: Structure Fires (46.5%), and Outside Fires (43.6%).