Estimated zip code population in 2022: 19,640 Zip code population in 2010: 18,116 Zip code population in 2000: 17,490
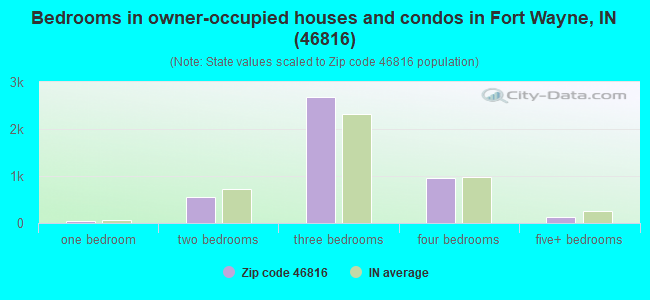
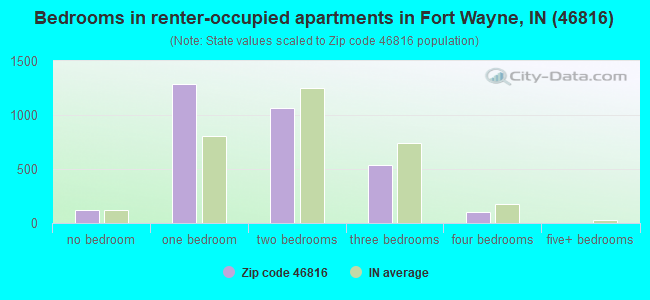
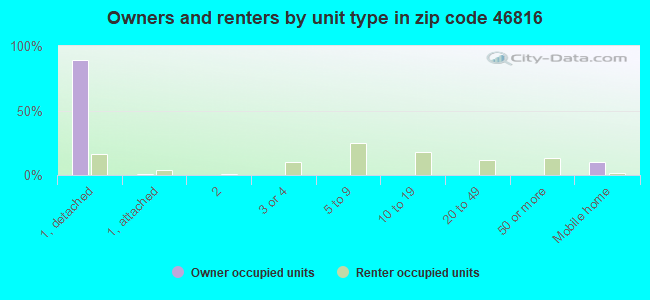
Houses and condos: 8,345 Renter-occupied apartments: 3,086
% of renters here:
41%
State:
29%
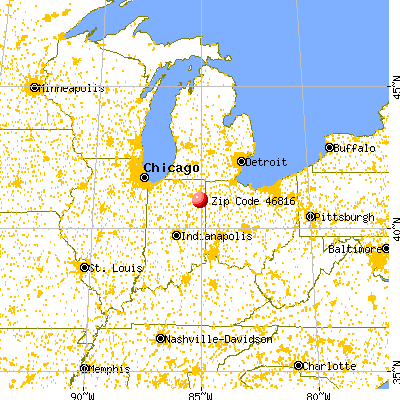
March 2022 cost of living index in zip code 46816: 82.7 (low, U.S. average is 100)
Land area: 36.5 sq. mi. Water area: 0.1 sq. mi.
Population density: 538 people per square mile
(low).
OSM Map
General Map
Google Map
MSN Map
OSM Map
General Map
Google Map
MSN Map
OSM Map
General Map
Google Map
MSN Map
OSM Map
General Map
Google Map
MSN Map
Please wait while loading the map...
Real estate property taxes paid for housing units in 2022:
This zip code:
0.7% ($929)
Indiana:
0.7% ($1,467)
Median real estate property taxes paid for housing units with mortgages in 2022: $963 (0.7%) Median real estate property taxes paid for housing units with no mortgage in 2022: $882 (0.8%)
Business Search- 14 Million verified businesses
Males: 9,035
(46.0%)
Females: 10,604
(54.0%)
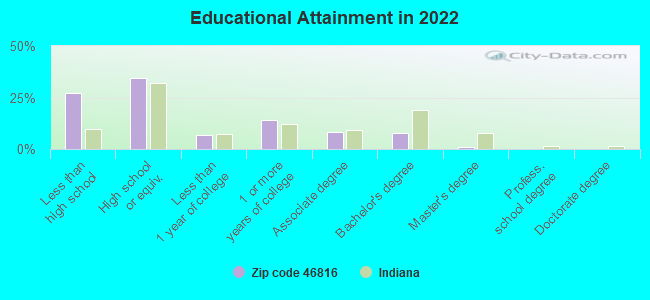
For population 25 years and over in 46816:
High school or higher: 72.3%
Bachelor's degree or higher: 8.8%
Graduate or professional degree: 1.2%
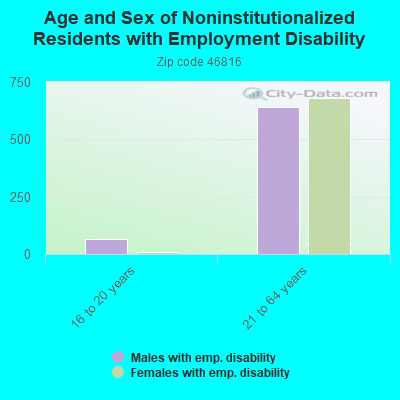
Unemployed: 5.0%
Mean travel time to work (commute): 23.3 minutes
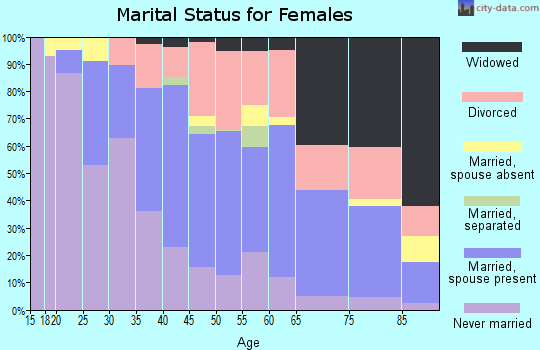
For population 15 years and over in 46816:
Never married: 38.0%
Now married: 41.1%
Separated: 2.1%
Widowed: 7.4%
Divorced: 11.4%
Zip code 46816 compared to state average:
Median household income below state average.
Median house value below state average.
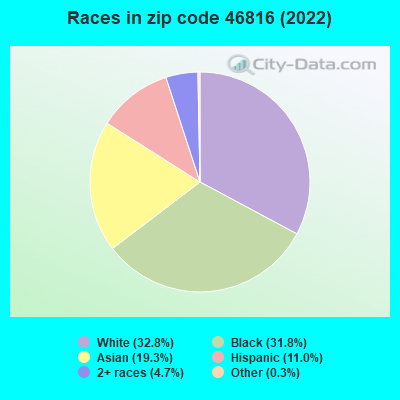
Black race population percentage significantly above state average.
Median age below state average.
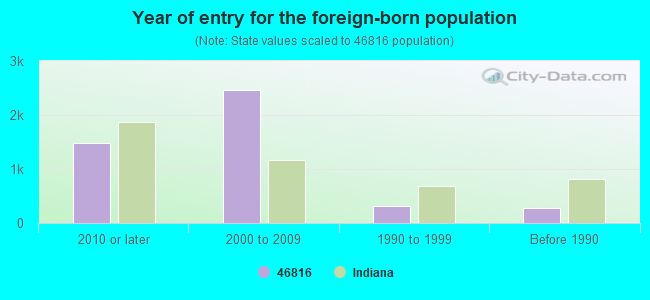
Foreign-born population percentage significantly above state average.
Length of stay since moving in significantly above state average.
Percentage of population with a bachelor's degree or higher significantly below state average.
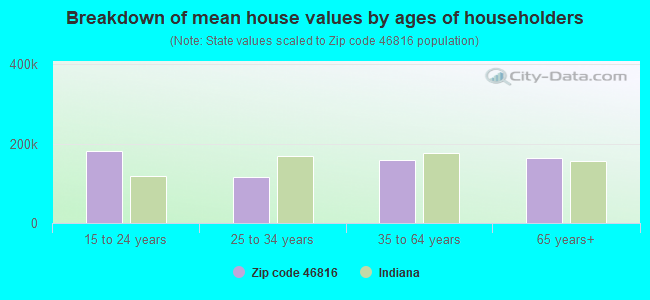
Estimated median house/condo value in 2022: $128,107
46816:
$128,107
Indiana:
$208,700
According to our research of Indiana and other state lists, there were 3 registered sex offenders living in 46816 zip code as of April 27, 2024. The ratio of all residents to sex offenders in zip code 46816 is 6,237 to 1. The ratio of registered sex offenders to all residents in this zip code is much lower than the state average.
Median resident age:
This zip code:
33.7 years
Indiana median age:
38.2 years
Average household size:
This zip code:
2.6 people
Indiana:
2.4 people
Averages for the 2020 tax year for zip code 46816, filed in 2021:
Average Adjusted Gross Income (AGI) in 2020: $37,698 (Individual Income Tax Returns)
Here:
$37,698
State:
$64,978
Salary/wage: $34,210 (reported on 86.5% of returns)
Here:
$34,210
State:
$55,245
(% of AGI for various income ranges: 1188.9% for AGIs below $25k, 3683.2% for AGIs $25k-50k, 6439.7% for AGIs $50k-75k, 9567.5% for AGIs $75k-100k, 15088.1% for AGIs $100k-200k)
Taxable interest for individuals: $706 (reported on 14.8% of returns)
This zip code:
$706
Indiana:
$1,351
(% of AGI for various income ranges: 5.1% for AGIs below $25k, 5.9% for AGIs $25k-50k, 20.9% for AGIs $50k-75k, 30.9% for AGIs $75k-100k, 68.8% for AGIs $100k-200k)
Ordinary dividends: $2,675 (reported on 7.6% of returns)
Here:
$2,675
State:
$5,827
(% of AGI for various income ranges: 7.1% for AGIs below $25k, 11.8% for AGIs $25k-50k, 41.4% for AGIs $50k-75k, 50.3% for AGIs $75k-100k, 189.2% for AGIs $100k-200k)
Net capital gain/loss in AGI: +$6,513 (reported on 6.4% of returns)
Here:
+$6,513
State:
+$17,730
(% of AGI for various income ranges: 3.4% for AGIs below $25k, 10.8% for AGIs $25k-50k, 44.9% for AGIs $50k-75k, 88.1% for AGIs $75k-100k, 343.8% for AGIs $100k-200k)
Profit/loss from business: +$4,727 (reported on 11.3% of returns)
Here:
+$4,727
State:
+$12,144
(% of AGI for various income ranges: 52.2% for AGIs below $25k, 25.3% for AGIs $25k-50k, 103.0% for AGIs $50k-75k, 199.7% for AGIs $75k-100k, 371.5% for AGIs $100k-200k)
Taxable individual retirement arrangement distribution: $13,876 (reported on 5.8% of returns)
46816:
$13,876
Indiana:
$18,302
(% of AGI for various income ranges: 32.2% for AGIs below $25k, 47.5% for AGIs $25k-50k, 142.8% for AGIs $50k-75k, 316.6% for AGIs $75k-100k, 1033.5% for AGIs $100k-200k)
Total itemized deductions: $30,775 (reported on 1.9% of returns)
Here:
$30,775
State:
$35,601
(% of AGI for various income ranges: 65.9% for AGIs $25k-50k, 185.0% for AGIs $50k-75k, 714.2% for AGIs $100k-200k)
Charity contributions: $9,760 (reported on 1.7% of returns)
Here:
$9,760
State:
$15,596
(% of AGI for various income ranges: 14.4% for AGIs $25k-50k, 57.1% for AGIs $50k-75k, 253.5% for AGIs $100k-200k)
Taxes paid: $5,800 (reported on 1.9% of returns)
46816:
$5,800
State:
$7,542
(% of AGI for various income ranges: 8.3% for AGIs $25k-50k, 33.2% for AGIs $50k-75k, 177.7% for AGIs $100k-200k)
Earned income credit: $2,644 (reported on 30.7% of returns)
Here:
$2,644
State:
$2,298
(% of AGI for various income ranges: 138.5% for AGIs below $25k, 118.4% for AGIs $25k-50k, 3.4% for AGIs $50k-75k)
Percentage of individuals using paid preparers for their 2020 taxes: 93.7%
Here:
94%
State:
94%
(% for various income ranges: 93.1% for AGIs below $25k, 95.5% for AGIs $25k-50k, 92.4% for AGIs $50k-75k, 91.3% for AGIs $75k-100k, 92.7% for AGIs $100k-200k, 100.0% for AGIs over 200k)
Averages for the 2012 tax year for zip code 46816, filed in 2013:
Average Adjusted Gross Income (AGI) in 2012: $31,938 (Individual Income Tax Returns)
Here:
$31,938
State:
$52,932
Salary/wage: $29,476 (reported on 84.7% of returns)
Here:
$29,476
State:
$45,173
(% of AGI for various income ranges: 76.0% for AGIs below $25k, 83.9% for AGIs $25k-50k, 79.4% for AGIs $50k-75k, 79.5% for AGIs $75k-100k, 75.3% for AGIs $100k-200k, 48.7% for AGIs over 200k)
Taxable interest for individuals: $882 (reported on 19.6% of returns)
This zip code:
$882
Indiana:
$1,311
(% of AGI for various income ranges: 0.7% for AGIs below $25k, 0.4% for AGIs $25k-50k, 0.5% for AGIs $50k-75k, 0.6% for AGIs $75k-100k, 0.8% for AGIs $100k-200k, 0.3% for AGIs over 200k)
Ordinary dividends: $2,265 (reported on 10.4% of returns)
Here:
$2,265
State:
$4,690
(% of AGI for various income ranges: 0.9% for AGIs below $25k, 0.7% for AGIs $25k-50k, 0.7% for AGIs $50k-75k, 0.7% for AGIs $75k-100k, 1.0% for AGIs $100k-200k)
Net capital gain/loss in AGI: +$1,190 (reported on 6.3% of returns)
Here:
+$1,190
State:
+$10,406
(% of AGI for various income ranges: 0.3% for AGIs $75k-100k, 1.3% for AGIs $100k-200k)
Profit/loss from business: +$7,035 (reported on 10.8% of returns)
Here:
+$7,035
State:
+$11,105
(% of AGI for various income ranges: 5.9% for AGIs below $25k, 1.1% for AGIs $25k-50k, 1.0% for AGIs $50k-75k, 2.8% for AGIs $75k-100k, 1.5% for AGIs $100k-200k)
Taxable individual retirement arrangement distribution: $11,435 (reported on 7.5% of returns)
46816:
$11,435
Indiana:
$13,841
(% of AGI for various income ranges: 1.9% for AGIs below $25k, 1.7% for AGIs $25k-50k, 2.8% for AGIs $50k-75k, 4.0% for AGIs $75k-100k, 5.2% for AGIs $100k-200k)
Total itemized deductions: $16,902 (24% of AGI, reported on 14.0% of returns)
Here:
$16,902
State:
$20,913
Here:
24.2% of AGI
State:
18.2% of AGI
(% of AGI for various income ranges: 4.6% for AGIs below $25k, 5.9% for AGIs $25k-50k, 7.5% for AGIs $50k-75k, 9.1% for AGIs $75k-100k, 12.5% for AGIs $100k-200k, 9.8% for AGIs over 200k)
Charity contributions: $4,663 (reported on 10.8% of returns)
Here:
$4,663
State:
$4,697
(% of AGI for various income ranges: 0.6% for AGIs below $25k, 1.2% for AGIs $25k-50k, 1.7% for AGIs $50k-75k, 2.1% for AGIs $75k-100k, 3.2% for AGIs $100k-200k, 2.2% for AGIs over 200k)
Taxes paid: $4,182 (reported on 14.0% of returns)
46816:
$4,182
State:
$7,456
(% of AGI for various income ranges: 0.4% for AGIs below $25k, 1.1% for AGIs $25k-50k, 1.8% for AGIs $50k-75k, 2.7% for AGIs $75k-100k, 4.2% for AGIs $100k-200k, 4.2% for AGIs over 200k)
Earned income credit: $2,797 (reported on 34.2% of returns)
Here:
$2,797
State:
$2,265
(% of AGI for various income ranges: 11.2% for AGIs below $25k, 1.9% for AGIs $25k-50k)
Percentage of individuals using paid preparers for their 2012 taxes: 48.1%
Here:
48%
State:
53%
(% for various income ranges: 46.2% for AGIs below $25k, 47.2% for AGIs $25k-50k, 52.7% for AGIs $50k-75k, 53.8% for AGIs $75k-100k, 61.5% for AGIs $100k-200k, 66.7% for AGIs over 200k)
Averages for the 2004 tax year for zip code 46816, filed in 2005:
Average Adjusted Gross Income (AGI) in 2004: $30,691 (Individual Income Tax Returns)
Here:
$30,691
State:
$44,790
Salary/wage: $29,473 (reported on 87.9% of returns)
Here:
$29,473
State:
$39,615
(% of AGI for various income ranges: 96.8% for AGIs below $10k, 80.6% for AGIs $10k-25k, 87.2% for AGIs $25k-50k, 86.4% for AGIs $50k-75k, 88.3% for AGIs $75k-100k, 71.1% for AGIs over 100k)
Taxable interest for individuals: $1,296 (reported on 30.5% of returns)
This zip code:
$1,296
Indiana:
$1,535
(% of AGI for various income ranges: 4.0% for AGIs below $10k, 1.7% for AGIs $10k-25k, 1.2% for AGIs $25k-50k, 0.7% for AGIs $50k-75k, 0.9% for AGIs $75k-100k, 2.0% for AGIs over 100k)
Taxable dividends: $2,116 (reported on 14.1% of returns)
Here:
$2,116
State:
$2,998
(% of AGI for various income ranges: 2.6% for AGIs below $10k, 1.0% for AGIs $10k-25k, 0.8% for AGIs $25k-50k, 0.6% for AGIs $50k-75k, 0.8% for AGIs $75k-100k, 1.9% for AGIs over 100k)
Net capital gain/loss: +$2,656 (reported on 9.5% of returns)
Here:
+$2,656
State:
+$8,619
(% of AGI for various income ranges: -1.0% for AGIs below $10k, 0.2% for AGIs $10k-25k, 0.2% for AGIs $25k-50k, 0.6% for AGIs $50k-75k, 1.0% for AGIs $75k-100k, 4.2% for AGIs over 100k)
Profit/loss from business: +$5,905 (reported on 8.3% of returns)
Here:
+$5,905
State:
+$10,071
(% of AGI for various income ranges: 3.7% for AGIs below $10k, 2.1% for AGIs $10k-25k, 0.7% for AGIs $25k-50k, 1.4% for AGIs $50k-75k, 1.6% for AGIs $75k-100k, 3.2% for AGIs over 100k)
IRA payment deduction: $2,623 (reported on 1.9% of returns)
46816:
$2,623
Indiana:
$2,840
(% of AGI for various income ranges: 0.2% for AGIs $10k-25k, 0.2% for AGIs $25k-50k, 0.2% for AGIs $50k-75k, 0.3% for AGIs $75k-100k)
Total itemized deductions: $14,122 (24% of AGI, reported on 22.0% of returns)
Here:
$14,122
State:
$17,065
Here:
24.2% of AGI
State:
19.5% of AGI
(% of AGI for various income ranges: 7.5% for AGIs below $10k, 5.7% for AGIs $10k-25k, 8.9% for AGIs $25k-50k, 11.1% for AGIs $50k-75k, 13.8% for AGIs $75k-100k, 14.7% for AGIs over 100k)
Charity contributions deductions: $3,551 (6% of AGI, reported on 19.0% of returns)
Here:
$3,551
State:
$3,550
Here:
5.8% of AGI
State:
3.8% of AGI
(% of AGI for various income ranges: 0.8% for AGIs below $10k, 0.9% for AGIs $10k-25k, 1.5% for AGIs $25k-50k, 2.4% for AGIs $50k-75k, 3.4% for AGIs $75k-100k, 4.6% for AGIs over 100k)
Total tax: $3,674 (reported on 63.2% of returns)
46816:
$3,674
State:
$6,914
(% of AGI for various income ranges: 1.3% for AGIs below $10k, 3.1% for AGIs $10k-25k, 6.1% for AGIs $25k-50k, 8.6% for AGIs $50k-75k, 10.2% for AGIs $75k-100k, 14.9% for AGIs over 100k)
Earned income credit: $1,843 (reported on 25.9% of returns)
Here:
$1,843
State:
$1,685
Percentage of individuals using paid preparers for their 2004 taxes: 57.5%
Here:
58%
State:
59%
(% for various income ranges: 53.9% for AGIs below $10k, 60.0% for AGIs $10k-25k, 54.7% for AGIs $25k-50k, 62.8% for AGIs $50k-75k, 57.4% for AGIs $75k-100k, 65.1% for AGIs over 100k)
Household received Food Stamps/SNAP in the past 12 months: 1,767 Household did not receive Food Stamps/SNAP in the past 12 months: 5,730
Women who had a birth in the past 12 months: 391 (159 now married, 208 unmarried) Women who did not have a birth in the past 12 months: 4,413 (1,482 now married, 2,923 unmarried)
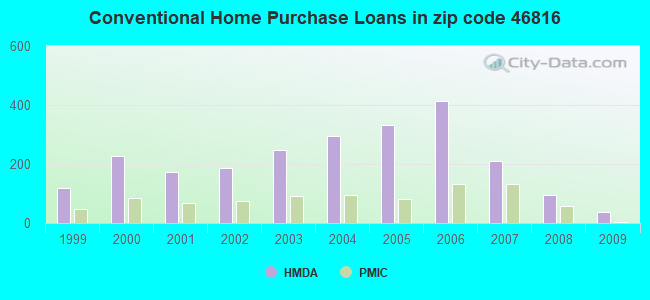
Housing units in zip code 46816 with a mortgage: 2,583 (131 second mortgage, 65 both second mortgage and home equity loan) Houses without a mortgage: 19
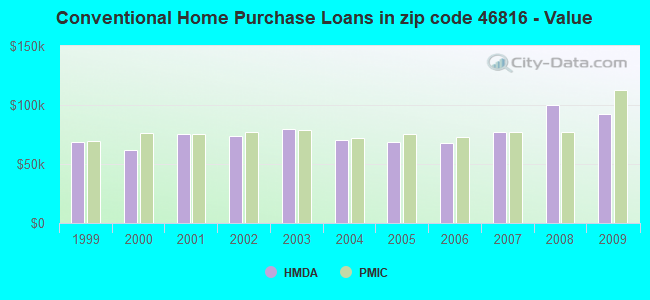
Median monthly owner costs for units with a mortgage: $1,067 Median monthly owner costs for units without a mortgage: $432
Residents with income below the poverty level in 2022:
This zip code:
24.5%
Whole state:
12.6%
Residents with income below 50% of the poverty level in 2022:
This zip code:
15.1%
Whole state:
6.3%
Median number of rooms in houses and condos:
Here:
6.2
State:
6.6
Median number of rooms in apartments:
Here:
3.9
State:
4.3
Notable locations in this zip code not listed on our city pages
In group quarters: 197 (-1 institutionalized population)
Size of family households: 1,463 2-persons, 993 3-persons, 929 4-persons, 708 5-persons, 286 6-persons, 74 7-or-more-persons
Size of nonfamily households: 2,526 1-person, 485 2-persons
2,720 married couples with children.
2,118 single-parent households (401 men, 1,717 women).
71.0% of residents of 46816 zip code speak English at home.
10.5% of residents speak Spanish at home (56% very well, 21% well, 10% not well, 13% not at all).
0.6% of residents speak other Indo-European language at home (100% very well).
15.2% of residents speak Asian or Pacific Island language at home (37% very well, 23% well, 32% not well, 8% not at all).
1.9% of residents speak other language at home (12% very well, 22% well, 66% not well).
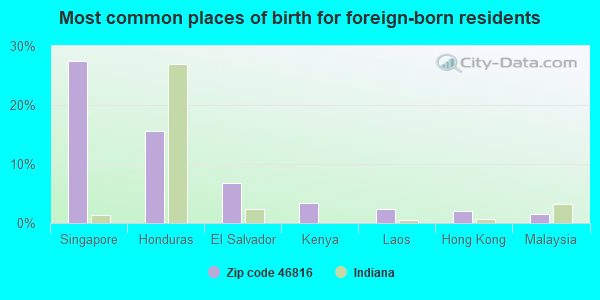
Foreign born population: 4,540 (23.1%) (46.8% of them are naturalized citizens)
Major facilities with environmental interests located in this zip code:
PAUL HARDING HIGH SCHOOL (6501 WAYNE TRACE in FORT WAYNE, IN)
STATE MASTER (Indiana facility tracking) (National Center for Education Statistics) - STATE ID-0279 (Resource Conservation and Recovery Act (tracking hazardous waste)) Organizations: EAST ALLEN CO SCHOOLS (CONTACT/OWNER)
, EAST ALLEN COUNTY SCHOOLS (SCHOOL DISTRICT)
SEARS ROEBUCK & CO 2730 6966 (7800 S ANTHONY BLVD in FT WAYNE, IN)
STATE MASTER (Indiana facility tracking) - UST-15547, UNDERGROUND STORAGE TANK PROGRAM (Resource Conservation and Recovery Act (tracking hazardous waste)) Business NAICS classification: AUTOMOTIVE OIL CHANGE AND LUBRICATION SHOPS. Organizations: SEARS, ROEBUCK AND CO (CONTACT/OPERATOR)
GTE NORTH INC (7033 HESSON RD in FT WAYNE, IN)
STATE MASTER (Indiana facility tracking) - CRTK-4504, EPCRA, LUST-199611026, LEAKING STORAGE TANK, UST-2033, UNDERGROUND STORAGE TANK PROGRAM HAZARDOUS WASTE BIENNIAL REPORTER (Resource Conservation and Recovery Act (tracking hazardous waste)) (Resource Conservation and Recovery Act (tracking hazardous waste)) Alternative names: GENERAL TELEPHONE ELECTRIC CO
MAPLES AG CONCEPTS (8137 FRANKE RD in FORT WAYNE, IN)
ENFORCEMENT/COMPLIANCE ACTIVITY (Integrated Compliance Information System) STATE MASTER (Indiana facility tracking) - CRTK-1169, EPCRA, UST-10682, UNDERGROUND STORAGE TANK PROGRAM COMPLIANCE ACTIVITY (Tracking inspections of insecticide, fungicide, and rodenticide, and toxic substances) Conditionally Exempt Small Quantity Generators, less than 100 kg/month of hazardous waste (Resource Conservation and Recovery Act (tracking hazardous waste)) Alternative names: EMP COOP INC DBA MAPLES AG, SOHIGRO SERVICE CO
GTE FORT WAYNE (3301 WAYNE TRACE in FORT WAYNE, IN)
STATE MASTER (Indiana facility tracking) - CRTK-7236, EPCRA, UST-2079, UNDERGROUND STORAGE TANK PROGRAM Conditionally Exempt Small Quantity Generators, less than 100 kg/month of hazardous waste (Resource Conservation and Recovery Act (tracking hazardous waste)) - notification Organizations: VERIZON NORTH INC (CONTACT/OWNER)
Alternative names: GENERAL TELEPHONE CO OF INDIANA INC, VERIZON NORTH INC - WAYNE TRACE
GTE NORTH INC (8110 S ANTHONY BLVD in FORT WAYNE, IN)
STATE MASTER (Indiana facility tracking) - CRTK-7237, EPCRA, LUST-198801032, LEAKING STORAGE TANK, LUST-199208523, SPILL-199004089, RELEASE ASSESSMENT, UST-2034, UNDERGROUND STORAGE TANK PROGRAM Conditionally Exempt Small Quantity Generators, less than 100 kg/month of hazardous waste (Resource Conservation and Recovery Act (tracking hazardous waste)) - notification Organizations: VERIZON NORTH INC (CONTACT/OWNER)
Alternative names: VERIZON NORTH INC FT WAYNE SE
BEN F GEYER MIDDLE SCHOOL (420 E PAULDING RD in FORT WAYNE, IN)
(Geographic Names Information System) (National Center for Education Statistics) - STATE ID-0117 Organizations: FORT WAYNE COMMUNITY SCHOOLS (SCHOOL DISTRICT)
CLARK OIL #1821 (7230 ANTHONY BLVD in FORT WAYNE, IN)
STATE MASTER (Indiana facility tracking) - CRTK-8786, EPCRA, UST-2942, UNDERGROUND STORAGE TANK PROGRAM Conditionally Exempt Small Quantity Generators, less than 100 kg/month of hazardous waste (Resource Conservation and Recovery Act (tracking hazardous waste)) - notification Organizations: CLARK RETAIL ENTERPRISES INC (CONTACT/OWNER)
Alternative names: CLARK STORE 1821
PAYLESS CASH INC (7910 S ANTHONY BLVD in FORT WAYNE, IN)
STATE MASTER (Indiana facility tracking) - UST-7723, UNDERGROUND STORAGE TANK PROGRAM Conditionally Exempt Small Quantity Generators, less than 100 kg/month of hazardous waste (Resource Conservation and Recovery Act (tracking hazardous waste)) - notification Organizations: PAYLESS CASHWAYS INC (CONTACT/OWNER)
Alternative names: FURROW BLDG MATERIALS
BLEEKE OIL CO (HARTZELL AND TILLMAN RDS in FORT WAYNE, IN)
STATE MASTER (Indiana facility tracking) TRANSPORTER (Resource Conservation and Recovery Act (tracking hazardous waste)) (Resource Conservation and Recovery Act (tracking hazardous waste)) Organizations: ROY H BLEEKE (CONTACT/OWNER)
PRINCE CHAPMAN ACADEMY (4808 E PAULDING RD in FORT WAYNE, IN)
(National Center for Education Statistics) - STATE ID-0303 Organizations: EAST ALLEN COUNTY SCHOOLS (SCHOOL DISTRICT)
MILL ROAD ESTATES (15001 MILL ROAD in FT WAYNE, IN)
STATE MASTER (Indiana facility tracking) National Pollutant Discharge Elimination System NON-MAJOR (Tracking pollutant discharge elimination systems) - permit COMMUNITY WATER SYSTEM (SDWIS) Business SIC classification: OPERATORS OF RESIDENTIAL MOBILE HOME SITES Organizations: ANNE BUTCHER 12636 (CONTACT/OPERATOR)
Alternative names: MILL ROAD ESTATES MHP (LA00051
RESTORATION AUTO CTR INC (5421 S HANNA in FORT WAYNE, IN)
STATE MASTER (Indiana facility tracking) (Resource Conservation and Recovery Act (tracking hazardous waste)) Organizations: KNIGHT GEORGE (CONTACT/OWNER)
Housing units lacking complete plumbing facilities: 1.3% Housing units lacking complete kitchen facilities: 1.5%
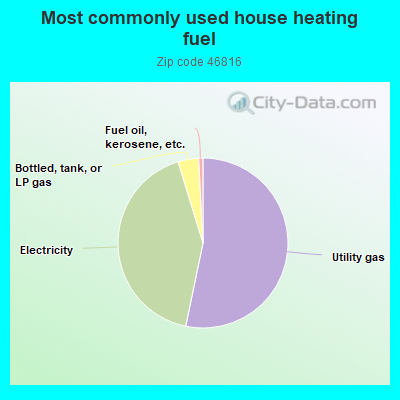
52.9%Utility gas
41.7%Electricity
3.9%Bottled, tank, or LP gas
0.8%Fuel oil, kerosene, etc.
Population in 1990: 15,507. Population change in the 1990s: +1,983 (+12.8%).
Place of birth for U.S.-born residents:
This state: 11,486
Northeast: 249
Midwest: 1,374
South: 1,954
West: 249
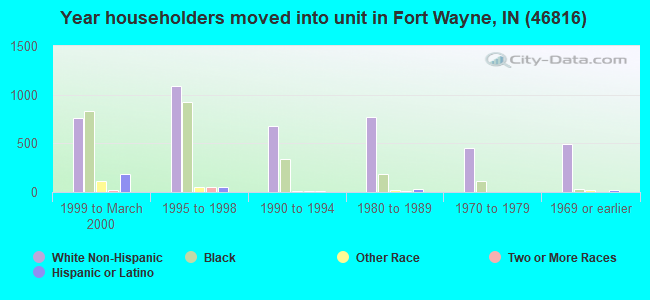
52% of the 46816 zip code residents lived in the same house 5 years ago. Out of people who lived in different houses, 75% lived in this county. Out of people who lived in different counties, 50% lived in Indiana.
91% of the 46816 zip code residents lived in the same house 1 year ago. Out of people who lived in different houses, 79% moved from this county. Out of people who lived in different houses, 7% moved from different county within same state. Out of people who lived in different houses, 14% moved from different state.
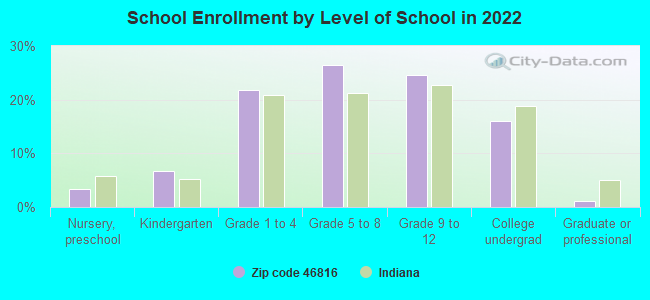
Private vs. public school enrollment:
Students in private schools in grades 1 to 8 (elementary and middle school): 561
Here:
22.5%
Indiana:
14.9%
Students in private schools in grades 9 to 12 (high school): 113
Here:
9.0%
Indiana:
11.4%
Students in private undergraduate colleges: 115
Here:
14.2%
Indiana:
22.3%
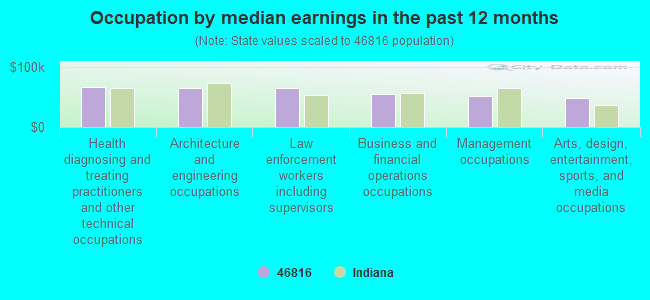
Occupation by median earnings in the past 12 months ($)
65,793Health diagnosing and treating practitioners and other technical occupations
65,261Architecture and engineering occupations
64,366Law enforcement workers including supervisors
54,867Business and financial operations occupations
51,007Management occupations
48,702Arts, design, entertainment, sports, and media occupations
Top industries in this zip code by the number of employees in 2005:
Health Care and Social Assistance: Continuing Care Retirement Communities (250-499 employees: 1 establishment, 20-49 employees: 1 establishment)
2002 - 2018 National Fire Incident Reporting System (NFIRS) incidents
Based on the data from the years 2002 - 2018 the average number of fires per year is 58. The highest number of reported fires - 110 took place in 2005, and the least - 14 in 2003. The data has a rising trend.
When looking into fire subcategories, the most reports belonged to: Structure Fires (55.1%), and Outside Fires (26.3%).
Fire incident types reported to NFIRS in Zip Code 46816


 Nearest zip codes: 46745, 46806, 46803, 46819, 46815, 46774.


 Based on the data from the years 2002 - 2018 the average number of fires per year is 58. The highest number of reported fires - 110 took place in 2005, and the least - 14 in 2003. The data has a rising trend.
 When looking into fire subcategories, the most reports belonged to: Structure Fires (55.1%), and Outside Fires (26.3%).