Estimated zip code population in 2022: 18,274 Zip code population in 2010: 14,533 Zip code population in 2000: 12,045
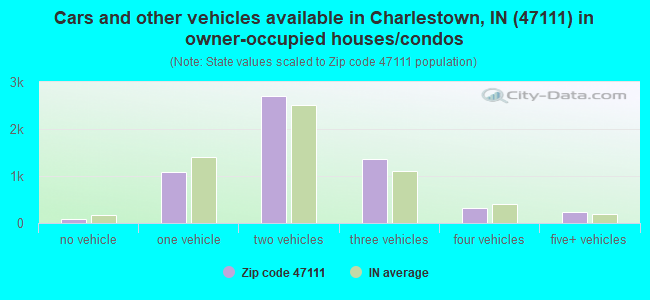
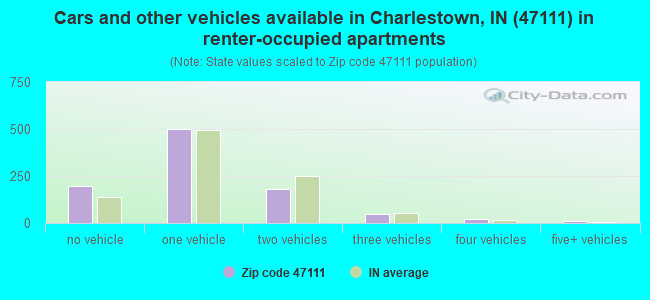
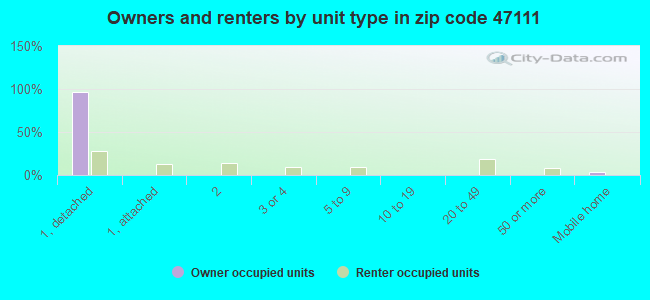
Houses and condos: 7,132 Renter-occupied apartments: 954
% of renters here:
14%
State:
29%
March 2022 cost of living index in zip code 47111: 85.1 (less than average, U.S. average is 100)
Land area: 79.9 sq. mi. Water area: 0.8 sq. mi.
Population density: 229 people per square mile
(very low).
OSM Map
General Map
Google Map
MSN Map
OSM Map
General Map
Google Map
MSN Map
OSM Map
General Map
Google Map
MSN Map
OSM Map
General Map
Google Map
MSN Map
Please wait while loading the map...
Real estate property taxes paid for housing units in 2022:
This zip code:
0.6% ($1,592)
Indiana:
0.7% ($1,467)
Median real estate property taxes paid for housing units with mortgages in 2022: $1,737 (0.6%) Median real estate property taxes paid for housing units with no mortgage in 2022: $1,296 (0.5%)
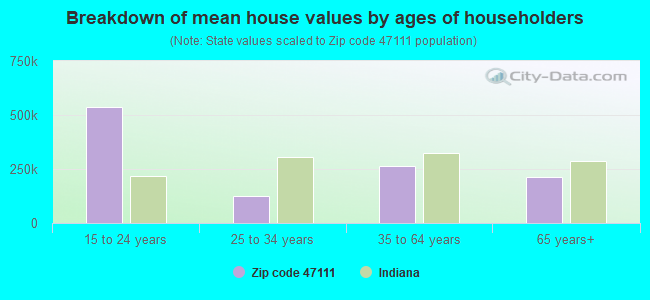
Estimated median house/condo value in 2022: $272,810
47111:
$272,810
Indiana:
$208,700
According to our research of Indiana and other state lists, there were 2 registered sex offenders living in 47111 zip code as of April 26, 2024. The ratio of all residents to sex offenders in zip code 47111 is 7,787 to 1. The ratio of registered sex offenders to all residents in this zip code is much lower than the state average.
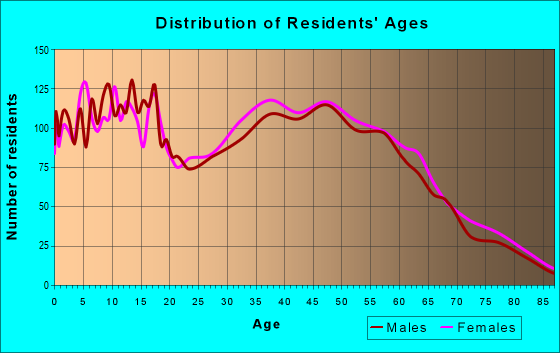
Median resident age:
This zip code:
38.0 years
Indiana median age:
38.2 years
Average household size:
This zip code:
2.7 people
Indiana:
2.4 people
Averages for the 2020 tax year for zip code 47111, filed in 2021:
Average Adjusted Gross Income (AGI) in 2020: $65,490 (Individual Income Tax Returns)
Here:
$65,490
State:
$64,978
Salary/wage: $58,265 (reported on 86.0% of returns)
Here:
$58,265
State:
$55,245
(% of AGI for various income ranges: 1143.5% for AGIs below $25k, 3611.8% for AGIs $25k-50k, 6631.7% for AGIs $50k-75k, 9548.1% for AGIs $75k-100k, 17159.1% for AGIs $100k-200k, 60221.2% for AGIs over 200k)
Taxable interest for individuals: $1,042 (reported on 23.8% of returns)
This zip code:
$1,042
Indiana:
$1,351
(% of AGI for various income ranges: 10.7% for AGIs below $25k, 20.3% for AGIs $25k-50k, 36.9% for AGIs $50k-75k, 36.1% for AGIs $75k-100k, 36.7% for AGIs $100k-200k, 753.8% for AGIs over 200k)
Ordinary dividends: $2,894 (reported on 14.3% of returns)
Here:
$2,894
State:
$5,827
(% of AGI for various income ranges: 16.0% for AGIs below $25k, 20.5% for AGIs $25k-50k, 36.7% for AGIs $50k-75k, 44.3% for AGIs $75k-100k, 148.1% for AGIs $100k-200k, 972.5% for AGIs over 200k)
Net capital gain/loss in AGI: +$9,039 (reported on 13.2% of returns)
Here:
+$9,039
State:
+$17,730
(% of AGI for various income ranges: 13.2% for AGIs below $25k, 19.9% for AGIs $25k-50k, 79.5% for AGIs $50k-75k, 87.0% for AGIs $75k-100k, 397.3% for AGIs $100k-200k, 5392.5% for AGIs over 200k)
Profit/loss from business: +$10,491 (reported on 12.8% of returns)
Here:
+$10,491
State:
+$12,144
(% of AGI for various income ranges: 74.9% for AGIs below $25k, 82.1% for AGIs $25k-50k, 205.5% for AGIs $50k-75k, 219.9% for AGIs $75k-100k, 297.3% for AGIs $100k-200k, 2853.8% for AGIs over 200k)
Taxable individual retirement arrangement distribution: $18,509 (reported on 7.8% of returns)
47111:
$18,509
Indiana:
$18,302
(% of AGI for various income ranges: 55.0% for AGIs below $25k, 80.1% for AGIs $25k-50k, 162.3% for AGIs $50k-75k, 249.7% for AGIs $75k-100k, 559.8% for AGIs $100k-200k, 1606.2% for AGIs over 200k)
Total itemized deductions: $29,452 (reported on 6.2% of returns)
Here:
$29,452
State:
$35,601
(% of AGI for various income ranges: 38.5% for AGIs below $25k, 51.9% for AGIs $25k-50k, 209.3% for AGIs $50k-75k, 313.0% for AGIs $75k-100k, 626.2% for AGIs $100k-200k, 4497.5% for AGIs over 200k)
Charity contributions: $11,507 (reported on 5.0% of returns)
Here:
$11,507
State:
$15,596
(% of AGI for various income ranges: 15.8% for AGIs $25k-50k, 40.4% for AGIs $50k-75k, 77.0% for AGIs $75k-100k, 187.1% for AGIs $100k-200k, 2337.5% for AGIs over 200k)
Taxes paid: $7,542 (reported on 6.2% of returns)
47111:
$7,542
State:
$7,542
(% of AGI for various income ranges: 5.1% for AGIs below $25k, 11.6% for AGIs $25k-50k, 46.1% for AGIs $50k-75k, 96.4% for AGIs $75k-100k, 186.9% for AGIs $100k-200k, 928.8% for AGIs over 200k)
Earned income credit: $2,146 (reported on 13.4% of returns)
Here:
$2,146
State:
$2,298
(% of AGI for various income ranges: 79.9% for AGIs below $25k, 61.1% for AGIs $25k-50k)
Percentage of individuals using paid preparers for their 2020 taxes: 94.4%
Here:
94%
State:
94%
(% for various income ranges: 92.2% for AGIs below $25k, 95.4% for AGIs $25k-50k, 93.9% for AGIs $50k-75k, 95.8% for AGIs $75k-100k, 96.0% for AGIs $100k-200k, 96.0% for AGIs over 200k)
Averages for the 2012 tax year for zip code 47111, filed in 2013:
Average Adjusted Gross Income (AGI) in 2012: $49,899 (Individual Income Tax Returns)
Here:
$49,899
State:
$52,932
Salary/wage: $45,277 (reported on 87.4% of returns)
Here:
$45,277
State:
$45,173
(% of AGI for various income ranges: 76.3% for AGIs below $25k, 81.4% for AGIs $25k-50k, 81.1% for AGIs $50k-75k, 81.5% for AGIs $75k-100k, 82.1% for AGIs $100k-200k, 61.7% for AGIs over 200k)
Taxable interest for individuals: $1,044 (reported on 27.0% of returns)
This zip code:
$1,044
Indiana:
$1,311
(% of AGI for various income ranges: 1.2% for AGIs below $25k, 0.5% for AGIs $25k-50k, 0.5% for AGIs $50k-75k, 0.3% for AGIs $75k-100k, 0.4% for AGIs $100k-200k, 1.0% for AGIs over 200k)
Ordinary dividends: $2,599 (reported on 14.5% of returns)
Here:
$2,599
State:
$4,690
(% of AGI for various income ranges: 0.8% for AGIs below $25k, 0.5% for AGIs $25k-50k, 0.6% for AGIs $50k-75k, 0.5% for AGIs $75k-100k, 0.9% for AGIs $100k-200k, 1.5% for AGIs over 200k)
Net capital gain/loss in AGI: +$3,263 (reported on 11.2% of returns)
Here:
+$3,263
State:
+$10,406
(% of AGI for various income ranges: 0.4% for AGIs $25k-50k, 0.5% for AGIs $50k-75k, 0.4% for AGIs $75k-100k, 1.0% for AGIs $100k-200k, 2.4% for AGIs over 200k)
Profit/loss from business: +$8,301 (reported on 13.2% of returns)
Here:
+$8,301
State:
+$11,105
(% of AGI for various income ranges: 4.4% for AGIs below $25k, 2.5% for AGIs $25k-50k, 1.4% for AGIs $50k-75k, 2.3% for AGIs $75k-100k, 1.7% for AGIs $100k-200k, 2.1% for AGIs over 200k)
Taxable individual retirement arrangement distribution: $12,518 (reported on 8.6% of returns)
47111:
$12,518
Indiana:
$13,841
(% of AGI for various income ranges: 2.3% for AGIs below $25k, 2.2% for AGIs $25k-50k, 1.9% for AGIs $50k-75k, 2.1% for AGIs $75k-100k, 3.0% for AGIs $100k-200k)
Total itemized deductions: $18,944 (20% of AGI, reported on 32.0% of returns)
Here:
$18,944
State:
$20,913
Here:
20.3% of AGI
State:
18.2% of AGI
(% of AGI for various income ranges: 6.3% for AGIs below $25k, 9.1% for AGIs $25k-50k, 11.2% for AGIs $50k-75k, 14.1% for AGIs $75k-100k, 15.3% for AGIs $100k-200k, 12.2% for AGIs over 200k)
Charity contributions: $3,467 (reported on 26.4% of returns)
Here:
$3,467
State:
$4,697
(% of AGI for various income ranges: 0.6% for AGIs below $25k, 1.0% for AGIs $25k-50k, 1.7% for AGIs $50k-75k, 2.0% for AGIs $75k-100k, 2.4% for AGIs $100k-200k, 2.7% for AGIs over 200k)
Taxes paid: $7,161 (reported on 32.0% of returns)
47111:
$7,161
State:
$7,456
(% of AGI for various income ranges: 1.0% for AGIs below $25k, 2.4% for AGIs $25k-50k, 3.6% for AGIs $50k-75k, 5.2% for AGIs $75k-100k, 6.9% for AGIs $100k-200k, 6.1% for AGIs over 200k)
Earned income credit: $2,228 (reported on 18.7% of returns)
Here:
$2,228
State:
$2,265
(% of AGI for various income ranges: 6.6% for AGIs below $25k, 1.2% for AGIs $25k-50k)
Percentage of individuals using paid preparers for their 2012 taxes: 56.0%
Here:
56%
State:
53%
(% for various income ranges: 51.3% for AGIs below $25k, 57.2% for AGIs $25k-50k, 58.6% for AGIs $50k-75k, 60.6% for AGIs $75k-100k, 60.3% for AGIs $100k-200k, 77.8% for AGIs over 200k)
Averages for the 2004 tax year for zip code 47111, filed in 2005:
Average Adjusted Gross Income (AGI) in 2004: $42,896 (Individual Income Tax Returns)
Here:
$42,896
State:
$44,790
Salary/wage: $39,310 (reported on 89.1% of returns)
Here:
$39,310
State:
$39,615
(% of AGI for various income ranges: 117.4% for AGIs below $10k, 80.3% for AGIs $10k-25k, 85.1% for AGIs $25k-50k, 83.2% for AGIs $50k-75k, 86.5% for AGIs $75k-100k, 72.7% for AGIs over 100k)
Taxable interest for individuals: $1,435 (reported on 40.4% of returns)
This zip code:
$1,435
Indiana:
$1,535
(% of AGI for various income ranges: 4.9% for AGIs below $10k, 1.7% for AGIs $10k-25k, 1.1% for AGIs $25k-50k, 1.1% for AGIs $50k-75k, 0.7% for AGIs $75k-100k, 1.9% for AGIs over 100k)
Taxable dividends: $2,149 (reported on 17.4% of returns)
Here:
$2,149
State:
$2,998
(% of AGI for various income ranges: 2.9% for AGIs below $10k, 0.5% for AGIs $10k-25k, 0.5% for AGIs $25k-50k, 0.5% for AGIs $50k-75k, 0.6% for AGIs $75k-100k, 1.6% for AGIs over 100k)
Net capital gain/loss: +$7,148 (reported on 12.8% of returns)
Here:
+$7,148
State:
+$8,619
(% of AGI for various income ranges: -1.1% for AGIs below $10k, 0.3% for AGIs $10k-25k, 0.6% for AGIs $25k-50k, 1.3% for AGIs $50k-75k, 1.3% for AGIs $75k-100k, 5.5% for AGIs over 100k)
Profit/loss from business: +$7,794 (reported on 14.1% of returns)
Here:
+$7,794
State:
+$10,071
(% of AGI for various income ranges: 6.8% for AGIs below $10k, 4.1% for AGIs $10k-25k, 2.3% for AGIs $25k-50k, 2.5% for AGIs $50k-75k, 1.2% for AGIs $75k-100k, 2.8% for AGIs over 100k)
IRA payment deduction: $2,949 (reported on 2.4% of returns)
47111:
$2,949
Indiana:
$2,840
(% of AGI for various income ranges: 0.2% for AGIs $10k-25k, 0.2% for AGIs $25k-50k, 0.2% for AGIs $50k-75k, 0.1% for AGIs $75k-100k, 0.1% for AGIs over 100k)
Self-employed pension: $5,778 (reported on 0.3% of returns)
Here:
$5,778
Indiana:
$15,305
Total itemized deductions: $16,195 (21% of AGI, reported on 32.4% of returns)
Here:
$16,195
State:
$17,065
Here:
21.2% of AGI
State:
19.5% of AGI
(% of AGI for various income ranges: 7.8% for AGIs below $10k, 6.9% for AGIs $10k-25k, 10.3% for AGIs $25k-50k, 12.4% for AGIs $50k-75k, 15.1% for AGIs $75k-100k, 13.9% for AGIs over 100k)
Charity contributions deductions: $2,859 (4% of AGI, reported on 27.9% of returns)
Here:
$2,859
State:
$3,550
Here:
3.6% of AGI
State:
3.8% of AGI
(% of AGI for various income ranges: 0.8% for AGIs below $10k, 0.7% for AGIs $10k-25k, 1.2% for AGIs $25k-50k, 1.6% for AGIs $50k-75k, 2.3% for AGIs $75k-100k, 2.8% for AGIs over 100k)
Total tax: $5,652 (reported on 74.4% of returns)
47111:
$5,652
State:
$6,914
(% of AGI for various income ranges: 2.9% for AGIs below $10k, 3.7% for AGIs $10k-25k, 6.2% for AGIs $25k-50k, 8.3% for AGIs $50k-75k, 9.7% for AGIs $75k-100k, 16.6% for AGIs over 100k)
Earned income credit: $1,633 (reported on 16.9% of returns)
Here:
$1,633
State:
$1,685
Percentage of individuals using paid preparers for their 2004 taxes: 63.8%
Here:
64%
State:
59%
(% for various income ranges: 55.2% for AGIs below $10k, 68.0% for AGIs $10k-25k, 64.2% for AGIs $25k-50k, 64.4% for AGIs $50k-75k, 63.2% for AGIs $75k-100k, 70.0% for AGIs over 100k)
Likely homosexual households (counted as self-reported same-sex unmarried-partner households)
Lesbian couples: 0.2% of all households
Gay men: 0.0% of all households
Household received Food Stamps/SNAP in the past 12 months: 545 Household did not receive Food Stamps/SNAP in the past 12 months: 6,185
Women who had a birth in the past 12 months: 49 (22 now married, 24 unmarried) Women who did not have a birth in the past 12 months: 4,469 (2,442 now married, 2,035 unmarried)
Housing units in zip code 47111 with a mortgage: 4,333 (222 second mortgage, 220 both second mortgage and home equity loan) Houses without a mortgage: 279
Median monthly owner costs for units with a mortgage: $1,479 Median monthly owner costs for units without a mortgage: $489
Residents with income below the poverty level in 2022:
This zip code:
9.4%
Whole state:
12.6%
Residents with income below 50% of the poverty level in 2022:
This zip code:
4.9%
Whole state:
6.3%
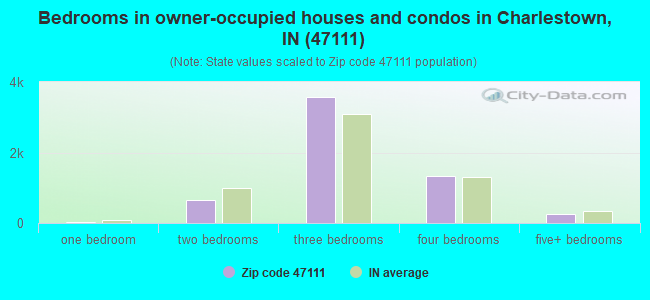
Median number of rooms in houses and condos:
Here:
6.0
State:
6.6
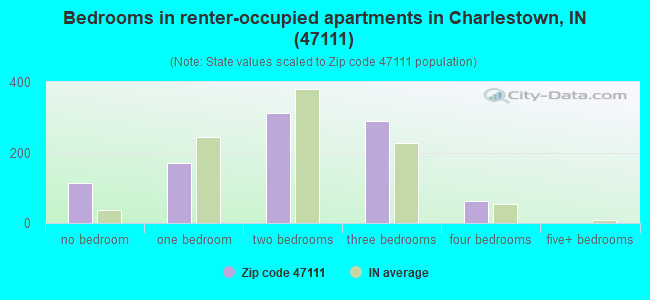
Median number of rooms in apartments:
Here:
4.3
State:
4.3
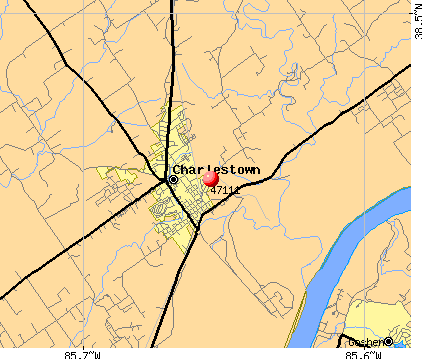
Notable locations in this zip code not listed on our city pages
Notable locations in zip code 47111: Charlestown Landing (A), Charlestown Fire Department Station 1 (B), Charlestown Fire Department Station 3 (C), Charlestown Fire Department Station 4 (D). Display/hide their locations on the map
Churches in zip code 47111 include: Bethany Church (A), Owen Creek Church (B), Pleasant Grove Church (C), Pleasant View Church (D), Salem Church (E), Stony Point Church (F). Display/hide their locations on the map
Cemeteries: Bottoff Cemetery (1), Fifty-four Cemetery (2), Pleasant Grove Cemetery (3), Worrell Cemetery (4), Long Cemetery (5), Robinson Cemetery (6). Display/hide their locations on the map
Streams, rivers, and creeks: Pleasant Run (A), Lick Creek (B), Sugar Run (C), Yankee Creek (D), Jenny Lind Run (E), Owen Creek (F), Fourteenmile Creek (G), Dry Branch (H), Nine Penny Branch (I). Display/hide their locations on the map
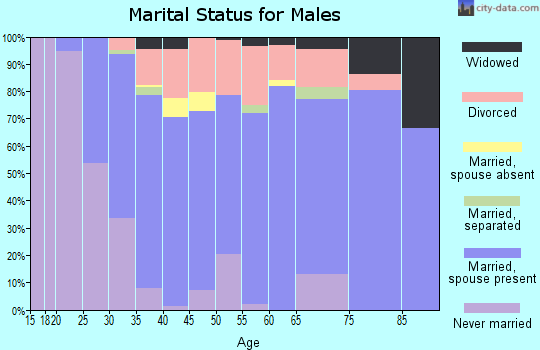
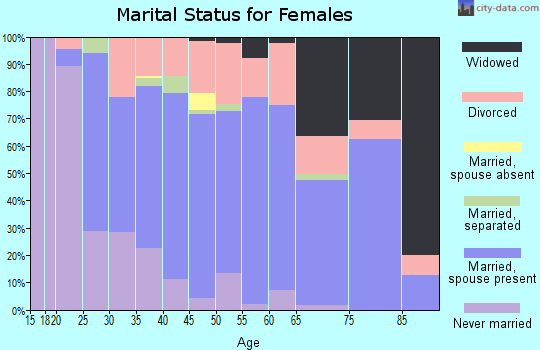
2,768 married couples with children.
1,378 single-parent households (658 men, 720 women).
94.5% of residents of 47111 zip code speak English at home.
3.0% of residents speak Spanish at home (41% very well, 15% well, 41% not well, 2% not at all).
0.6% of residents speak other Indo-European language at home (88% very well, 12% well).
0.8% of residents speak Asian or Pacific Island language at home (11% very well, 12% well, 50% not well, 27% not at all).
0.5% of residents speak other language at home (100% well).
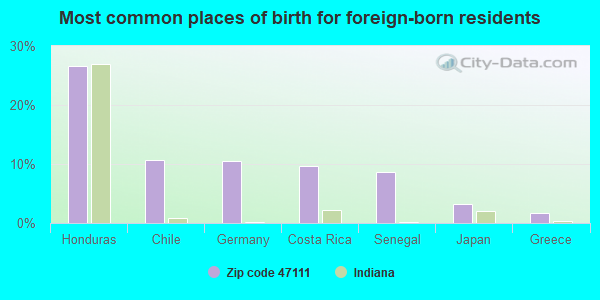
Foreign born population: 472 (2.6%) (28.2% of them are naturalized citizens)
This zip code:
2.6%
Whole state:
6.1%
27%Honduras
11%Chile
11%Germany
10%Costa Rica
9%Senegal
3%Japan
2%Greece
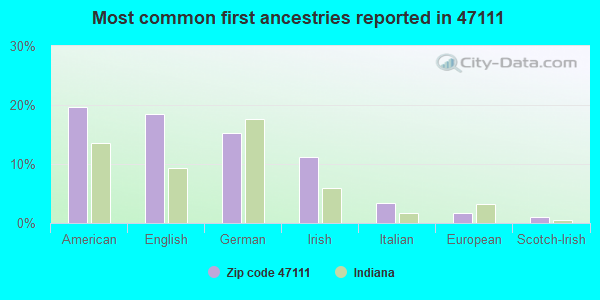
20%American
18%English
15%German
11%Irish
3%Italian
2%European
1%Scotch-Irish
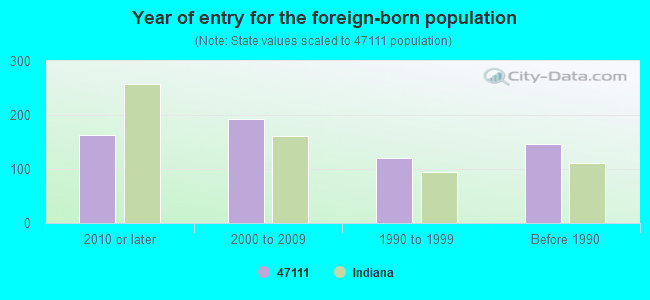
Year of entry for the foreign-born population
1632010 or later
1932000 to 2009
1211990 to 1999
147Before 1990
Major facilities with environmental interests located in this zip code:
MULZER CRUSHED STONE (15602 CHARLESTOWN BETHLEHEM RD in CHARLESTOWN, IN)
AIR MINOR (AIRS/AFS) STATE MASTER (Indiana facility tracking) - ACES-OP-01900038, AIR PROGRAM, ACES-OP-07900053, CRITERIA AND HAZARDOUS AIR POLLUTANT INVENTORY (Inventory of air pollution sources) National Pollutant Discharge Elimination System NON-MAJOR (Tracking pollutant discharge elimination systems) - permit Business SIC classification: CRUSHED AND BROKEN LIMESTONE; ASPHALT PAVING MIXTURES AND BLOCKS Business NAICS classification: CRUSHED AND BROKEN LIMESTONE MINING AND QUARRYING. Organizations: REGGIE TIMBERLAKE (CONTACT/OPERATOR)
Alternative names: MULZER CRUSHED STONE, CHARLEST
RHODES INCORPORATED (100 QUALITY COURT in CHARLESTOWN, IN)
AIR SYNTHETIC MINOR (AIRS/AFS) AIR MINOR (AIRS/AFS) STATE MASTER (Indiana facility tracking) - ACES-OP-01900041, AIR PROGRAM, ACES-OP-01905002, CRTK-1086, EPCRA, SPILL-199003024, RELEASE ASSESSMENT CRITERIA AND HAZARDOUS AIR POLLUTANT INVENTORY (Inventory of air pollution sources) Small Quantity Generators, between 100 kg and 1000 kg of hazardous waste/month (Resource Conservation and Recovery Act (tracking hazardous waste)) - notification Business SIC classification: COMMERCIAL PRINTING, LITHOGRAPHIC; NONCLASSIFIABLE ESTABLISHMENTS Business NAICS classification: COMMERCIAL LITHOGRAPHIC PRINTING.; COMMERCIAL LITHOGRAPHIC PRINTING. Organizations: ADPLEX.RHODES (CONTACT/OPERATOR)
, RR DONNELLEY CHARLESTOWN INC (CONTACT/OPERATOR)
, RR DONNELLEY AND SONS CO (CONTACT/OWNER)
, LSC ENTERPRISES (CONTACT/OWNER)
, WINDWARD PRINTSTAR INC DBA ADPLEX.RHODES (CONTACT/OWNER)
CHARLESTOWN MUNICIPAL WWTP (229 CHARLESTOWN LANDING RD in CHARLESTOWN, IN)
STATE MASTER (Indiana facility tracking) - CRTK-484, EPCRA National Pollutant Discharge Elimination System MAJOR (Tracking pollutant discharge elimination systems) - permit COMMUNITY WATER SYSTEM (SDWIS) - SDWIS-IN5210003 7189, WATER TREATMENT PLANT Business SIC classification: SEWERAGE SYSTEMS Organizations: MICHAEL PERRY 15472 (CONTACT/OPERATOR)
, CHARLESTOWN CITY HALL (CONTACT/OWNER)
Alternative names: CHARLESTOWN MUNICIPAL STP, CHARLESTOWN WATER DEPARTMENT
CLARK COUNTY HWY DEPT (6103 SR 403 in CHARLESTOWN, IN)
STATE MASTER (Indiana facility tracking) - UST-14624, UNDERGROUND STORAGE TANK PROGRAM (Resource Conservation and Recovery Act (tracking hazardous waste))
DECKERS FOOD MART (7302 DECKER RD in CHARLESTOWN, IN)
STATE MASTER (Indiana facility tracking) - UST-14375, UNDERGROUND STORAGE TANK PROGRAM (Resource Conservation and Recovery Act (tracking hazardous waste)) Organizations: JOHN BECKORT (CONTACT/OWNER)
Alternative names: DECKERS MARKET
CHARLESTOWN SENIOR HIGH SCH (MONROE/PARK STS in CHARLESTOWN, IN)
(Geographic Names Information System) (National Center for Education Statistics) - STATE ID-0821 Organizations: GREATER CLARK COUNTY SCHOOLS (SCHOOL DISTRICT)
NIBCO INC (105 QUALITY CT in CHARLESTOWN, IN)
STATE MASTER (Indiana facility tracking) - ACES-OP-01900081, AIR PROGRAM, CRTK-21607, EPCRA Conditionally Exempt Small Quantity Generators, less than 100 kg/month of hazardous waste (Resource Conservation and Recovery Act (tracking hazardous waste)) - notification Alternative names: CHEMTROL FACTORY, NIBCO OF CHARLESTOWN
ARAB TERMITE & PEST CONTROL CO (338 SR 160 in CHARLESTOWN, IN)
(Integrated Compliance Information System) - ICIS-05-1983-0067, FORMAL ENFORCEMENT ACTION, ICIS-05-1986-0168, STATE MASTER (Indiana facility tracking) Business SIC classification: DISINFECTING AND PEST CONTROL SERVICES
CHARLESTOWN MIDDLE SCHOOL (8804 HIGH JACKSON RD in CHARLESTOWN, IN)
(National Center for Education Statistics) - STATE ID-0863 Organizations: GREATER CLARK COUNTY SCHOOLS (SCHOOL DISTRICT)
PLEASANT RIDGE ELEM SCHOOL (1250 MONROE ST in CHARLESTOWN, IN)
(National Center for Education Statistics) - STATE ID-0829 Organizations: GREATER CLARK COUNTY SCHOOLS (SCHOOL DISTRICT)
MIDWEST RESOURCE RECOVERY CTR (FACILITY 203-2 9TH ST in CHARLESTOWN, IN)
STATE MASTER (Indiana facility tracking) National Pollutant Discharge Elimination System NON-MAJOR (Tracking pollutant discharge elimination systems) - permit Conditionally Exempt Small Quantity Generators, less than 100 kg/month of hazardous waste (Resource Conservation and Recovery Act (tracking hazardous waste)) - notification Business SIC classification: REFUSE SYSTEMS Organizations: CERTIFIED OPERATOR (CONTACT/OPERATOR)
, MIDWEST ENVIRONMENTAL SERVICES (CONTACT/OWNER)
, MIDWEST ENVIRONMENTAL SVCS (CONTACT/OWNER)
MORGAN AGRI INC (7518 HIBERNIA in CHARLESTOWN, IN)
STATE MASTER (Indiana facility tracking) - CRTK-20167, EPCRA COMPLIANCE ACTIVITY (Tracking inspections of insecticide, fungicide, and rodenticide, and toxic substances)
MULZER CRUSHED STONE, INC. (BARGE WATER DISCHARGE in CHARLESTOWN, IN)
STATE MASTER (Indiana facility tracking) National Pollutant Discharge Elimination System NON-MAJOR (Tracking pollutant discharge elimination systems) - permit Business SIC classification: MARINE CARGO HANDLING Organizations: DONALD W GERGELBACH 11465 (CONTACT/OPERATOR)
, MULZER CRUSHED STONE INC (CONTACT/OWNER)
Alternative names: MULZER CRUSHED STONE, BARGE WT
Housing units lacking complete plumbing facilities: 2.5% Housing units lacking complete kitchen facilities: 4.3%
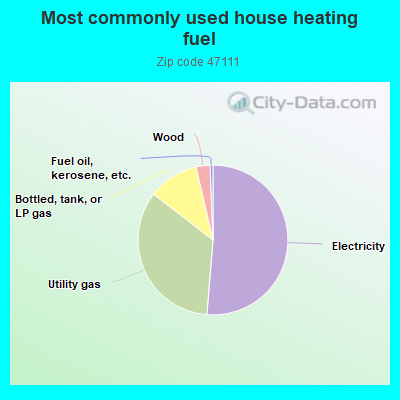
51.1%Electricity
34.0%Utility gas
10.9%Bottled, tank, or LP gas
3.0%Wood
0.6%Fuel oil, kerosene, etc.
Population in 1990: 9,896. Population change in the 1990s: +2,149 (+21.7%).
Place of birth for U.S.-born residents:
This state: 9,251
Northeast: 419
Midwest: 1,363
South: 5,756
West: 684
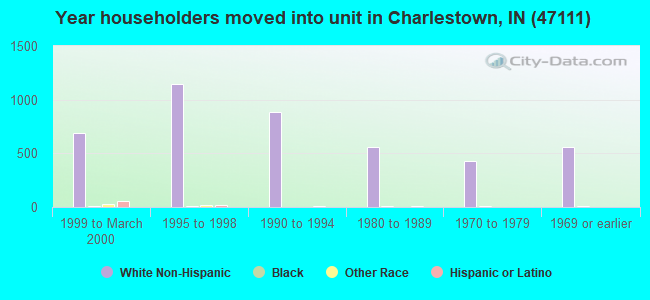
60% of the 47111 zip code residents lived in the same house 5 years ago. Out of people who lived in different houses, 69% lived in this county. Out of people who lived in different counties, 50% lived in Indiana.
92% of the 47111 zip code residents lived in the same house 1 year ago. Out of people who lived in different houses, 66% moved from this county. Out of people who lived in different houses, 1% moved from different county within same state. Out of people who lived in different houses, 35% moved from different state.
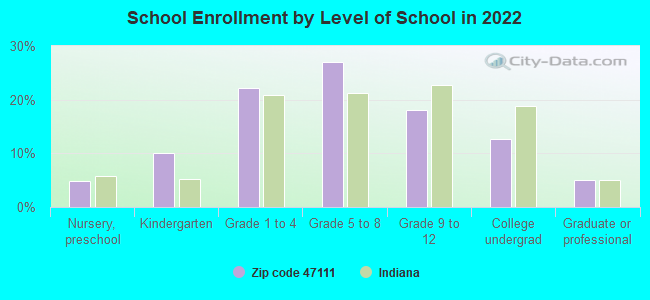
Private vs. public school enrollment:
Students in private schools in grades 1 to 8 (elementary and middle school): 371
Here:
15.7%
Indiana:
14.9%
Students in private schools in grades 9 to 12 (high school): 167
Here:
19.6%
Indiana:
11.4%
Students in private undergraduate colleges: 149
Here:
24.3%
Indiana:
22.3%
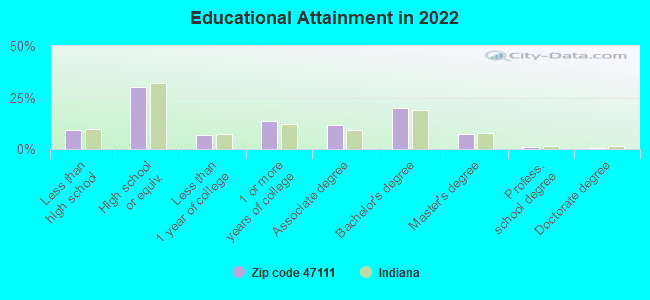
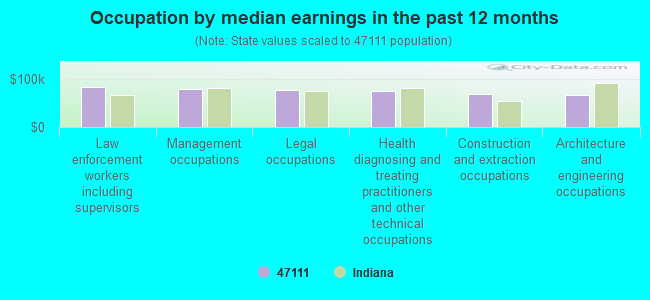
Occupation by median earnings in the past 12 months ($)
83,971Law enforcement workers including supervisors
78,973Management occupations
76,938Legal occupations
75,396Health diagnosing and treating practitioners and other technical occupations
68,947Construction and extraction occupations
68,103Architecture and engineering occupations
Companies with federal contracts located in this zip code:
INDIANA ORDNANCE WORKS INC (11452 HIGHWAY 62 STE 124 in CHARLESTOWN, IN; small business) 50 employees, $0 revenue. Small Disadvantaged Business: $2,143,907 in 12 contractsfrom 2000 to 2006
Contracts for Other Special Studies and Analyses, Cartridge and Propellant Actuated Devices and Components, Training Aids, Maintenance, Repair and Rebuilding of Equipment -- Instruments and Laboratory Equipment, and moreby Army Signed by year:2000: $84,840; 2001: $156,597; 2002: $263,760; 2003: $72,714; 2004: $154,411; 2005: $217,973; 2006: $1,193,612.
Biggest contracts:
$1,185,650 with Army for Other Special Studies and Analyses. Signed on 2006-05-25. Completion date: 2006-12-30.
$217,973 with Army for Cartridge and Propellant Actuated Devices and Components. Signed on 2005-09-26. Completion date: 2006-01-27.
$154,411 with Army for Training Aids. Signed on 2004-06-23. Completion date: 2004-06-23.
$152,420 with Army for Maintenance, Repair and Rebuilding of Equipment -- Instruments and Laboratory Equipment. Signed on 2002-03-22. Completion date: 2002-10-08.
PENDULUM MANAGEMENT COMPANY LL (11452 HIGHWAY 62, SUITE 21 in CHARLESTOWN, IN; small business) : $1,111,892 in 19 contractsfrom 2001 to 2006
Contracts for Other Professional Services, Other Management Support Services, Advertising Services, Program Management/Support Services, and moreby Army, National Institute of Standards and Technology Signed by year:2000: $0; 2001: $93,800; 2002: $294,427; 2003: $220,648; 2004: $224,552; 2005: $116,955; 2006: $161,510.
Biggest contracts:
$100,000 with Army for Other Professional Services. Signed on 2002-08-26. Completion date: 2002-11-15.
$99,280 with Army for Other Management Support Services. Signed on 2003-07-22. Completion date: 2004-06-30.
$96,000 with Army for Advertising Services. Signed on 2002-08-05. Completion date: 2003-07-31.
$93,000 with Army for Other Management Support Services. Signed on 2004-06-25. Completion date: 2005-08-30.
ICI AMERICAS INC (11452 HIGHWAY 62 in CHARLESTOWN, IN; small business) 50 employees, $0 revenue. Small Disadvantaged Business: $68,440 in 6 contractsfrom 1999 to 2003
Contracts for Ammunition -- Advanced Development (R&D), Maintenance, Repair and Rebuilding of Equipment -- Instruments and Laboratory Equipment, Ammunition, 75 mm through 125 mm, Advertising Services by Army Signed by year:2000: $0; 2001: $30,320; 2002: -$88,808; 2003: -$9,641; 2004: $0; 2005: $0; 2006: $0.
Biggest contracts:
$96,024 with Army for Ammunition -- Advanced Development (R&D). Signed on 1999-11-19. Completion date: 2000-02-02.
$40,545, same as above.Signed on 1999-11-19. Completion date: 2000-02-02.
$30,320 with Army for Maintenance, Repair and Rebuilding of Equipment -- Instruments and Laboratory Equipment. Signed on 2001-03-12. Completion date: 2001-03-30.
$0 with Army for Ammunition, 75 mm through 125 mm. Signed on 2002-05-20. Completion date: 1993-12-31.
Top industries in this zip code by the number of employees in 2005:
Health Care and Social Assistance: General Medical and Surgical Hospitals (100-249 employees: 1 establishment)
2002 - 2018 National Fire Incident Reporting System (NFIRS) incidents
According to the data from the years 2002 - 2018 the average number of fire incidents per year is 51. The highest number of reported fire incidents - 93 took place in 2004, and the least - 10 in 2014. The data has a decreasing trend.
When looking into fire subcategories, the most reports belonged to: Outside Fires (38.8%), and Structure Fires (34.8%).
Fire incident types reported to NFIRS in Zip Code 47111
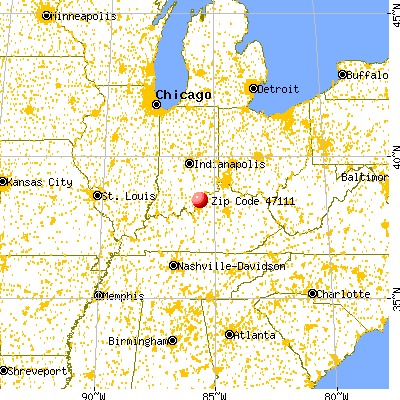


 Nearest zip codes: 47163, 47141, 40026, 40059, 47143, 47130.


 According to the data from the years 2002 - 2018 the average number of fire incidents per year is 51. The highest number of reported fire incidents - 93 took place in 2004, and the least - 10 in 2014. The data has a decreasing trend.
 When looking into fire subcategories, the most reports belonged to: Outside Fires (38.8%), and Structure Fires (34.8%).