Estimated zip code population in 2022: 16,227 Zip code population in 2010: 16,277 Zip code population in 2000: 16,151
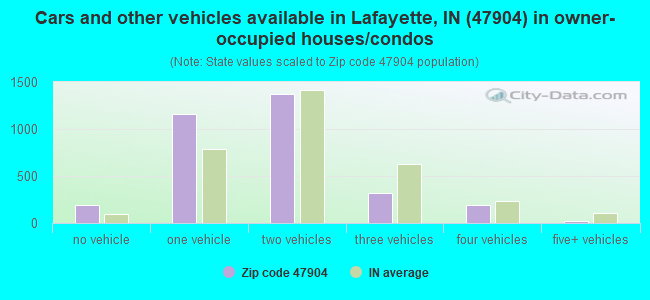
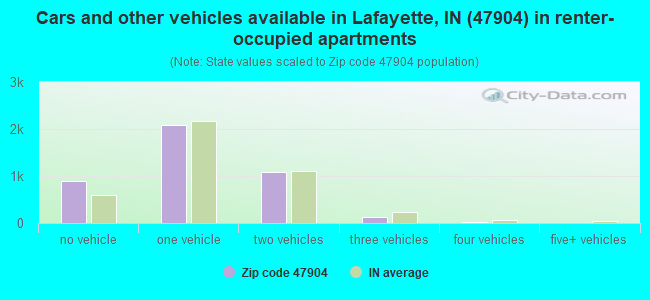
Houses and condos: 7,943 Renter-occupied apartments: 4,195
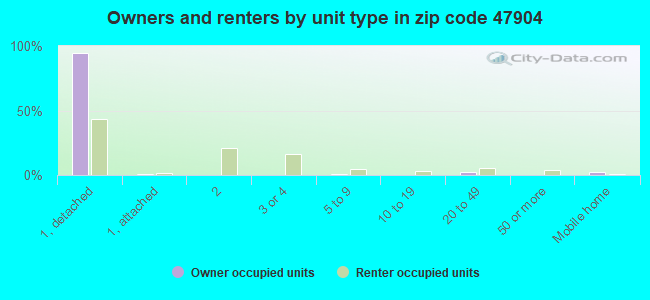
% of renters here:
56%
State:
29%
March 2022 cost of living index in zip code 47904: 87.4 (less than average, U.S. average is 100)
Land area: 5.7 sq. mi. Water area: 0.2 sq. mi.
Population density: 2,867 people per square mile
(average).
OSM Map
General Map
Google Map
MSN Map
OSM Map
General Map
Google Map
MSN Map
OSM Map
General Map
Google Map
MSN Map
OSM Map
General Map
Google Map
MSN Map
Please wait while loading the map...
Real estate property taxes paid for housing units in 2022:
This zip code:
0.5% ($621)
Indiana:
0.7% ($1,467)
Median real estate property taxes paid for housing units with mortgages in 2022: $671 (0.5%) Median real estate property taxes paid for housing units with no mortgage in 2022: $562 (0.5%)
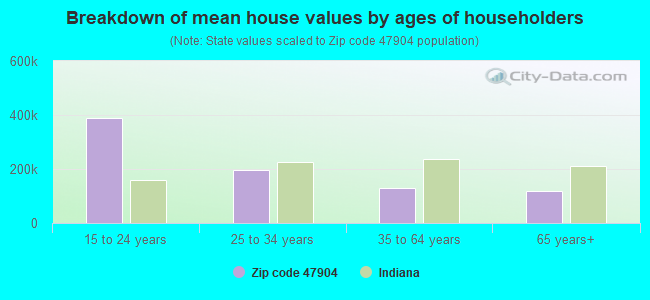
Estimated median house/condo value in 2022: $124,924
47904:
$124,924
Indiana:
$208,700
According to our research of Indiana and other state lists, there were 2 registered sex offenders living in 47904 zip code as of April 27, 2024. The ratio of all residents to sex offenders in zip code 47904 is 8,591 to 1. The ratio of registered sex offenders to all residents in this zip code is much lower than the state average.
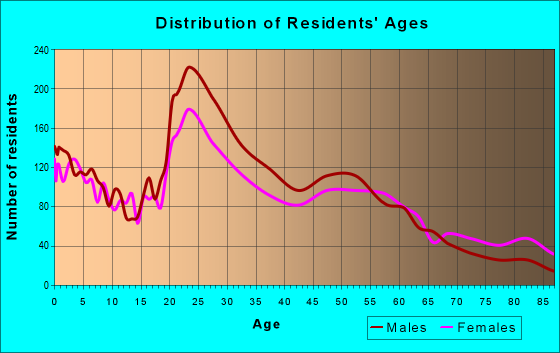
Median resident age:
This zip code:
34.9 years
Indiana median age:
38.2 years
Average household size:
This zip code:
2.0 people
Indiana:
2.4 people
Averages for the 2020 tax year for zip code 47904, filed in 2021:
Average Adjusted Gross Income (AGI) in 2020: $36,107 (Individual Income Tax Returns)
Here:
$36,107
State:
$64,978
Salary/wage: $32,836 (reported on 87.3% of returns)
Here:
$32,836
State:
$55,245
(% of AGI for various income ranges: 1171.4% for AGIs below $25k, 3660.8% for AGIs $25k-50k, 6563.9% for AGIs $50k-75k, 9076.2% for AGIs $75k-100k, 13120.5% for AGIs $100k-200k)
Taxable interest for individuals: $718 (reported on 16.1% of returns)
This zip code:
$718
Indiana:
$1,351
(% of AGI for various income ranges: 5.0% for AGIs below $25k, 8.4% for AGIs $25k-50k, 22.0% for AGIs $50k-75k, 38.6% for AGIs $75k-100k, 73.2% for AGIs $100k-200k)
Ordinary dividends: $2,606 (reported on 8.3% of returns)
Here:
$2,606
State:
$5,827
(% of AGI for various income ranges: 5.4% for AGIs below $25k, 14.4% for AGIs $25k-50k, 22.2% for AGIs $50k-75k, 80.7% for AGIs $75k-100k, 247.9% for AGIs $100k-200k)
Net capital gain/loss in AGI: +$5,688 (reported on 7.5% of returns)
Here:
+$5,688
State:
+$17,730
(% of AGI for various income ranges: 4.3% for AGIs below $25k, 25.8% for AGIs $25k-50k, 56.8% for AGIs $50k-75k, 161.7% for AGIs $75k-100k, 429.5% for AGIs $100k-200k)
Profit/loss from business: +$7,943 (reported on 10.5% of returns)
Here:
+$7,943
State:
+$12,144
(% of AGI for various income ranges: 76.9% for AGIs below $25k, 73.7% for AGIs $25k-50k, 171.6% for AGIs $50k-75k, 198.3% for AGIs $75k-100k, 417.9% for AGIs $100k-200k)
Taxable individual retirement arrangement distribution: $13,854 (reported on 5.3% of returns)
47904:
$13,854
Indiana:
$18,302
(% of AGI for various income ranges: 19.5% for AGIs below $25k, 45.7% for AGIs $25k-50k, 119.3% for AGIs $50k-75k, 310.7% for AGIs $75k-100k, 1230.0% for AGIs $100k-200k)
Total itemized deductions: $30,793 (reported on 1.9% of returns)
Here:
$30,793
State:
$35,601
(% of AGI for various income ranges: 56.4% for AGIs $25k-50k, 201.6% for AGIs $50k-75k, 986.3% for AGIs $100k-200k)
Charity contributions: $11,160 (reported on 1.3% of returns)
Here:
$11,160
State:
$15,596
(% of AGI for various income ranges: 5.4% for AGIs below $25k, 45.4% for AGIs $50k-75k, 325.3% for AGIs $100k-200k)
Taxes paid: $4,729 (reported on 1.8% of returns)
47904:
$4,729
State:
$7,542
(% of AGI for various income ranges: 4.7% for AGIs $25k-50k, 26.1% for AGIs $50k-75k, 191.6% for AGIs $100k-200k)
Earned income credit: $2,205 (reported on 25.3% of returns)
Here:
$2,205
State:
$2,298
(% of AGI for various income ranges: 102.5% for AGIs below $25k, 64.5% for AGIs $25k-50k, 1.8% for AGIs $50k-75k)
Percentage of individuals using paid preparers for their 2020 taxes: 94.8%
Here:
95%
State:
94%
(% for various income ranges: 94.2% for AGIs below $25k, 95.7% for AGIs $25k-50k, 95.0% for AGIs $50k-75k, 94.7% for AGIs $75k-100k, 92.6% for AGIs $100k-200k, 100.0% for AGIs over 200k)
Averages for the 2012 tax year for zip code 47904, filed in 2013:
Average Adjusted Gross Income (AGI) in 2012: $31,330 (Individual Income Tax Returns)
Here:
$31,330
State:
$52,932
Salary/wage: $28,623 (reported on 88.2% of returns)
Here:
$28,623
State:
$45,173
(% of AGI for various income ranges: 82.5% for AGIs below $25k, 86.8% for AGIs $25k-50k, 85.3% for AGIs $50k-75k, 74.1% for AGIs $75k-100k, 73.3% for AGIs $100k-200k, 52.4% for AGIs over 200k)
Taxable interest for individuals: $968 (reported on 18.2% of returns)
This zip code:
$968
Indiana:
$1,311
(% of AGI for various income ranges: 0.6% for AGIs below $25k, 0.4% for AGIs $25k-50k, 0.6% for AGIs $50k-75k, 0.8% for AGIs $75k-100k, 0.8% for AGIs $100k-200k, 0.5% for AGIs over 200k)
Ordinary dividends: $2,393 (reported on 9.5% of returns)
Here:
$2,393
State:
$4,690
(% of AGI for various income ranges: 0.5% for AGIs below $25k, 0.4% for AGIs $25k-50k, 0.5% for AGIs $50k-75k, 0.9% for AGIs $75k-100k, 1.7% for AGIs $100k-200k, 2.0% for AGIs over 200k)
Net capital gain/loss in AGI: +$4,791 (reported on 6.4% of returns)
Here:
+$4,791
State:
+$10,406
(% of AGI for various income ranges: 0.1% for AGIs below $25k, 0.4% for AGIs $50k-75k, 0.3% for AGIs $75k-100k, 2.6% for AGIs $100k-200k, 8.8% for AGIs over 200k)
Profit/loss from business: +$7,122 (reported on 9.3% of returns)
Here:
+$7,122
State:
+$11,105
(% of AGI for various income ranges: 5.0% for AGIs below $25k, 1.4% for AGIs $25k-50k, 0.9% for AGIs $50k-75k, 1.1% for AGIs $75k-100k, 2.3% for AGIs $100k-200k)
Taxable individual retirement arrangement distribution: $8,650 (reported on 6.3% of returns)
47904:
$8,650
Indiana:
$13,841
(% of AGI for various income ranges: 1.6% for AGIs below $25k, 1.0% for AGIs $25k-50k, 1.7% for AGIs $50k-75k, 4.3% for AGIs $75k-100k, 2.6% for AGIs $100k-200k)
Total itemized deductions: $15,186 (21% of AGI, reported on 10.9% of returns)
Here:
$15,186
State:
$20,913
Here:
20.5% of AGI
State:
18.2% of AGI
(% of AGI for various income ranges: 3.0% for AGIs below $25k, 3.9% for AGIs $25k-50k, 5.8% for AGIs $50k-75k, 7.3% for AGIs $75k-100k, 9.5% for AGIs $100k-200k, 8.0% for AGIs over 200k)
Charity contributions: $3,434 (reported on 8.0% of returns)
Here:
$3,434
State:
$4,697
(% of AGI for various income ranges: 0.3% for AGIs below $25k, 0.6% for AGIs $25k-50k, 0.9% for AGIs $50k-75k, 1.4% for AGIs $75k-100k, 2.1% for AGIs $100k-200k, 1.7% for AGIs over 200k)
Taxes paid: $4,608 (reported on 10.9% of returns)
47904:
$4,608
State:
$7,456
(% of AGI for various income ranges: 0.4% for AGIs below $25k, 0.8% for AGIs $25k-50k, 1.6% for AGIs $50k-75k, 2.3% for AGIs $75k-100k, 3.6% for AGIs $100k-200k, 4.8% for AGIs over 200k)
Earned income credit: $2,172 (reported on 26.9% of returns)
Here:
$2,172
State:
$2,265
(% of AGI for various income ranges: 6.7% for AGIs below $25k, 1.1% for AGIs $25k-50k)
Percentage of individuals using paid preparers for their 2012 taxes: 45.4%
Here:
45%
State:
53%
(% for various income ranges: 41.5% for AGIs below $25k, 48.5% for AGIs $25k-50k, 48.6% for AGIs $50k-75k, 59.3% for AGIs $75k-100k, 60.0% for AGIs $100k-200k, 75.0% for AGIs over 200k)
Averages for the 2004 tax year for zip code 47904, filed in 2005:
Average Adjusted Gross Income (AGI) in 2004: $29,342 (Individual Income Tax Returns)
Here:
$29,342
State:
$44,790
Salary/wage: $27,102 (reported on 88.0% of returns)
Here:
$27,102
State:
$39,615
(% of AGI for various income ranges: 86.8% for AGIs below $10k, 84.5% for AGIs $10k-25k, 87.1% for AGIs $25k-50k, 85.1% for AGIs $50k-75k, 81.2% for AGIs $75k-100k, 58.1% for AGIs over 100k)
Taxable interest for individuals: $1,277 (reported on 32.7% of returns)
This zip code:
$1,277
Indiana:
$1,535
(% of AGI for various income ranges: 2.8% for AGIs below $10k, 1.5% for AGIs $10k-25k, 1.0% for AGIs $25k-50k, 1.1% for AGIs $50k-75k, 1.6% for AGIs $75k-100k, 2.1% for AGIs over 100k)
Taxable dividends: $1,680 (reported on 13.6% of returns)
Here:
$1,680
State:
$2,998
(% of AGI for various income ranges: 1.3% for AGIs below $10k, 0.7% for AGIs $10k-25k, 0.6% for AGIs $25k-50k, 0.7% for AGIs $50k-75k, 0.9% for AGIs $75k-100k, 1.3% for AGIs over 100k)
Net capital gain/loss: +$3,766 (reported on 10.1% of returns)
Here:
+$3,766
State:
+$8,619
(% of AGI for various income ranges: -0.8% for AGIs below $10k, 0.3% for AGIs $10k-25k, 0.4% for AGIs $25k-50k, 0.3% for AGIs $50k-75k, 1.9% for AGIs $75k-100k, 5.9% for AGIs over 100k)
Profit/loss from business: +$6,418 (reported on 8.8% of returns)
Here:
+$6,418
State:
+$10,071
(% of AGI for various income ranges: 4.2% for AGIs below $10k, 2.2% for AGIs $10k-25k, 2.0% for AGIs $25k-50k, 1.6% for AGIs $50k-75k, 1.5% for AGIs $75k-100k, 1.5% for AGIs over 100k)
IRA payment deduction: $2,057 (reported on 1.8% of returns)
47904:
$2,057
Indiana:
$2,840
(% of AGI for various income ranges: 0.2% for AGIs $10k-25k, 0.1% for AGIs $25k-50k, 0.1% for AGIs $50k-75k, 0.2% for AGIs $75k-100k)
Total itemized deductions: $12,585 (21% of AGI, reported on 18.5% of returns)
Here:
$12,585
State:
$17,065
Here:
21.2% of AGI
State:
19.5% of AGI
(% of AGI for various income ranges: 5.8% for AGIs below $10k, 5.0% for AGIs $10k-25k, 6.8% for AGIs $25k-50k, 9.1% for AGIs $50k-75k, 11.8% for AGIs $75k-100k, 10.7% for AGIs over 100k)
Charity contributions deductions: $2,683 (4% of AGI, reported on 13.7% of returns)
Here:
$2,683
State:
$3,550
Here:
4.1% of AGI
State:
3.8% of AGI
(% of AGI for various income ranges: 0.3% for AGIs below $10k, 0.7% for AGIs $10k-25k, 0.9% for AGIs $25k-50k, 1.3% for AGIs $50k-75k, 1.8% for AGIs $75k-100k, 2.6% for AGIs over 100k)
Total tax: $3,840 (reported on 67.7% of returns)
47904:
$3,840
State:
$6,914
(% of AGI for various income ranges: 1.5% for AGIs below $10k, 4.1% for AGIs $10k-25k, 7.1% for AGIs $25k-50k, 9.2% for AGIs $50k-75k, 10.9% for AGIs $75k-100k, 19.3% for AGIs over 100k)
Earned income credit: $1,517 (reported on 20.6% of returns)
Here:
$1,517
State:
$1,685
Percentage of individuals using paid preparers for their 2004 taxes: 55.4%
Here:
55%
State:
59%
(% for various income ranges: 52.1% for AGIs below $10k, 58.3% for AGIs $10k-25k, 53.8% for AGIs $25k-50k, 55.3% for AGIs $50k-75k, 56.0% for AGIs $75k-100k, 61.4% for AGIs over 100k)
Likely homosexual households (counted as self-reported same-sex unmarried-partner households)
Lesbian couples: 0.2% of all households
Gay men: 0.2% of all households
Household received Food Stamps/SNAP in the past 12 months: 1,097 Household did not receive Food Stamps/SNAP in the past 12 months: 6,405
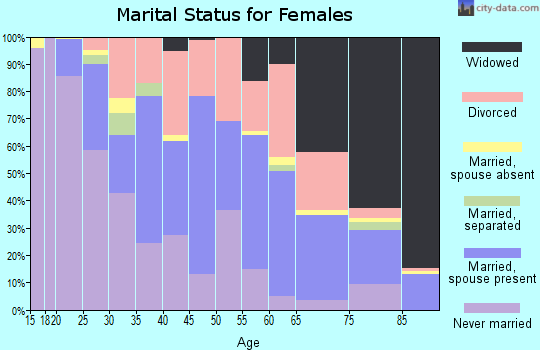
Women who had a birth in the past 12 months: 237 (60 now married, 154 unmarried) Women who did not have a birth in the past 12 months: 3,693 (1,468 now married, 2,223 unmarried)
Housing units in zip code 47904 with a mortgage: 2,237 (59 second mortgage, 39 both second mortgage and home equity loan) Median monthly owner costs for units with a mortgage: $878 Median monthly owner costs for units without a mortgage: $310
Residents with income below the poverty level in 2022:
This zip code:
18.3%
Whole state:
12.6%
Residents with income below 50% of the poverty level in 2022:
This zip code:
7.8%
Whole state:
6.3%
Median number of rooms in houses and condos:
Here:
5.9
State:
6.6
Median number of rooms in apartments:
Here:
4.3
State:
4.3
Notable locations in this zip code not listed on our city pages
Notable locations in zip code 47904: Saint Vincent Seton Specialty Hospital Lafayette Campus (A), Lafayette Fire Department Station 2 (B). Display/hide their locations on the map
1,473 married couples with children.
1,405 single-parent households (450 men, 955 women).
89.6% of residents of 47904 zip code speak English at home.
8.2% of residents speak Spanish at home (47% very well, 31% well, 22% not well).
0.7% of residents speak other Indo-European language at home (62% very well, 32% well, 6% not at all).
0.8% of residents speak Asian or Pacific Island language at home (80% very well, 20% well).
0.1% of residents speak other language at home (100% very well).
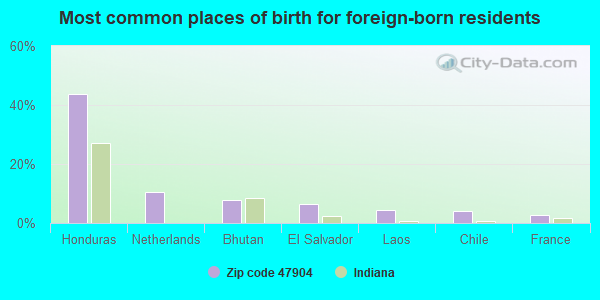
Foreign born population: 1,150 (7.1%) (17.1% of them are naturalized citizens)
Major facilities with environmental interests located in this zip code:
AE STALEY MANUFACTURING CO (2245 N SAGAMORE PKWY in LAFAYETTE, IN)
(Integrated Compliance Information System) - ICIS-05-1995-0537, FORMAL ENFORCEMENT ACTION STATE MASTER (Indiana facility tracking) - ACES-CP-1872, AIR PROGRAM, ACES-OP-15700003, ACES-ST-15700003, AIR STACK TESTING, CRTK-895, EPCRA COMPLIANCE ACTIVITY (Tracking inspections of insecticide, fungicide, and rodenticide, and toxic substances) CRITERIA AND HAZARDOUS AIR POLLUTANT INVENTORY (Inventory of air pollution sources) Conditionally Exempt Small Quantity Generators, less than 100 kg/month of hazardous waste (Resource Conservation and Recovery Act (tracking hazardous waste)) - notification TRI REPORTER (Tracking of toxic chemicals releasing facilities) Business SIC and NAICS classification: WET CORN MILLING Organizations: STALEY A E MFG CO (CONTACT/OWNER)
, TATE & LYLE INGREDIENTS AMERICAS, INC. (CONTACT/OWNER)
Alternative names: A E STALEY MANUFACTURING CO, A E STALEY MFG CO NORTH PLANT, A. E. STALEY MFG. CO. SAGAMORE OPS., STALEY A E MFG CO, STALEY A E MFG CO NORTH PLT
MIKE RAISOR PONTIAC ISUZU (2912 E MAIN ST in LAFAYETTE, IN)
STATE MASTER (Indiana facility tracking) - LUST-199301518, LEAKING STORAGE TANK, UST-12887, UNDERGROUND STORAGE TANK PROGRAM Conditionally Exempt Small Quantity Generators, less than 100 kg/month of hazardous waste (Resource Conservation and Recovery Act (tracking hazardous waste)) Conditionally Exempt Small Quantity Generators, less than 100 kg/month of hazardous waste (Resource Conservation and Recovery Act (tracking hazardous waste)) - notification Business NAICS classification: AUTOMOTIVE BODY, PAINT, AND INTERIOR REPAIR AND MAINTENANCE. Organizations: MIKE RAISOR PONTIAC-ISUZU (CONTACT/OPERATOR)
, RAISOR MIKE (CONTACT/OWNER)
, RAISOR MICHAEL (CONTACT/OWNER)
Alternative names: RAISOR MIKE PONTIAC ISUZU
REITH RILEY CONSTRUCTION (3425 O FARRELL RD in LAFAYETTE, IN)
AIR MAJOR (AIRS/AFS) STATE MASTER (Indiana facility tracking) - CRTK-2148, EPCRA, UST-1895, UNDERGROUND STORAGE TANK PROGRAM, ACES-OP-15703233, AIR PROGRAM, ACES-OP-15703286, ACES-OP-15703310, CRITERIA AND HAZARDOUS AIR POLLUTANT INVENTORY (Inventory of air pollution sources) Conditionally Exempt Small Quantity Generators, less than 100 kg/month of hazardous waste (Resource Conservation and Recovery Act (tracking hazardous waste)) - notification USED OIL PROGRAM (Resource Conservation and Recovery Act (tracking hazardous waste)) Business SIC classification: HIGHWAY AND STREET CONSTRUCTION, EXCEPT ELEVATED HIGHWAYS Organizations: RIETH-RILEY CONSTRUCTION CO (CONTACT/OWNER)
Alternative names: KEISER & KEISER, RIETH-RILEY CONSTRUCTION CO
ASAY MOTOR SALES (3216 UNION ST in LAFAYETTE, IN)
STATE MASTER (Indiana facility tracking) - LUST-199005030, LEAKING STORAGE TANK, UST-6667, UNDERGROUND STORAGE TANK PROGRAM, CRTK-4833, EPCRA (Resource Conservation and Recovery Act (tracking hazardous waste)) Organizations: SPEEDWAY SUPERAMERICA LLC (CONTACT/OWNER)
Alternative names: UNITED 6057
BOB ROHRMAN LINCOLN MERCURY SUBARU (304 SAGAMORE PKY N in LAFAYETTE, IN)
STATE MASTER (Indiana facility tracking) - LUST-199208529, LEAKING STORAGE TANK, LUST-199303516, UST-12634, UNDERGROUND STORAGE TANK PROGRAM Conditionally Exempt Small Quantity Generators, less than 100 kg/month of hazardous waste (Resource Conservation and Recovery Act (tracking hazardous waste)) Alternative names: BOB ROHRMAN LINCOLN-MERC-SUBARU, ROHRMAN BOB LINCOLN AND MERCURY SUBARU
CLARK RETAIL ENTERPRISES INC SERVICE STATION (3112 FERRY ST in LAFAYETTE, IN)
STATE MASTER (Indiana facility tracking) - UST-7366, UNDERGROUND STORAGE TANK PROGRAM (Resource Conservation and Recovery Act (tracking hazardous waste)) Organizations: WARECO SYSTEM OF IOWA (CONTACT/OWNER)
Alternative names: WARECO SERVICE STA #666
MIKE RAISOR IMPORTS (2911 E MAIN ST in LAFAYETTE, IN)
STATE MASTER (Indiana facility tracking) - LUST-199301517, LEAKING STORAGE TANK, UST-332, UNDERGROUND STORAGE TANK PROGRAM (Resource Conservation and Recovery Act (tracking hazardous waste)) Organizations: RASIOR MIKE (CONTACT/OWNER)
Alternative names: MIKE RAISOR PONTIAC ISUZU, RASIOR MIKE PONTIAC ISUZU
CINTAS THE UNIFORM PEOPLE (810 WIDEWATER DR in LAFAYETTE, IN)
STATE MASTER (Indiana facility tracking) - CRTK-21903, EPCRA Conditionally Exempt Small Quantity Generators, less than 100 kg/month of hazardous waste (Resource Conservation and Recovery Act (tracking hazardous waste)) - notification TRANSPORTER (Resource Conservation and Recovery Act (tracking hazardous waste)) - notification Organizations: MLS SHAREHOLDERS & LIQUIDATING TRUST (CONTACT/OWNER)
Alternative names: MECHANICS LAUNDRY
SEARS (1600 CANAL RD in LAFAYETTE, IN)
STATE MASTER (Indiana facility tracking) - CRTK-6047, EPCRA, UST-11516, UNDERGROUND STORAGE TANK PROGRAM Conditionally Exempt Small Quantity Generators, less than 100 kg/month of hazardous waste (Resource Conservation and Recovery Act (tracking hazardous waste)) Business NAICS classification: HOME AND GARDEN EQUIPMENT REPAIR AND MAINTENANCE. Organizations: SEARS 8940/6200 (CONTACT/OPERATOR)
, SEARS ROEBUCK & CO (CONTACT/OWNER)
Alternative names: SEARS #8940
ACTION MOTOR SPORTS (736 N 9TH ST in LAFAYETTE, IN)
STATE MASTER (Indiana facility tracking) - UST-12895, UNDERGROUND STORAGE TANK PROGRAM Conditionally Exempt Small Quantity Generators, less than 100 kg/month of hazardous waste (Resource Conservation and Recovery Act (tracking hazardous waste)) - notification Organizations: REED RAY (CONTACT/OWNER)
LINNWOOD ELEMENTARY SCHOOL (1415 BALL ST in LAFAYETTE, IN)
(Geographic Names Information System) (National Center for Education Statistics) - STATE ID-8097 Organizations: LAFAYETTE SCHOOL CORPORATION (SCHOOL DISTRICT)
MURDOCK ELEMENTARY SCHOOL (2100 CASON ST in LAFAYETTE, IN)
(Geographic Names Information System) (National Center for Education Statistics) - STATE ID-8105 Organizations: LAFAYETTE SCHOOL CORPORATION (SCHOOL DISTRICT)
OAKLAND ELEMENTARY SCHOOL (611 S 21ST ST in LAFAYETTE, IN)
(Geographic Names Information System) (National Center for Education Statistics) - STATE ID-8109 Organizations: LAFAYETTE SCHOOL CORPORATION (SCHOOL DISTRICT)
Housing units lacking complete plumbing facilities: 0.6% Housing units lacking complete kitchen facilities: 0.7%
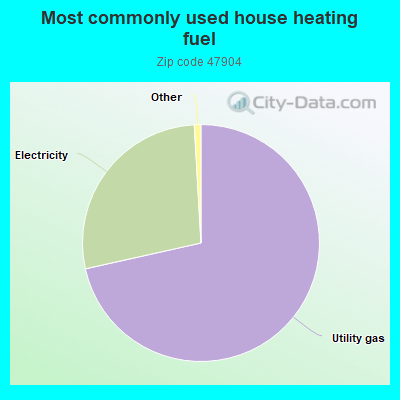
71.5%Utility gas
27.6%Electricity
Population in 1990: 15,231. Population change in the 1990s: +920 (+6.0%).
Place of birth for U.S.-born residents:
This state: 10,843
Northeast: 327
Midwest: 1,928
South: 1,238
West: 671
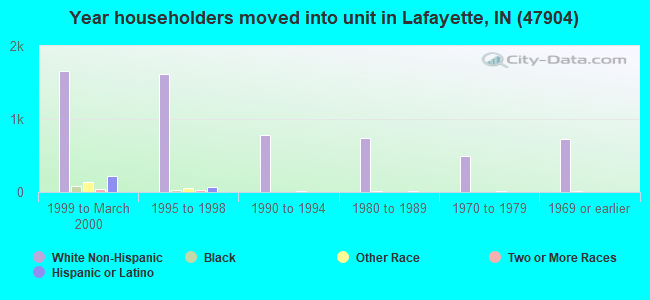
43% of the 47904 zip code residents lived in the same house 5 years ago. Out of people who lived in different houses, 56% lived in this county. Out of people who lived in different counties, 50% lived in Indiana.
85% of the 47904 zip code residents lived in the same house 1 year ago. Out of people who lived in different houses, 62% moved from this county. Out of people who lived in different houses, 18% moved from different county within same state. Out of people who lived in different houses, 12% moved from different state. Out of people who lived in different houses, 5% moved from abroad.
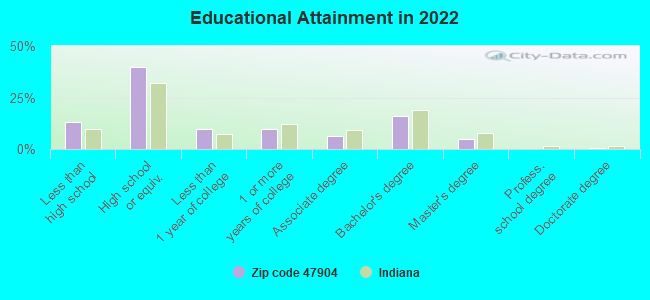
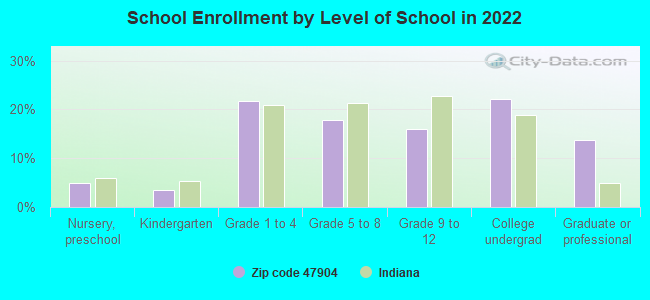
Private vs. public school enrollment:
Students in private schools in grades 1 to 8 (elementary and middle school): 137
Here:
9.2%
Indiana:
14.9%
Students in private schools in grades 9 to 12 (high school): 18
Here:
3.0%
Indiana:
11.4%
Students in private undergraduate colleges: 8
Here:
1.0%
Indiana:
22.3%
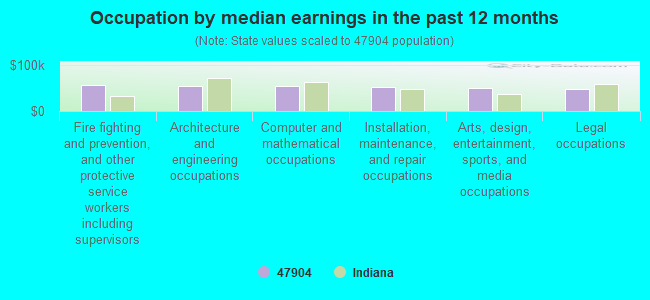
Occupation by median earnings in the past 12 months ($)
55,716Fire fighting and prevention, and other protective service workers including supervisors
54,923Architecture and engineering occupations
53,889Computer and mathematical occupations
51,067Installation, maintenance, and repair occupations
49,095Arts, design, entertainment, sports, and media occupations
47,346Legal occupations
Companies with federal contracts located in this zip code (LAFAYETTE, IN):
ASH MEDICAL SYSTEMS, INC (3601 SAGAMORE PARKWAY NORT; small business) : $799,997 in 3 contractsfrom 2001 to 2004
$377,000 with Army for Other Medical -- Operational Systems Development (R&D). Signed on 2003-01-07. Completion date: 2005-06-14.
$352,997, same as above.Signed on 2004-01-14. Completion date: 2005-06-14.
$70,000 with Army for Other Medical -- Basic Research (R&D). Signed on 2001-12-14. Completion date: 2002-07-14.
GARY L PORT CLEANING SVC (3113 UNDERWOOD ST; small business) : $37,174 in 10 contractsfrom 2003 to 2006
Contracts for Custodial Janitorial Services, Landscaping/Groundskeeping Services by Army Signed by year:2000: $0; 2001: $0; 2002: $0; 2003: $15,790; 2004: $7,128; 2005: $7,128; 2006: $7,128.
Biggest contracts:
$7,128 with Army for Custodial Janitorial Services. Signed on 2006-01-10. Completion date: 2006-02-28.
$7,128, same as above.Signed on 2005-03-01. Completion date: 2006-02-28.
$7,128, same as above.Signed on 2004-03-01. Completion date: 2004-02-28.
$7,128, same as above.Signed on 2003-02-26. Completion date: 2004-02-28.
TRW INC (800 HEATH ST)
$34,973 with Defense Logistics Agency for Vehicular Brake, Steering, Axle, Wheel, and Track Components. Signed on 2002-05-31. Completion date: 2002-08-29.
TRICAD INC (2218 MAIN ST; small business)
$29,411 with Air Force for ADP Software. Signed on 2000-09-18. Completion date: 2000-12-24.
LAFAYETTE ELECTRONIC SUPPLY (405-B N EARL AVE; small business) : $560 in 2 contractsin 2004
$560 with Army for Communication Training Devices. Signed on 2004-06-28. Completion date: 2004-07-18.
$0, same as above.Signed on 2004-06-28. Completion date: 2004-07-18.
Top industries in this zip code by the number of employees in 2005:
Health Care and Social Assistance: General Medical and Surgical Hospitals (over 1000 employees: 2 establishments)
Health Care and Social Assistance: Offices of Physicians (except Mental Health Specialists) (250-499: 1, 100-249: 1, 50-99: 4, 20-49: 5, 10-19: 5, 5-9: 4, 1-4: 3)
2003 - 2017 National Fire Incident Reporting System (NFIRS) incidents
Based on the data from the years 2003 - 2017 the average number of fires per year is 34. The highest number of reported fire incidents - 61 took place in 2008, and the least - 5 in 2016. The data has an increasing trend.
When looking into fire subcategories, the most incidents belonged to: Structure Fires (44.9%), and Outside Fires (35.7%).
Fire incident types reported to NFIRS in Zip Code 47904


 Nearest zip codes: 47901, 47907, 47920, 47905, 47909, 47906.


 Based on the data from the years 2003 - 2017 the average number of fires per year is 34. The highest number of reported fire incidents - 61 took place in 2008, and the least - 5 in 2016. The data has an increasing trend.
 When looking into fire subcategories, the most incidents belonged to: Structure Fires (44.9%), and Outside Fires (35.7%).