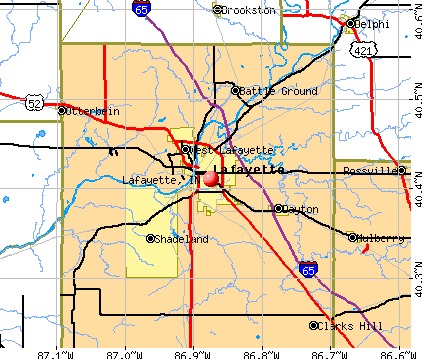
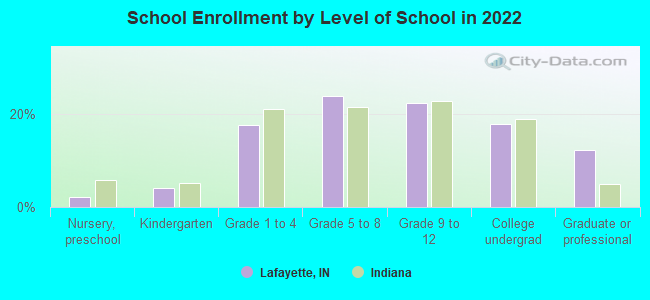
Lafayette, Indiana

Lafayette: Lafayette offers up some lovely night shots

Lafayette: Downtown Lafayette
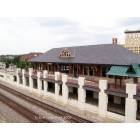
Lafayette: Lafayette Big Four Depot, Centerpiece of the James F. Riehle Plaza.

Lafayette: Five Points Fire Station

Lafayette: Lafayette Skyline
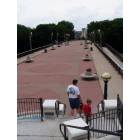
Lafayette: Pedestrian bridge over the Wabash River

Lafayette: Cascada Business Park
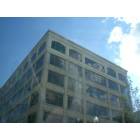
Lafayette: Office Building Downtown

Lafayette: Lafayette (Feburary
- add
your
Submit your own pictures of this city and show them to the world
- OSM Map
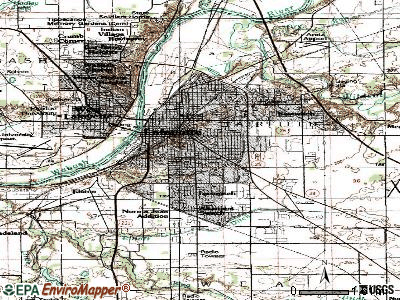
- General Map
- Google Map
- MSN Map
Population change since 2000: +26.6%
 |
| Males: 35,689 | |
| Females: 35,713 |
| Median resident age: | 32.4 years |
| Indiana median age: | 38.2 years |
Zip codes: 47901, 47904, 47909.
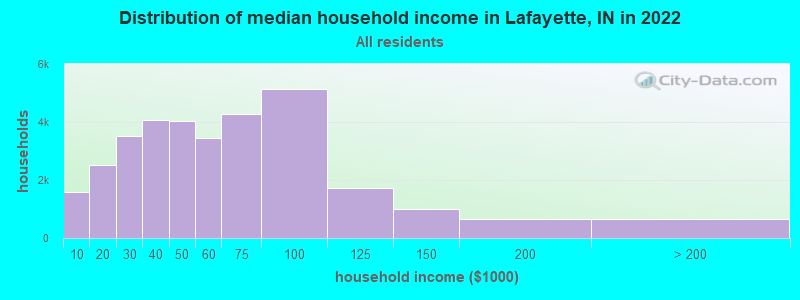
Lafayette Zip Code Map| Lafayette: | $51,439 |
| IN: | $66,785 |
Estimated per capita income in 2022: $27,612 (it was $19,217 in 2000)
Lafayette city income, earnings, and wages data
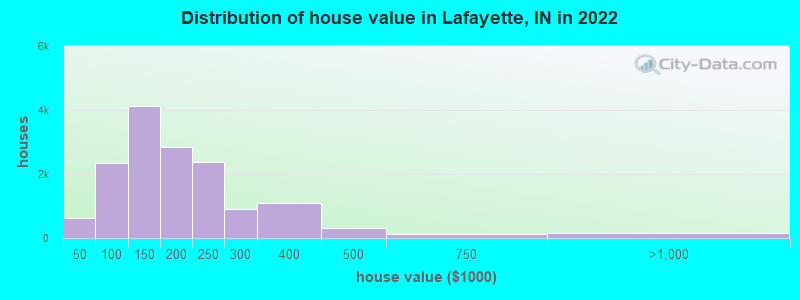
Estimated median house or condo value in 2022: $155,900 (it was $89,300 in 2000)
| Lafayette: | $155,900 |
| IN: | $208,700 |
Mean prices in 2022: all housing units: $184,031; detached houses: $186,099; townhouses or other attached units: $199,406; in 2-unit structures: $111,105; in 3-to-4-unit structures: $153,711; in 5-or-more-unit structures: $212,593; mobile homes: $32,982
Median gross rent in 2022: $1,016.
(13.1% for White Non-Hispanic residents, 38.4% for Black residents, 17.1% for Hispanic or Latino residents, 31.6% for American Indian residents, 7.8% for other race residents, 19.4% for two or more races residents)
Detailed information about poverty and poor residents in Lafayette, IN


Compare current foreclosures in Lafayette, IN:
| Photo | Address | Area | Beds / Baths | Price | Details |
|---|---|---|---|---|---|

|
#1
S 30th St
Lafayette, IN 47904
|
624 sq. feet
|
1 baths 2 beds |
show details | |

|
#2
Stair Rd
Lafayette, IN 47905
|
1,178 sq. feet
|
2 baths 3 beds |
show details | |

|
#3
Walnut Ridge Rd
Lafayette, IN 47909
|
1,624 sq. feet
|
2 baths - beds |
show details | |

|
#4
Pheasant Run Dr Apt 822
Lafayette, IN 47909
|
- sq. feet
|
- baths - beds |
show details | |

|
#5
Scott St
Lafayette, IN 47904
|
- sq. feet
|
- baths - beds |
show details | |

|
#6
Cliburn Rd
Lafayette, IN 47909
|
- sq. feet
|
- baths - beds |
show details | |

|
#7
Waterford Ct Apt B
Lafayette, IN 47905
|
- sq. feet
|
- baths - beds |
show details | |

|
#8
Plantation Way
Lafayette, IN 47909
|
- sq. feet
|
- baths - beds |
show details | |

|
#9
Wyandotte Rd
Lafayette, IN 47905
|
- sq. feet
|
- baths - beds |
show details | |

|
#10
Everett St
Lafayette, IN 47905
|
- sq. feet
|
- baths - beds |
show details |
| Photo | Address | Area | Beds / Baths | Price | Details |
|---|---|---|---|---|---|

|
#11
S 9th St Apt C
Lafayette, IN 47909
|
- sq. feet
|
- baths - beds |
show details | |

|
#12
Cadillac Dr Apt C
Lafayette, IN 47905
|
- sq. feet
|
- baths - beds |
show details | |

|
#13
Lincoln St
Lafayette, IN 47904
|
- sq. feet
|
- baths - beds |
show details | |

|
#14
Glastonbury Way
Lafayette, IN 47909
|
- sq. feet
|
- baths - beds |
show details | |

|
#15
Tantara Way, Apt 104
Lafayette, IN 47909
|
- sq. feet
|
- baths - beds |
show details | |

|
#16
Dakota Dr
Lafayette, IN 47909
|
- sq. feet
|
- baths - beds |
show details | |

|
#17
Ashley Oaks Dr
Lafayette, IN 47905
|
- sq. feet
|
- baths - beds |
show details | |

|
#18
Fretz Ln
Lafayette, IN 47905
|
- sq. feet
|
- baths - beds |
show details | |

|
#19
Starks Cir
Lafayette, IN 47909
|
- sq. feet
|
- baths - beds |
show details | |

|
#20
Radcliff Ct
Lafayette, IN 47909
|
- sq. feet
|
- baths - beds |
show details |
| Photo | Address | Area | Beds / Baths | Price | Details |
|---|---|---|---|---|---|

|
#21
Jett St
Lafayette, IN 47905
|
- sq. feet
|
- baths - beds |
show details | |

|
#22
N 24th St
Lafayette, IN 47904
|
- sq. feet
|
- baths - beds |
show details | |

|
#23
Brunswick Dr # B
Lafayette, IN 47909
|
- sq. feet
|
- baths - beds |
show details | |

|
#24
Union St Apt 325
Lafayette, IN 47904
|
- sq. feet
|
- baths - beds |
show details | |

|
#25
Brady Ln
Lafayette, IN 47909
|
- sq. feet
|
- baths - beds |
show details | |

|
#26
Rainbow Dr
Lafayette, IN 47904
|
- sq. feet
|
- baths - beds |
show details | |

|
#27
E Chauncey Ct
Lafayette, IN 47905
|
- sq. feet
|
- baths - beds |
show details | |

|
#28
Cliburn Rd
Lafayette, IN 47909
|
- sq. feet
|
- baths - beds |
show details | |

|
#29
E 300 S # J7
Lafayette, IN 47909
|
- sq. feet
|
- baths - beds |
show details | |

|
#30
Perrin Ave # 1
Lafayette, IN 47904
|
- sq. feet
|
- baths - beds |
show details |
| Photo | Address | Area | Beds / Baths | Price | Details |
|---|---|---|---|---|---|

|
#31
N 6th St Apt 3
Lafayette, IN 47904
|
- sq. feet
|
- baths - beds |
show details | |

|
#32
Wea School Rd
Lafayette, IN 47909
|
- sq. feet
|
- baths - beds |
show details | |

|
#33
Holly Dr
Lafayette, IN 47909
|
- sq. feet
|
- baths - beds |
show details | |

|
#34
New London Ct Apt 127
Lafayette, IN 47909
|
- sq. feet
|
- baths - beds |
show details | |

|
#35
Dobson Dr
Lafayette, IN 47909
|
- sq. feet
|
- baths - beds |
show details | |

|
#36
Rockingham Ln
Lafayette, IN 47905
|
- sq. feet
|
- baths - beds |
show details | |

|
#37
Autumn Ln
Lafayette, IN 47909
|
- sq. feet
|
- baths - beds |
show details | |

|
#38
S 30th St
Lafayette, IN 47904
|
- sq. feet
|
- baths - beds |
show details | |

|
#39
S 3rd St
Lafayette, IN 47905
|
- sq. feet
|
- baths - beds |
show details | |

|
#40
Kossuth St
Lafayette, IN 47905
|
- sq. feet
|
- baths - beds |
show details |
| Photo | Address | Area | Beds / Baths | Price | Details |
|---|---|---|---|---|---|

|
#41
Hall St
Lafayette, IN 47904
|
- sq. feet
|
- baths - beds |
show details | |

|
#42
Kenilworth Ct
Lafayette, IN 47909
|
- sq. feet
|
- baths - beds |
show details | |

|
#43
Underwood St
Lafayette, IN 47904
|
- sq. feet
|
- baths - beds |
show details | |

|
#44
Sarasota Dr
Lafayette, IN 47909
|
- sq. feet
|
- baths - beds |
show details | |

|
#45
Goldersgreen Dr
Lafayette, IN 47905
|
- sq. feet
|
- baths - beds |
show details | |

|
#46
Yarmouth Ct
Lafayette, IN 47909
|
- sq. feet
|
- baths - beds |
show details | |

|
#47
S 18th St
Lafayette, IN 47909
|
- sq. feet
|
- baths - beds |
show details | |

|
#48
Amethyst Dr
Lafayette, IN 47909
|
- sq. feet
|
- baths - beds |
show details | |

|
#49
S 9th St
Lafayette, IN 47909
|
- sq. feet
|
- baths - beds |
show details | |

|
Check over 1 million property listings on Foreclosure.com!
|
browse all offers | |||


- 49,56968.5%White alone
- 8,60211.9%Black alone
- 8,31611.5%Hispanic
- 3,0474.2%Two or more races
- 2,1773.0%Asian alone
- 3210.4%American Indian alone
- 2940.4%Other race alone
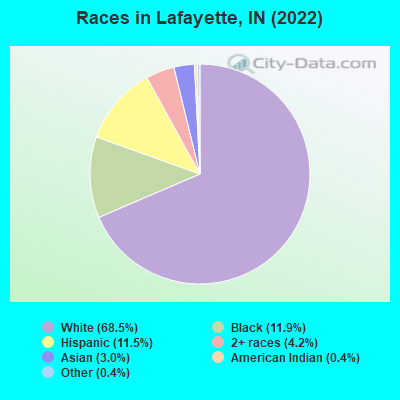
Races in Lafayette detailed stats: ancestries, foreign born residents, place of birth
According to our research of Indiana and other state lists, there were 7 registered sex offenders living in Lafayette, Indiana as of April 27, 2024.
The ratio of all residents to sex offenders in Lafayette is 10,246 to 1.
The ratio of registered sex offenders to all residents in this city is much lower than the state average.
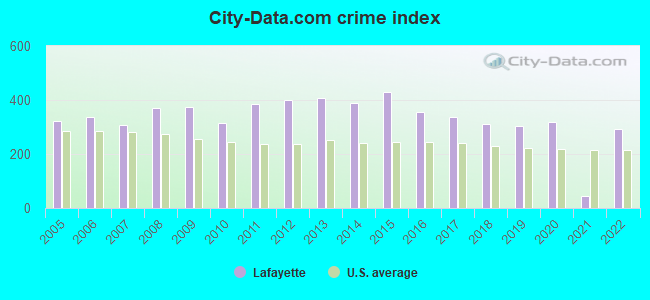
The City-Data.com crime index weighs serious crimes and violent crimes more heavily. Higher means more crime, U.S. average is 246.1. It adjusts for the number of visitors and daily workers commuting into cities.
- means the value is smaller than the state average.- means the value is about the same as the state average.
- means the value is bigger than the state average.
- means the value is much bigger than the state average.
Crime rate in Lafayette detailed stats: murders, rapes, robberies, assaults, burglaries, thefts, arson
Full-time law enforcement employees in 2020, including police officers: 184 (132 officers - 125 male; 7 female).
| Officers per 1,000 residents here: | 1.83 |
| Indiana average: | 2.12 |
 Recent articles from our blog. Our writers, many of them Ph.D. graduates or candidates, create easy-to-read articles on a wide variety of topics.


Latest news from Lafayette, IN collected exclusively by city-data.com from local newspapers, TV, and radio stations
Ancestries: German (17.6%), American (10.1%), English (7.9%), Irish (4.9%), European (2.9%), Polish (1.3%).
Current Local Time: EST time zone
Incorporated in 1853
Elevation: 567 feet
Land area: 20.1 square miles.
Population density: 3,553 people per square mile (average).
6,675 residents are foreign born (4.9% Latin America, 2.4% Asia).
| This city: | 9.3% |
| Indiana: | 5.6% |
Median real estate property taxes paid for housing units with mortgages in 2022: $953 (0.6%)
Median real estate property taxes paid for housing units with no mortgage in 2022: $877 (0.6%)
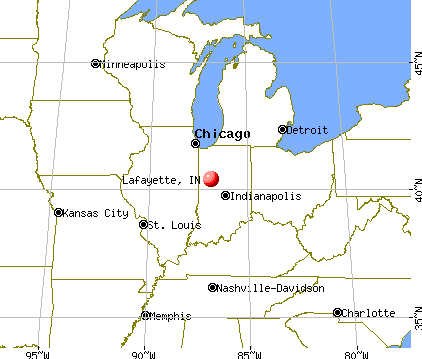
Nearest city with pop. 200,000+: Indianapolis, IN  (57.6 miles , pop. 781,870).
Nearest city with pop. 1,000,000+: Chicago, IL (107.4 miles , pop. 2,896,016).
Nearest cities:
), ), ), )Latitude: 40.41 N, Longitude: 86.87 W
Daytime population change due to commuting: +22,972 (+31.8%)
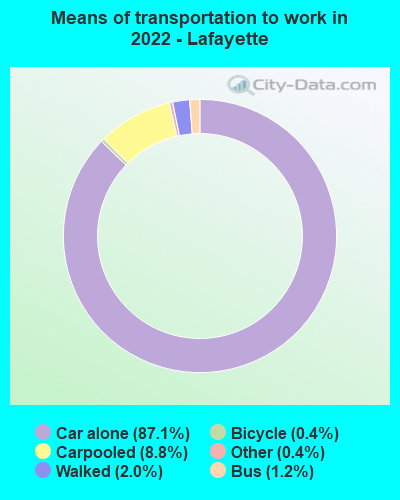
Workers who live and work in this city: 24,067 (68.1%)
Area code: 765

Lafayette tourist attractions:
Lafayette, Indiana accommodation & food services, waste management - Economy and Business Data
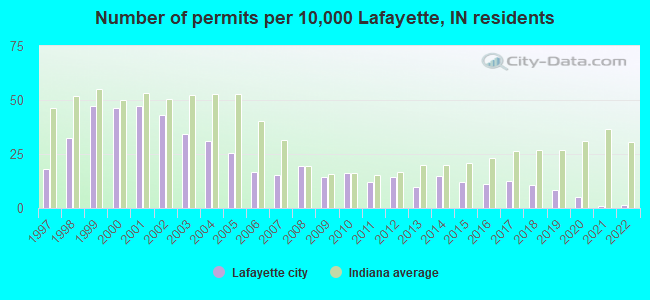
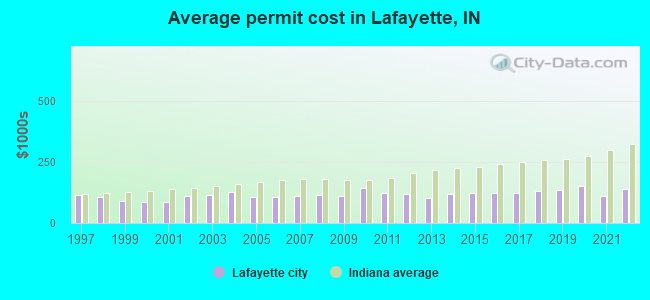
Single-family new house construction building permits:
- 2022: 7 buildings, average cost: $139,400
- 2021: 5 buildings, average cost: $110,000
- 2020: 30 buildings, average cost: $151,200
- 2019: 46 buildings, average cost: $135,400
- 2018: 60 buildings, average cost: $131,300
- 2017: 70 buildings, average cost: $124,300
- 2016: 63 buildings, average cost: $124,100
- 2015: 68 buildings, average cost: $125,000
- 2014: 84 buildings, average cost: $119,300
- 2013: 55 buildings, average cost: $104,200
- 2012: 81 buildings, average cost: $119,100
- 2011: 69 buildings, average cost: $122,300
- 2010: 92 buildings, average cost: $144,200
- 2009: 80 buildings, average cost: $111,000
- 2008: 109 buildings, average cost: $114,000
- 2007: 87 buildings, average cost: $111,900
- 2006: 93 buildings, average cost: $106,700
- 2005: 143 buildings, average cost: $104,500
- 2004: 175 buildings, average cost: $125,700
- 2003: 192 buildings, average cost: $113,600
- 2002: 242 buildings, average cost: $109,200
- 2001: 266 buildings, average cost: $87,100
- 2000: 262 buildings, average cost: $86,600
- 1999: 266 buildings, average cost: $92,100
- 1998: 184 buildings, average cost: $107,200
- 1997: 101 buildings, average cost: $114,500
| Here: | 2.6% |
| Indiana: | 2.8% |
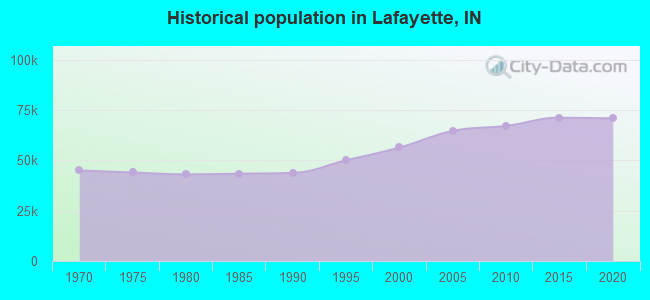
Population change in the 1990s: +6,644 (+13.4%).
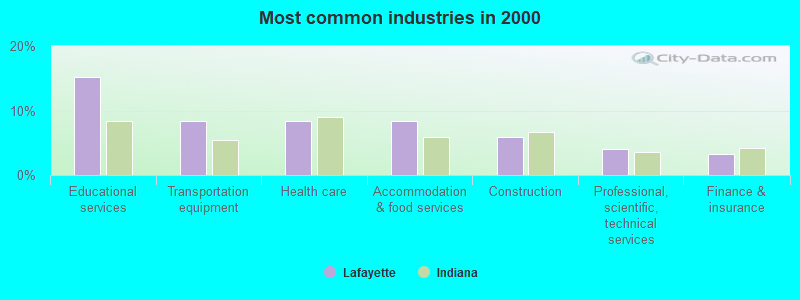
- Educational services (15.3%)
- Transportation equipment (8.4%)
- Health care (8.4%)
- Accommodation & food services (8.3%)
- Construction (5.9%)
- Professional, scientific, technical services (4.0%)
- Finance & insurance (3.2%)
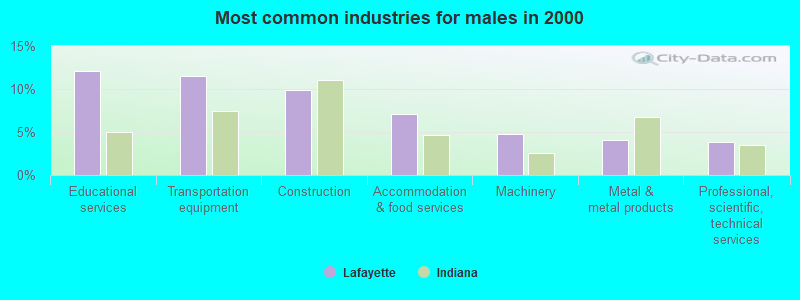
- Educational services (12.1%)
- Transportation equipment (11.5%)
- Construction (9.9%)
- Accommodation & food services (7.1%)
- Machinery (4.8%)
- Metal & metal products (4.1%)
- Professional, scientific, technical services (3.9%)
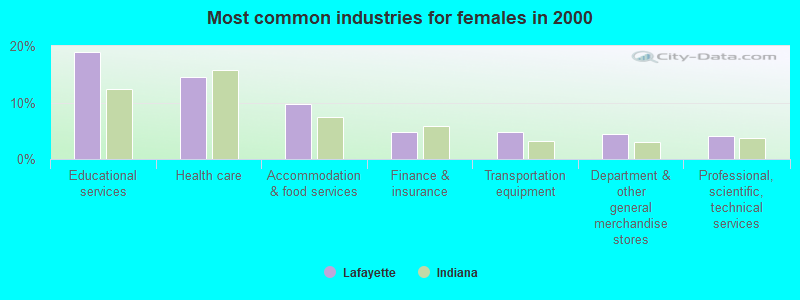
- Educational services (19.0%)
- Health care (14.5%)
- Accommodation & food services (9.7%)
- Finance & insurance (4.8%)
- Transportation equipment (4.7%)
- Department & other general merchandise stores (4.4%)
- Professional, scientific, technical services (4.1%)
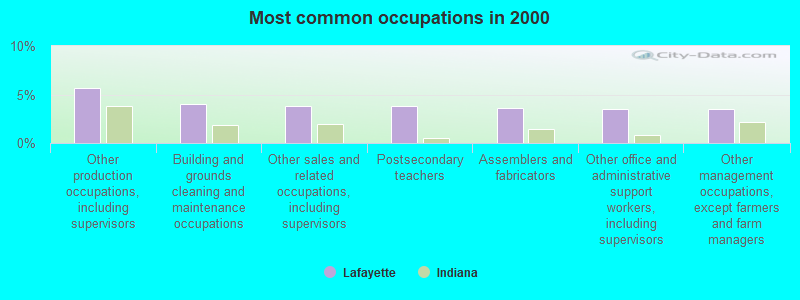
- Other production occupations, including supervisors (5.7%)
- Building and grounds cleaning and maintenance occupations (4.0%)
- Other sales and related occupations, including supervisors (3.8%)
- Postsecondary teachers (3.8%)
- Assemblers and fabricators (3.7%)
- Other office and administrative support workers, including supervisors (3.6%)
- Other management occupations, except farmers and farm managers (3.5%)
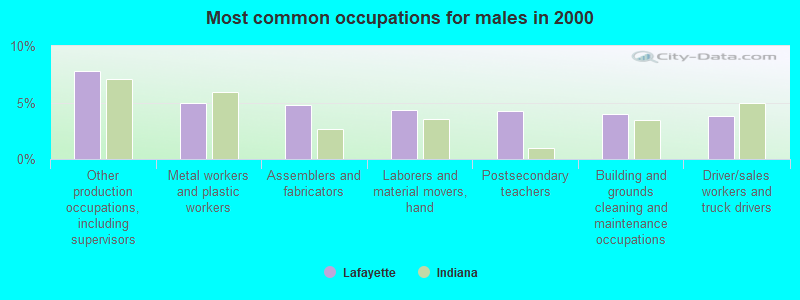
- Other production occupations, including supervisors (7.8%)
- Metal workers and plastic workers (5.0%)
- Assemblers and fabricators (4.8%)
- Laborers and material movers, hand (4.3%)
- Postsecondary teachers (4.3%)
- Building and grounds cleaning and maintenance occupations (4.0%)
- Driver/sales workers and truck drivers (3.8%)

- Secretaries and administrative assistants (5.4%)
- Other office and administrative support workers, including supervisors (4.8%)
- Other sales and related occupations, including supervisors (4.1%)
- Building and grounds cleaning and maintenance occupations (4.1%)
- Registered nurses (3.7%)
- Other management occupations, except farmers and farm managers (3.6%)
- Retail sales workers, except cashiers (3.5%)
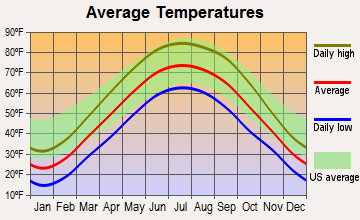
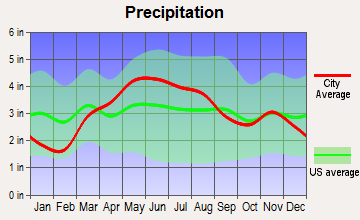
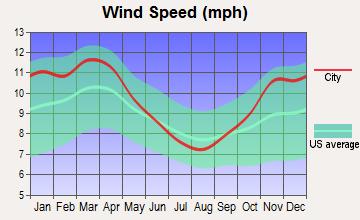
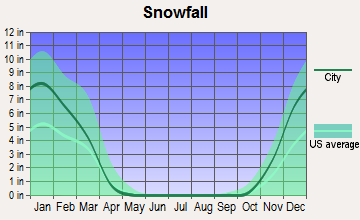
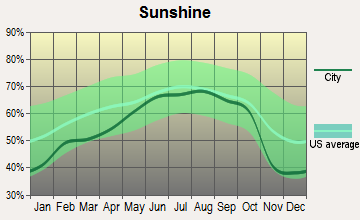
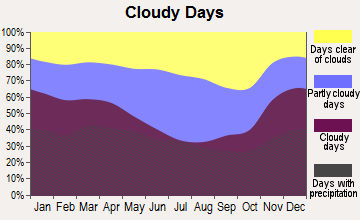
Average climate in Lafayette, Indiana
Based on data reported by over 4,000 weather stations

|
|

(lower is better)
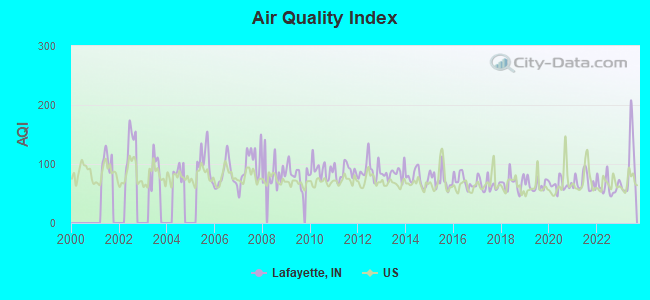
Air Quality Index (AQI) level in 2023 was 95.9. This is worse than average.
| City: | 95.9 |
| U.S.: | 72.6 |
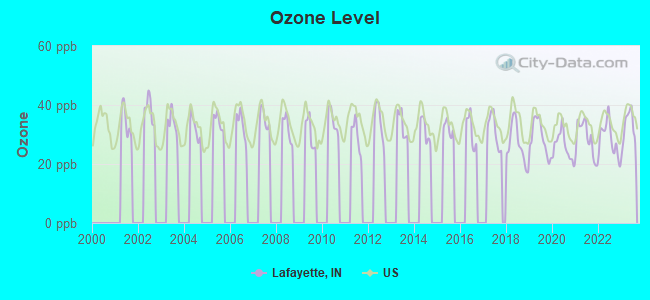
Ozone [ppb] level in 2023 was 32.5. This is about average. Closest monitor was 2.0 miles away from the city center.
| City: | 32.5 |
| U.S.: | 33.3 |
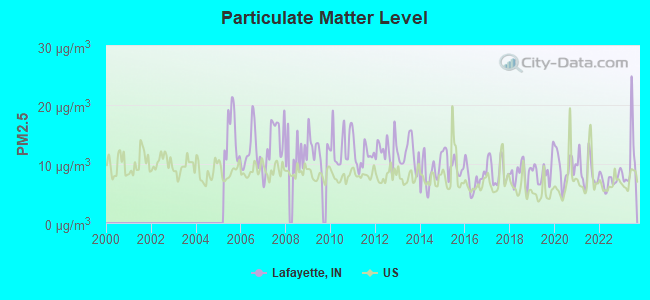
Particulate Matter (PM2.5) [µg/m3] level in 2023 was 10.6. This is worse than average. Closest monitor was 1.1 miles away from the city center.
| City: | 10.6 |
| U.S.: | 8.1 |
Tornado activity:
Lafayette-area historical tornado activity is near Indiana state average. It is 104% greater than the overall U.S. average.
On 4/11/1965, a category F4 (max. wind speeds 207-260 mph) tornado 6.1 miles away from the Lafayette city center injured 44 people.
On 4/26/1994, a category F4 tornado 6.2 miles away from the city center killed 3 people and injured 70 people and caused between $500,000 and $5,000,000 in damages.
Earthquake activity:
Lafayette-area historical earthquake activity is significantly above Indiana state average. It is 58% greater than the overall U.S. average.On 4/18/2008 at 09:36:59, a magnitude 5.4 (5.1 MB, 4.8 MS, 5.4 MW, 5.2 MW, Class: Moderate, Intensity: VI - VII) earthquake occurred 145.8 miles away from Lafayette center
On 6/10/1987 at 23:48:54, a magnitude 5.1 (4.9 MB, 4.4 MS, 4.6 MS, 5.1 LG) earthquake occurred 122.4 miles away from Lafayette center
On 4/18/2008 at 09:36:59, a magnitude 5.2 (5.2 MW, Depth: 8.9 mi) earthquake occurred 145.9 miles away from Lafayette center
On 6/18/2002 at 17:37:15, a magnitude 5.0 (4.3 MB, 4.6 MW, 5.0 LG) earthquake occurred 174.5 miles away from the city center
On 7/27/1980 at 18:52:21, a magnitude 5.2 (5.1 MB, 4.7 MS, 5.0 UK, 5.2 UK) earthquake occurred 218.8 miles away from the city center
On 4/18/2008 at 15:14:16, a magnitude 4.8 (4.5 MB, 4.8 MW, 4.6 MW, Class: Light, Intensity: IV - V) earthquake occurred 143.5 miles away from the city center
Magnitude types: regional Lg-wave magnitude (LG), body-wave magnitude (MB), surface-wave magnitude (MS), moment magnitude (MW)
Natural disasters:
The number of natural disasters in Tippecanoe County (12) is smaller than the US average (15).Major Disasters (Presidential) Declared: 8
Emergencies Declared: 3
Causes of natural disasters: Floods: 6, Storms: 6, Tornadoes: 3, Winter Storms: 2, Hurricane: 1, Ice Storm: 1, Snow: 1, Other: 1 (Note: some incidents may be assigned to more than one category).
Main business address for: LSB FINANCIAL CORP (SAVINGS INSTITUTION, FEDERALLY CHARTERED), WABASH NATIONAL CORP /DE (TRUCK TRAILERS).
Hospitals in Lafayette:
- ARNETT SURGERY CENTER, LLC (1327 SOUTH 500 EAST)
- FRANCISCAN ST ELIZABETH HEALTH - LAFAYETTE CENTRAL (Voluntary non-profit - Church, provides emergency services, 1501 HARTFORD ST)
- FRANCISCAN ST ELIZABETH HEALTH - LAFAYETTE EAST (Voluntary non-profit - Church, provides emergency services, 1701 S CREASY LN)
- INDIANA UNIVERSITY HEALTH ARNETT HOSPITAL (Voluntary non-profit - Private, provides emergency services, 5165 MCCARTY LN)
- REM-INDIANA INC (3938 PRANGE AVE)
- REM-INDIANA INC (926 S TENTH ST)
- SOUTHERNCARE PURDUE (180 PROFESSIONAL COURT)
- ST ELIZABETH HOSPICE (1415 SALEM STREET, SUITE 202W)
- UNITY SURGICAL CENTER (1411 SOUTH CREASY LANE, SUITE 200)
- VISITING NURSE HOSPICE LAFAYETTE (2323 SHOSHONE COURT)
- WABASH CENTER INC (744 S 26TH ST)
Airports and heliports located in Lafayette:
- Purdue University Airport (LAF) (Runways: 2, Commercial Ops: 52, Air Taxi Ops: 564, Itinerant Ops: 30,590, Local Ops: 65,082, Military Ops: 105)
- Ratcliff Airport (IG02) (Runways: 1)
- Timber House Airport (31IN) (Runways: 1)
- Wyandotte Airport (6IN3) (Runways: 1)
- Findlay Heliport (15II)
- Indiana University Health Arnett Heliport (8IN1)
- Saint Elizabeth East Heliport (76IN)
- Wolfelt Heliport (IG06)
Colleges/Universities in Lafayette:
Colleges/universities with over 2000 students nearest to Lafayette:
- Purdue University-Main Campus (about 3 miles; West Lafayette, IN; Full-time enrollment: 38,271)
- Indiana University-Kokomo (about 40 miles; Kokomo, IN; FT enrollment: 2,500)
- Danville Area Community College (about 43 miles; Danville, IL; FT enrollment: 2,229)
- ITT Technical Institute-Indianapolis (about 49 miles; Indianapolis, IN; FT enrollment: 4,765)
- DePauw University (about 54 miles; Greencastle, IN; FT enrollment: 2,360)
- Butler University (about 55 miles; Indianapolis, IN; FT enrollment: 4,388)
- Marian University (about 55 miles; Indianapolis, IN; FT enrollment: 2,476)
Public high schools in Lafayette:
- JEFFERSON HIGH SCHOOL (Students: 2,380, Location: 1801 S 18TH ST, Grades: 9-12)
- MCCUTCHEON HIGH SCHOOL (Students: 1,713, Location: 4951 US 231 S, Grades: 9-12)
- THE EXCEL CENTER - LAFAYETTE (Location: 615 N 18TH ST 2ND FLOOR, Grades: 9-12, Charter school)
- OAKLAND HIGH SCHOOL (Location: 611 S 21ST ST, Grades: 9-12)
Private high schools in Lafayette:
- FAITH CHRISTIAN SCHOOL (Students: 695, Location: 5526 STATE ROAD 26 E, Grades: PK-12)
- CENTRAL CATHOLIC JR SR HIGH SCHOOL (Students: 360, Location: 2410 S 9TH ST, Grades: 7-12)
Biggest public elementary/middle schools in Lafayette:
- LAFAYETTE TECUMSEH JR HIGH SCH (Students: 1,171, Location: 2101 S 18TH ST/TEAL RD, Grades: 7-8)
- WEA RIDGE ELEMENTARY SCHOOL (Students: 881, Location: 1333 E 430 S, Grades: KG-5)
- HERSHEY ELEMENTARY SCHOOL (Students: 753, Location: 7521 E 300 N, Grades: KG-5)
- MAYFLOWER MILL ELEM SCH (Students: 708, Location: 200 E 500 S, Grades: KG-5)
- WEA RIDGE MIDDLE SCHOOL (Students: 598, Location: 4410 S 150 E, Grades: 6-8)
- EDGELEA ELEMENTARY SCHOOL (Students: 586, Location: 2910 S 18TH ST, Grades: KG-4)
- LAFAYETTE SUNNYSIDE INTERMEDIATE (Students: 529, Location: 530 N 26TH ST, Grades: 5-6)
- VINTON ELEMENTARY SCHOOL (Students: 500, Location: 3101 ELMWOOD AVE, Grades: KG-4)
- GLEN ACRES ELEMENTARY SCHOOL (Students: 497, Location: 3767 KIMBERLY DR, Grades: KG-4)
- MIAMI ELEMENTARY SCHOOL (Students: 478, Location: 2401 BECK LN, Grades: KG-4)
Private elementary/middle schools in Lafayette:
- ST LAWRENCE ELEMENTARY SCHOOL (Students: 284, Location: 1902 MEHARRY ST, Grades: PK-6)
- LAFAYETTE CHRISTIAN SCHOOL (Students: 281, Location: 525 N 26TH ST, Grades: PK-8)
- ST MARY CATHEDRAL ELEMENTARY SCHOOL (Students: 242, Location: 1200 SOUTH ST, Grades: PK-3)
- ST JAMES LUTHERAN ELEMENTARY SCHOOL (Students: 216, Location: 615 N 8TH ST, Grades: PK-8)
- ST BONIFACE SCHOOL (Students: 130, Location: 813 NORTH ST, Grades: 4-6)
- TIPPECANOE CHRISTIAN SCHOOL (Students: 85, Location: 108 BECK LN, Grades: PK-8)
User-submitted facts and corrections:
- Health care centers: Unity Healthcare 1450 South Creasy Lane
- Faith Christian School is now Grades K4-12 with 518 students (2003-2004 enrolment).
- WLFI-TV (Channel 18; LAFAYETTE, IN; Owner: PRIMELAND TELEVISION, INC.) This station is now showing owned by Lin Television Broadcasting - per their website
Points of interest:
Notable locations in Lafayette: Lafayette Country Club (A), Lafayette Fire Department Station 8 (B), Lafayette Fire Department Station 1 (C), Saint Vincent Seton Specialty Hospital Lafayette Campus (D), Knights of Pythias Home (E), Lafayette Fire Department Station 7 (F), Lafayette Fire Department Station 3 (G), Lafayette Fire Department Station 5 (H), Lafayette Fire Department Station 2 (I), Bennett's Greenhouse (J). Display/hide their locations on the map
Shopping Centers: Ayr-Way Lafayette Shopping Center (1), Market Square Shopping Center (2), Mar-Jean Shopping Center (3). Display/hide their locations on the map
Main business address in Lafayette include: LSB FINANCIAL CORP (A), WABASH NATIONAL CORP /DE (B). Display/hide their locations on the map
Churches in Lafayette include: Bethany Church (A), Grace Church (B), Christ Memorial Temple (C), Kingdom Hall Church (D), Saint Lawrence Convent (E). Display/hide their locations on the map
Cemeteries: Resthaven Memorial Park (1), Fink Cemetery (2). Display/hide their locations on the map
Parks in Lafayette include: Columbian Park (1), Murdock Park (2). Display/hide their locations on the map
Tourist attractions: Historic Five Points Fire Museum (1511 Main Street) (1), Art Museum of Greater Lafayette (102 South 10th Street) (2), Imagination Station (Museums; 600 North 4th Street) (3). Display/hide their approximate locations on the map
Hotels: Holiday Inn Express Lafayette (201 Frontage Road) (1), Howard Johnson (4343 State Road 26 East) (2), Days Inn Suites Lafayette IN (151 Frontage Road) (3), Signature Inn Lafayette (4320 State Road 26 East) (4), Howard Johnson Plaza Hotel (4343 State Road 26 East) (5), Homewood Suites Lafayette- Indiana (3939 State Road 26 East) (6), Knights Inn (4110 State Road 26 East) (7), Comfort Suites Lafayette (31 Frontage Road) (8), Ramada Inn (4221 State Rd 26 E) (9). Display/hide their approximate locations on the map
Courts: Marshals Service (Federal Building) (1), Indiana State - West Lafayette (720 West Navajo Street) (2), Courts - Federal - District Court- Clerk's Office Information (230 North 4th Street Side) (3), U S Government - District Court- Judge (Federal Building) (4), Tippecanoe County - Casa- Courts- Superior Court 6 (Courthouse) (5), Federal Bureau Of Investigation (232 North 4th Street) (6), Tippecanoe County - Courts- Circuit Court (301 Main Street) (7), U S Government - Court Of Appeals- Judge (Federal Building) (8). Display/hide their approximate locations on the map
Birthplace of: Izzy Stradlin - Rock musician, Axl Rose - Singer-songwriter, Brian Lamb - Television personality, Sydney Pollack - Actor, Donald E. Williams - Astronaut, Josh Lindblom - Baseball player, Dustin Keller - Football player, Embeth Davidtz - Actress, Brandon Wagner - Racing driver, Bruce Rogers (typographer) - Graphic designer.
Drinking water stations with addresses in Lafayette and their reported violations in the past:
MODERNAIRE TRAILER COURT (Population served: 105, Groundwater):Past monitoring violations:
- Monitoring, Repeat Major (TCR) - In NOV-2006, Contaminant: Coliform (TCR). Follow-up actions: St Public Notif requested (JAN-09-2007), St Violation/Reminder Notice (JAN-09-2007), St Public Notif received (JAN-15-2007), St Compliance achieved (JUL-26-2012)
- 4 routine major monitoring violations
- 21 regular monitoring violations
Drinking water stations with addresses in Lafayette that have no violations reported:
- LAFAYETTE WATER WORKS (Population served: 57,000, Primary Water Source Type: Groundwater)
| This city: | 2.3 people |
| Indiana: | 2.5 people |
| This city: | 55.6% |
| Whole state: | 66.9% |
| This city: | 9.3% |
| Whole state: | 6.9% |
Likely homosexual households (counted as self-reported same-sex unmarried-partner households)
- Lesbian couples: 0.5% of all households
- Gay men: 0.3% of all households
People in group quarters in Lafayette in 2010:
- 493 people in local jails and other municipal confinement facilities
- 477 people in nursing facilities/skilled-nursing facilities
- 161 people in other noninstitutional facilities
- 110 people in emergency and transitional shelters (with sleeping facilities) for people experiencing homelessness
- 74 people in group homes intended for adults
- 64 people in residential treatment centers for juveniles (non-correctional)
- 24 people in group homes for juveniles (non-correctional)
- 22 people in residential treatment centers for adults
- 8 people in workers' group living quarters and job corps centers
People in group quarters in Lafayette in 2000:
- 505 people in nursing homes
- 100 people in other noninstitutional group quarters
- 39 people in homes or halfway houses for drug/alcohol abuse
- 22 people in homes for the mentally retarded
- 19 people in orthopedic wards and institutions for the physically handicapped
- 13 people in homes for the mentally ill
- 8 people in religious group quarters
- 3 people in other nonhousehold living situations
Banks with most branches in Lafayette (2011 data):
- First Merchants Bank National Association: 7 branches. Info updated 2012/02/13: Bank assets: $4,154.9 mil, Deposits: $3,154.7 mil, headquarters in Muncie, IN, positive income, Commercial Lending Specialization, 89 total offices, Holding Company: First Merchants Corporation
- Regions Bank: Teal Road Branch, Creasey Lane Banking Center Branch, Downtown Branch, Union Street Branch, 350 South Branch. Info updated 2011/02/24: Bank assets: $123,368.2 mil, Deposits: $98,301.3 mil, headquarters in Birmingham, AL, positive income, Commercial Lending Specialization, 1778 total offices, Holding Company: Regions Financial Corporation
- JPMorgan Chase Bank, National Association: Sagamore Parkway South, Sagamore Branch, Jefferson Square Branch, Lafayette Main Branch. Info updated 2011/11/10: Bank assets: $1,811,678.0 mil, Deposits: $1,190,738.0 mil, headquarters in Columbus, OH, positive income, International Specialization, 5577 total offices, Holding Company: Jpmorgan Chase & Co.
- Lafayette Savings Bank, FSB: State Road 38 East Branch, Sagamore Parkway Branch, Lafayette Savings Bank, Fsb, Twyckenham Boulevard Branch. Info updated 2011/07/21: Bank assets: $364.3 mil, Deposits: $309.6 mil, local headquarters, positive income, Commercial Lending Specialization, 5 total offices
- Old National Bank: Lafayette Pavilions Branch, 350 S. And Concord Road Branch, Teal Road-Lafayette/Marsh Branch. Info updated 2011/08/01: Bank assets: $8,467.9 mil, Deposits: $6,653.1 mil, headquarters in Evansville, IN, positive income, 195 total offices, Holding Company: Old National Bancorp
- Salin Bank and Trust Company: Lafayette Branch, Braddock Branch, Creasy Lane Branch. Info updated 2006/11/03: Bank assets: $851.0 mil, Deposits: $677.9 mil, headquarters in Indianapolis, IN, positive income, Commercial Lending Specialization, 23 total offices, Holding Company: Salin Bancshares, Inc.
- LAFAYETTE COMMUNITY BANK: Lafayette Community Bank, 350 South Branch, Greenbush Branch. Info updated 2006/11/03: Bank assets: $135.5 mil, Deposits: $119.7 mil, local headquarters, positive income, Commercial Lending Specialization, 4 total offices, Holding Company: Lafayette Community Bancorp
- The Fountain Trust Company: Lafayette Branch at 811 North Creasy Lane, branch established on 1989/10/28; Ferry Street Lafayette Branch at 302 Ferry Street, branch established on 2010/07/12. Info updated 2010/06/02: Bank assets: $260.2 mil, Deposits: $226.1 mil, headquarters in Covington, IN, positive income, Agricultural Specialization, 11 total offices, Holding Company: Piper Holdings, Inc.
- The Huntington National Bank: Teal Road Branch at 2101 Teal Road, branch established on 1892/01/01; Lafayette Main Branch at 101 North 4th Street, branch established on 1892/01/01. Info updated 2012/04/02: Bank assets: $54,183.4 mil, Deposits: $44,300.3 mil, headquarters in Columbus, OH, positive income, Commercial Lending Specialization, 878 total offices, Holding Company: Huntington Bancshares Incorporated
- 6 other banks with 8 local branches
For population 15 years and over in Lafayette:
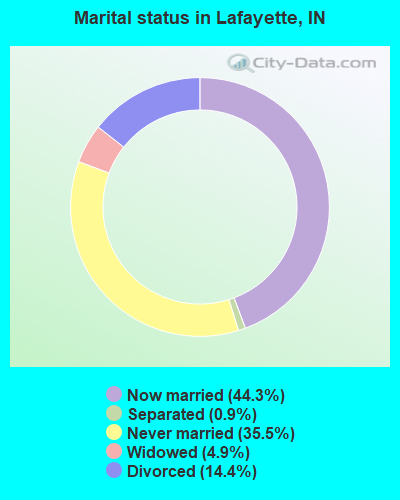
- Never married: 35.5%
- Now married: 44.3%
- Separated: 0.9%
- Widowed: 4.9%
- Divorced: 14.4%
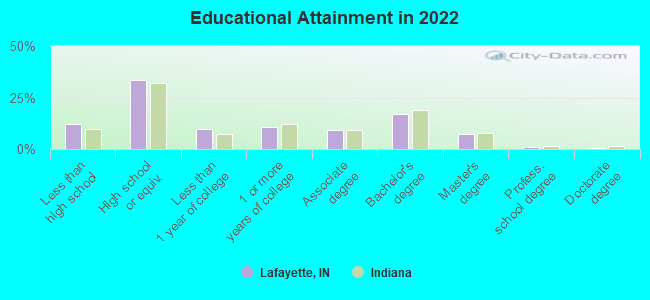
For population 25 years and over in Lafayette:
- High school or higher: 87.9%
- Bachelor's degree or higher: 25.4%
- Graduate or professional degree: 8.2%
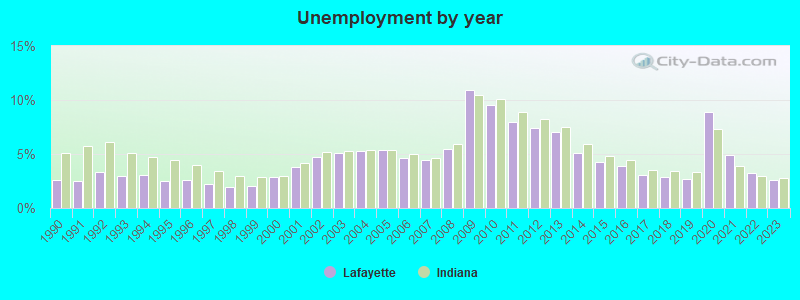
- Unemployed: 4.5%
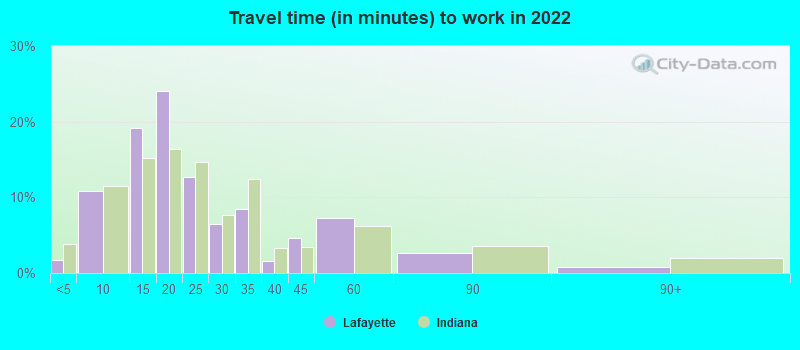
- Mean travel time to work (commute): 15.4 minutes
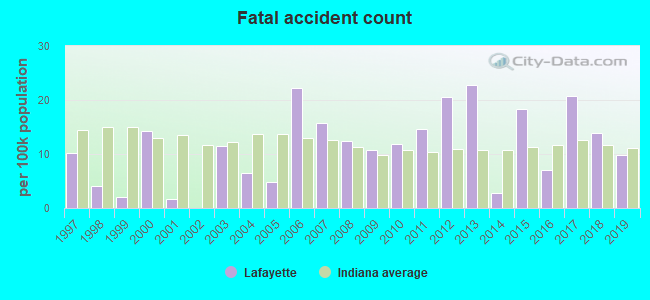
| Here: | 11.8 |
| Indiana average: | 11.3 |
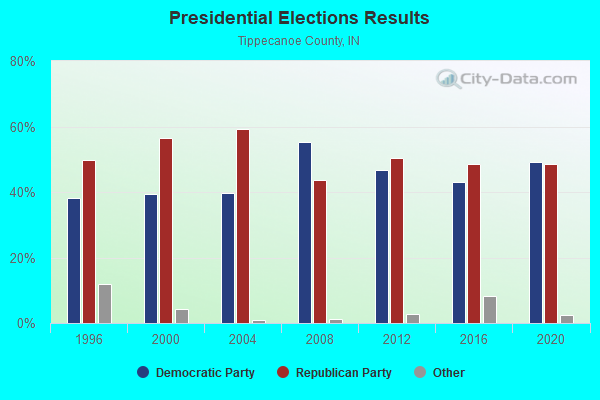
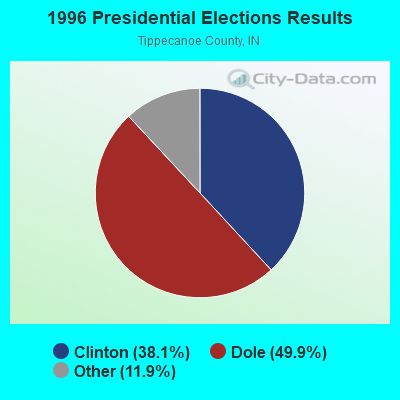
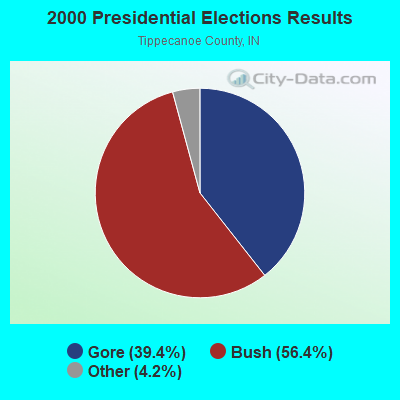
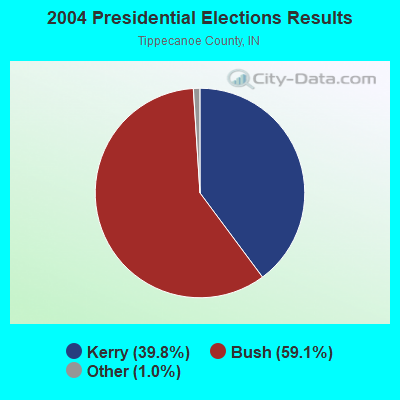
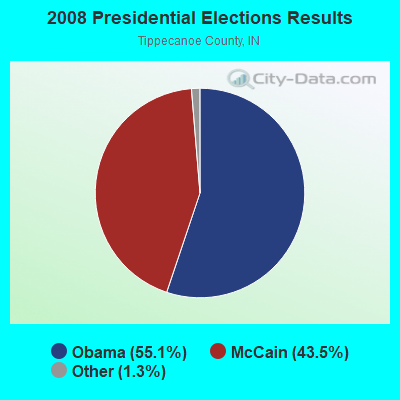
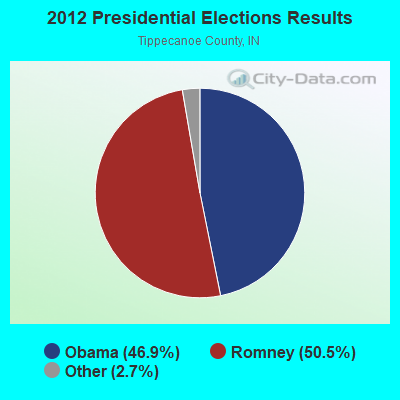
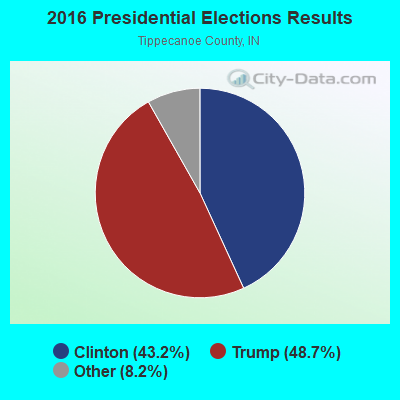
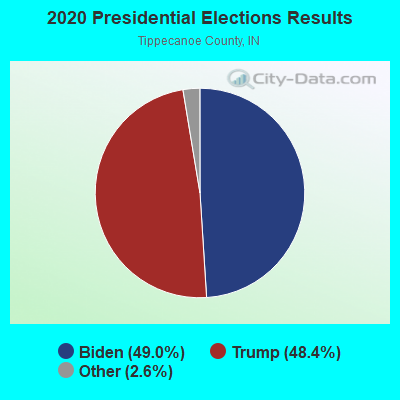
Graphs represent county-level data. Detailed 2008 Election Results
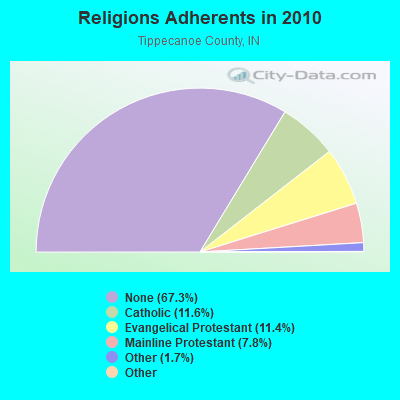
Religion statistics for Lafayette, IN (based on Tippecanoe County data)
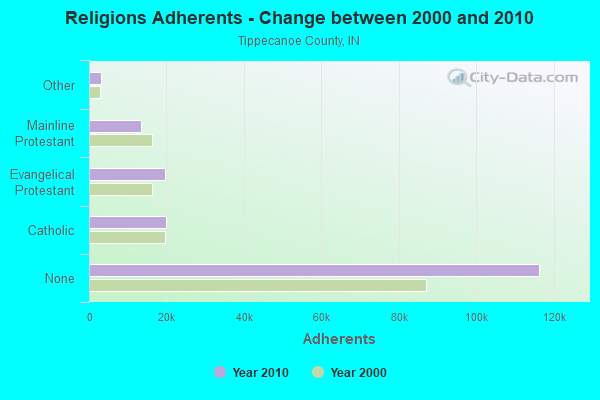
| Religion | Adherents | Congregations |
|---|---|---|
| Catholic | 20,011 | 6 |
| Evangelical Protestant | 19,710 | 79 |
| Mainline Protestant | 13,499 | 36 |
| Other | 2,996 | 16 |
| Orthodox | 135 | 1 |
| Black Protestant | 119 | 1 |
| None | 116,310 | - |
Food Environment Statistics:
| This county: | 1.30 / 10,000 pop. |
| State: | 1.73 / 10,000 pop. |
| This county: | 0.25 / 10,000 pop. |
| State: | 0.21 / 10,000 pop. |
| Tippecanoe County: | 0.68 / 10,000 pop. |
| Indiana: | 0.50 / 10,000 pop. |
| Tippecanoe County: | 1.91 / 10,000 pop. |
| Indiana: | 3.57 / 10,000 pop. |
| Tippecanoe County: | 7.40 / 10,000 pop. |
| State: | 6.78 / 10,000 pop. |
| Tippecanoe County: | 6.9% |
| Indiana: | 9.2% |
| Here: | 27.6% |
| State: | 29.0% |
| Tippecanoe County: | 15.2% |
| Indiana: | 14.3% |
Health and Nutrition:
| Lafayette: | 47.3% |
| State: | 49.3% |
| This city: | 43.2% |
| Indiana: | 46.2% |
| Lafayette: | 28.5 |
| Indiana: | 28.7 |
| This city: | 21.0% |
| Indiana: | 21.3% |
| This city: | 12.0% |
| State: | 10.6% |
| Lafayette: | 6.8 |
| Indiana: | 6.8 |
| Here: | 31.3% |
| State: | 33.9% |
| Lafayette: | 55.1% |
| State: | 56.1% |
| This city: | 78.6% |
| Indiana: | 78.7% |
More about Health and Nutrition of Lafayette, IN Residents
| Local government employment and payroll (March 2022) | |||||
| Function | Full-time employees | Monthly full-time payroll | Average yearly full-time wage | Part-time employees | Monthly part-time payroll |
|---|---|---|---|---|---|
| Firefighters | 136 | $840,915 | $74,198 | 0 | $0 |
| Police Protection - Officers | 130 | $953,416 | $88,008 | 0 | $0 |
| Transit | 114 | $623,809 | $65,664 | 9 | $16,366 |
| Sewerage | 67 | $351,516 | $62,958 | 1 | $146 |
| Police - Other | 49 | $217,445 | $53,252 | 51 | $39,439 |
| Streets and Highways | 48 | $208,763 | $52,191 | 0 | $0 |
| Other and Unallocable | 45 | $233,607 | $62,295 | 3 | $3,837 |
| Parks and Recreation | 41 | $197,915 | $57,926 | 21 | $22,386 |
| Water Supply | 37 | $195,716 | $63,475 | 0 | $0 |
| Financial Administration | 27 | $154,362 | $68,605 | 1 | $1,867 |
| Solid Waste Management | 27 | $116,624 | $51,833 | 0 | $0 |
| Other Government Administration | 10 | $63,984 | $76,781 | 14 | $13,839 |
| Housing and Community Development (Local) | 5 | $29,727 | $71,345 | 1 | $210 |
| Fire - Other | 5 | $27,898 | $66,955 | 4 | $724 |
| Judicial and Legal | 1 | $4,239 | $50,868 | 0 | $0 |
| Totals for Government | 742 | $4,219,936 | $68,247 | 105 | $98,814 |
Lafayette government finances - Expenditure in 2021 (per resident):
- Construction - General - Other: $17,591,000 ($246.37)
Regular Highways: $237,000 ($3.32)
- Current Operations - Water Utilities: $23,978,000 ($335.82)
General - Other: $18,455,000 ($258.47)
Police Protection: $17,342,000 ($242.88)
Local Fire Protection: $14,916,000 ($208.90)
Transit Utilities: $11,829,000 ($165.67)
Parks and Recreation: $5,029,000 ($70.43)
Financial Administration: $4,279,000 ($59.93)
Solid Waste Management: $2,563,000 ($35.90)
Regular Highways: $1,497,000 ($20.97)
Housing and Community Development: $1,125,000 ($15.76)
Health - Other: $417,000 ($5.84)
Parking Facilities: $383,000 ($5.36)
Central Staff Services: $355,000 ($4.97)
- General - Interest on Debt: $7,347,000 ($102.90)
- Other Capital Outlay - General - Other: $1,297,000 ($18.16)
Regular Highways: $89,000 ($1.25)
Police Protection: $15,000 ($0.21)
Local Fire Protection: $10,000 ($0.14)
Parks and Recreation: $9,000 ($0.13)
Health - Other: $8,000 ($0.11)
Solid Waste Management: $3,000 ($0.04)
- Total Salaries and Wages: $5,970,000 ($83.61)
Lafayette government finances - Revenue in 2021 (per resident):
- Charges - Other: $38,602,000 ($540.63)
Parks and Recreation: $766,000 ($10.73)
Parking Facilities: $339,000 ($4.75)
- Federal Intergovernmental - Transit Utilities: $4,137,000 ($57.94)
Other: $265,000 ($3.71)
- Local Intergovernmental - Highways: $1,005,000 ($14.08)
- Miscellaneous - General Revenue - Other: $26,492,000 ($371.03)
Fines and Forfeits: $432,000 ($6.05)
Interest Earnings: $264,000 ($3.70)
Rents: $121,000 ($1.69)
Sale of Property: $109,000 ($1.53)
Donations From Private Sources: $75,000 ($1.05)
- Revenue - Water Utilities: $16,552,000 ($231.81)
Transit Utilities: $3,052,000 ($42.74)
- State Intergovernmental - Other: $27,051,000 ($378.85)
Highways: $6,967,000 ($97.57)
Transit Utilities: $4,252,000 ($59.55)
General Local Government Support: $2,923,000 ($40.94)
- Tax - Property: $50,651,000 ($709.38)
Other: $767,000 ($10.74)
Other License: $456,000 ($6.39)
Public Utilities Sales: $428,000 ($5.99)
Occupation and Business License - Other: $20,000 ($0.28)
Lafayette government finances - Debt in 2021 (per resident):
- Long Term Debt - Beginning Outstanding - Unspecified Public Purpose: $213,673,000 ($2992.54)
Outstanding Unspecified Public Purpose: $213,403,000 ($2988.75)
Beginning Outstanding - Public Debt for Private Purpose: $9,205,000 ($128.92)
Outstanding Nonguaranteed - Industrial Revenue: $7,900,000 ($110.64)
Retired Nonguaranteed - Public Debt for Private Purpose: $1,305,000 ($18.28)
Retired Unspecified Public Purpose: $270,000 ($3.78)
- Short Term Debt Outstanding - End of Fiscal Year: $752,000 ($10.53)
Beginning: $726,000 ($10.17)
Lafayette government finances - Cash and Securities in 2021 (per resident):
- Bond Funds - Cash and Securities: $12,251,000 ($171.58)
- Other Funds - Cash and Securities: $72,242,000 ($1011.76)
- Sinking Funds - Cash and Securities: $17,859,000 ($250.12)
| Businesses in Lafayette, IN | ||||
| Name | Count | Name | Count | |
|---|---|---|---|---|
| ALDI | 1 | La Quinta | 1 | |
| AT&T | 5 | La-Z-Boy | 1 | |
| Abercrombie & Fitch | 1 | Lane Bryant | 1 | |
| Ace Hardware | 1 | Lane Furniture | 2 | |
| Advance Auto Parts | 2 | LensCrafters | 1 | |
| Aeropostale | 1 | Little Caesars Pizza | 2 | |
| American Eagle Outfitters | 1 | Long John Silver's | 1 | |
| Applebee's | 1 | Lowe's | 1 | |
| Arby's | 2 | Macy's | 1 | |
| Audi | 1 | Marriott | 3 | |
| AutoZone | 2 | MasterBrand Cabinets | 17 | |
| BMW | 1 | Maurices | 1 | |
| Barnes & Noble | 1 | Mazda | 1 | |
| Bath & Body Works | 1 | McDonald's | 5 | |
| Baymont Inn | 1 | Meijer | 1 | |
| Bed Bath & Beyond | 1 | Men's Wearhouse | 1 | |
| Best Western | 1 | Menards | 1 | |
| Blockbuster | 1 | Motel 6 | 1 | |
| Buffalo Wild Wings | 1 | Motherhood Maternity | 3 | |
| Burger King | 5 | New Balance | 3 | |
| CVS | 5 | Nike | 17 | |
| Casual Male XL | 1 | Nissan | 1 | |
| Catherines | 1 | Office Depot | 1 | |
| Charlotte Russe | 1 | Old Navy | 1 | |
| Chick-Fil-A | 1 | Olive Garden | 1 | |
| Chuck E. Cheese's | 1 | Outback | 1 | |
| Cinnabon | 1 | Outback Steakhouse | 1 | |
| Circle K | 2 | Pac Sun | 1 | |
| Clarion | 1 | Panda Express | 1 | |
| Cold Stone Creamery | 1 | Panera Bread | 1 | |
| Comfort Inn | 1 | Papa John's Pizza | 2 | |
| Comfort Suites | 1 | Payless | 2 | |
| Cracker Barrel | 1 | Penske | 1 | |
| Curves | 2 | PetSmart | 1 | |
| DHL | 1 | Pier 1 Imports | 1 | |
| Dairy Queen | 3 | Pizza Hut | 2 | |
| Days Inn | 1 | Plato's Closet | 1 | |
| Deb | 1 | Quality | 1 | |
| Decora Cabinetry | 4 | Quiznos | 1 | |
| Dennys | 1 | RadioShack | 2 | |
| Discount Tire | 1 | Red Lobster | 1 | |
| Domino's Pizza | 1 | Red Roof Inn | 1 | |
| DressBarn | 1 | Rue21 | 1 | |
| Dressbarn | 1 | SAS Shoes | 1 | |
| Express | 1 | SONIC Drive-In | 1 | |
| Famous Footwear | 1 | Sam's Club | 1 | |
| Fashion Bug | 1 | Sears | 2 | |
| FedEx | 10 | Shoe Carnival | 1 | |
| Finish Line | 1 | Spencer Gifts | 1 | |
| Firestone Complete Auto Care | 1 | Sprint Nextel | 1 | |
| Foot Locker | 1 | Staples | 1 | |
| Ford | 1 | Starbucks | 4 | |
| GNC | 1 | Steak 'n Shake | 2 | |
| GameStop | 2 | Subaru | 1 | |
| Gap | 1 | Subway | 11 | |
| Gymboree | 1 | Super 8 | 1 | |
| H&R Block | 4 | T-Mobile | 5 | |
| Hilton | 2 | T.G.I. Driday's | 1 | |
| Hobby Lobby | 1 | T.J.Maxx | 1 | |
| Holiday Inn | 2 | Taco Bell | 2 | |
| Hollister Co. | 1 | Target | 1 | |
| Home Depot | 1 | The Limited | 1 | |
| Honda | 1 | The Room Place | 1 | |
| Hot Topic | 1 | Toyota | 1 | |
| Hyundai | 1 | Toys"R"Us | 2 | |
| IHOP | 1 | U-Haul | 5 | |
| JCPenney | 1 | UPS | 21 | |
| Jimmy John's | 1 | Vans | 4 | |
| Jones New York | 3 | Verizon Wireless | 3 | |
| Journeys | 1 | Victoria's Secret | 1 | |
| Justice | 1 | Volkswagen | 1 | |
| KFC | 3 | Walgreens | 3 | |
| Kincaid | 1 | Walmart | 2 | |
| Kmart | 1 | Wendy's | 3 | |
| Knights Inn | 1 | Wet Seal | 1 | |
| Kohl's | 1 | White Castle | 1 | |
| Kroger | 4 | YMCA | 1 | |
Strongest AM radio stations in Lafayette:
- WASK (1450 AM; 1 kW; LAFAYETTE, IN; Owner: WASK, INC.)
- WBAA (920 AM; 5 kW; WEST LAFAYETTE, IN; Owner: PURDUE UNIVERSITY)
- WLAS (1410 AM; 1 kW; LAFAYETTE, IN; Owner: ARTISTIC MEDIA PARTNERS, INC.)
- WIBC (1070 AM; 50 kW; INDIANAPOLIS, IN; Owner: EMMIS RADIO LICENSE CORPORATION)
- WLS (890 AM; 50 kW; CHICAGO, IL; Owner: WLS, INC.)
- WOWO (1190 AM; 50 kW; FORT WAYNE, IN; Owner: PATHFINDER COMMUNICATIONS CORPORATION)
- WSCR (670 AM; 50 kW; CHICAGO, IL; Owner: INFINITY BROADCASTING OPERATIONS, INC.)
- WYLL (1160 AM; 50 kW; CHICAGO, IL; Owner: SCA LICENSE CORPORATION)
- WGN (720 AM; 50 kW; CHICAGO, IL; Owner: WGN CONTINENTAL BROADCASTING CO.)
- WBBM (780 AM; 50 kW; CHICAGO, IL; Owner: INFINITY BROADCASTING OPERATIONS, INC.)
- WMVP (1000 AM; 50 kW; CHICAGO, IL; Owner: ABC, INC.)
- WLW (700 AM; 50 kW; CINCINNATI, OH; Owner: JACOR BROADCASTING CORPORATION)
- WTMJ (620 AM; 50 kW; MILWAUKEE, WI; Owner: JOURNAL BROADCAST CORPORATION)
Strongest FM radio stations in Lafayette:
- WASK-FM (98.7 FM; BATTLE GROUND, IN; Owner: WASK, INC.)
- WKOA (105.3 FM; LAFAYETTE, IN; Owner: WASK, INC.)
- WJEF (91.9 FM; LAFAYETTE, IN; Owner: LAFAYETTE SCHOOL CORP.)
- WKHY (93.5 FM; LAFAYETTE, IN; Owner: STAY TUNED BROADCASTING CORPORATION)
- WLFF (95.3 FM; BROOKSTON, IN; Owner: ARTISTIC MEDIA PARTNERS, INC)
- WBAA-FM (101.3 FM; WEST LAFAYETTE, IN; Owner: PURDUE UNIVERSITY)
- WHPL (89.9 FM; WEST LAFAYETTE, IN; Owner: THE MOODY BIBLE INSTITUTE OF CHICAGO)
- W224AX (92.7 FM; LAFAYETTE, IN; Owner: PENSACOLA CHRISTIAN COLLEGE, INC.)
- WGLM (106.7 FM; WEST LAFAYETTE, IN; Owner: KVB BROADCASTING)
- WAZY-FM (96.5 FM; LAFAYETTE, IN; Owner: ARTISTIC MEDIA PARTNERS L.P.)
- WSHP (95.7 FM; ATTICA, IN; Owner: ARTISTIC MEDIA PARTNERS, L.P.)
- WIMC (103.9 FM; CRAWFORDSVILLE, IN; Owner: C.V.L. BROADCASTING, INC.)
- WXXB (102.9 FM; DELPHI, IN; Owner: STAY TUNED BROADCASTING CORPORATION)
- WMRS (107.7 FM; MONTICELLO, IN; Owner: GERALD NORMAN QUINN)
- WSHW (99.7 FM; FRANKFORT, IN; Owner: KASPAR BROADCASTING CO., INC.)
- WCDQ (106.3 FM; CRAWFORDSVILLE, IN; Owner: C.V.L. BROADCASTING, INC.)
- W216BB (91.1 FM; WILLIAMSPORT, IN; Owner: PENSACOLA CHRISTIAN COLLEGE, INC.)
TV broadcast stations around Lafayette:
- W57DC (Channel 57; LAFAYETTE, IN; Owner: TRINITY BROADCASTING NETWORK)
- WLFI-TV (Channel 18; LAFAYETTE, IN; Owner: PRIMELAND TELEVISION, INC.)
- National Bridge Inventory (NBI) Statistics
- 146Number of bridges
- 2,464ft / 751mTotal length
- $6,829,000Total costs
- 1,603,878Total average daily traffic
- 299,247Total average daily truck traffic
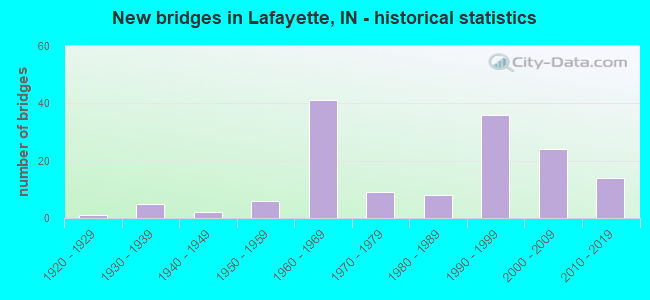
- New bridges - historical statistics
- 11920-1929
- 51930-1939
- 21940-1949
- 61950-1959
- 411960-1969
- 91970-1979
- 81980-1989
- 361990-1999
- 242000-2009
- 142010-2019
FCC Registered Antenna Towers: 392 (See the full list of FCC Registered Antenna Towers)
FCC Registered Commercial Land Mobile Towers: 6 (See the full list of FCC Registered Commercial Land Mobile Towers in Lafayette, IN)
FCC Registered Private Land Mobile Towers: 5 (See the full list of FCC Registered Private Land Mobile Towers)
FCC Registered Broadcast Land Mobile Towers: 101 (See the full list of FCC Registered Broadcast Land Mobile Towers)
FCC Registered Microwave Towers: 81 (See the full list of FCC Registered Microwave Towers in this town)
FCC Registered Paging Towers: 10 (See the full list of FCC Registered Paging Towers)
FCC Registered Maritime Coast & Aviation Ground Towers: 4 (See the full list of FCC Registered Maritime Coast & Aviation Ground Towers)
FCC Registered Amateur Radio Licenses: 461 (See the full list of FCC Registered Amateur Radio Licenses in Lafayette)
FAA Registered Aircraft: 75 (See the full list of FAA Registered Aircraft in Lafayette)
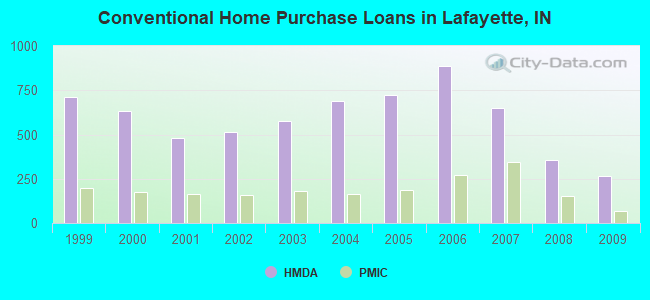
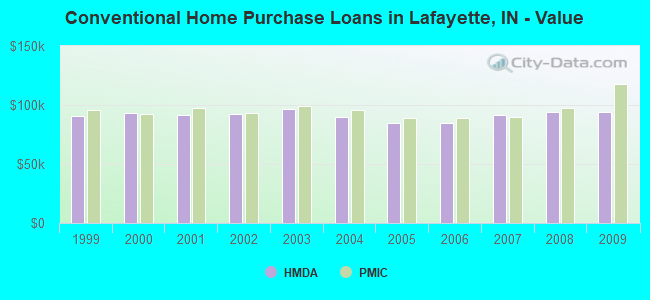
| Home Mortgage Disclosure Act Aggregated Statistics For Year 2009 (Based on 10 full and 8 partial tracts) | ||||||||||||||
| A) FHA, FSA/RHS & VA Home Purchase Loans | B) Conventional Home Purchase Loans | C) Refinancings | D) Home Improvement Loans | E) Loans on Dwellings For 5+ Families | F) Non-occupant Loans on < 5 Family Dwellings (A B C & D) | G) Loans On Manufactured Home Dwelling (A B C & D) | ||||||||
|---|---|---|---|---|---|---|---|---|---|---|---|---|---|---|
| Number | Average Value | Number | Average Value | Number | Average Value | Number | Average Value | Number | Average Value | Number | Average Value | Number | Average Value | |
| LOANS ORIGINATED | 282 | $94,028 | 267 | $94,444 | 922 | $101,731 | 53 | $34,719 | 9 | $430,162 | 144 | $63,985 | 2 | $20,790 |
| APPLICATIONS APPROVED, NOT ACCEPTED | 12 | $101,866 | 5 | $87,530 | 60 | $104,402 | 9 | $78,668 | 0 | $0 | 8 | $144,691 | 2 | $40,720 |
| APPLICATIONS DENIED | 60 | $76,511 | 45 | $82,878 | 335 | $95,886 | 40 | $28,867 | 1 | $583,760 | 48 | $78,003 | 5 | $66,986 |
| APPLICATIONS WITHDRAWN | 39 | $93,993 | 41 | $79,776 | 230 | $107,056 | 6 | $28,685 | 1 | $150,000 | 20 | $57,784 | 1 | $27,510 |
| FILES CLOSED FOR INCOMPLETENESS | 13 | $83,136 | 10 | $104,821 | 47 | $100,663 | 3 | $14,983 | 0 | $0 | 3 | $88,317 | 0 | $0 |
Detailed mortgage data for all 18 tracts in Lafayette, IN
| Private Mortgage Insurance Companies Aggregated Statistics For Year 2009 (Based on 10 full and 7 partial tracts) | ||||||
| A) Conventional Home Purchase Loans | B) Refinancings | C) Non-occupant Loans on < 5 Family Dwellings (A & B) | ||||
|---|---|---|---|---|---|---|
| Number | Average Value | Number | Average Value | Number | Average Value | |
| LOANS ORIGINATED | 69 | $118,155 | 72 | $116,348 | 1 | $90,200 |
| APPLICATIONS APPROVED, NOT ACCEPTED | 17 | $127,620 | 18 | $122,596 | 1 | $43,240 |
| APPLICATIONS DENIED | 5 | $79,324 | 6 | $104,620 | 2 | $38,960 |
| APPLICATIONS WITHDRAWN | 3 | $113,373 | 6 | $109,132 | 0 | $0 |
| FILES CLOSED FOR INCOMPLETENESS | 3 | $80,963 | 1 | $269,480 | 0 | $0 |
2002 - 2017 National Fire Incident Reporting System (NFIRS) incidents
- Fire incident types reported to NFIRS in Lafayette, IN
- 1,37238.0%Outside Fires
- 1,36337.7%Structure Fires
- 62317.2%Mobile Property/Vehicle Fires
- 2557.1%Other
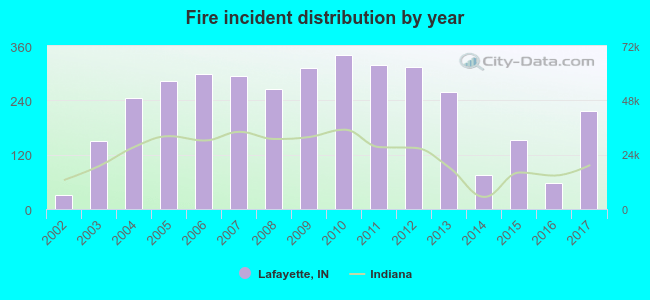 Based on the data from the years 2002 - 2017 the average number of fire incidents per year is 226. The highest number of reported fire incidents - 340 took place in 2010, and the least - 32 in 2002. The data has an increasing trend.
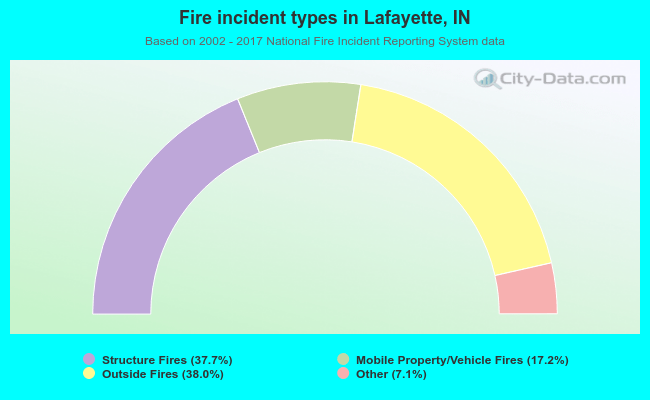 When looking into fire subcategories, the most reports belonged to: Outside Fires (38.0%), and Structure Fires (37.7%).
Fire-safe hotels and motels in Lafayette, Indiana:
- Devon Plaza, 2371 N 26TH, Lafayette, Indiana 47904 , Phone: (765) 742-7394
- Knights Inn, 4110 SR 26TH E, Lafayette, Indiana 47905 , Phone: (765) 447-5611, Fax: (765) 449-4996
- Clarion Inn & Suites, 4320 SR 26 E, Lafayette, Indiana 47905 , Phone: (765) 447-4142, Fax: (765) 448-1885
- Baymont Inn & Suites, 201 Frontage Rd, Lafayette, Indiana 47905 , Phone: (765) 499-4808, Fax: (765) 448-1939
- Economy Inn, 2200 Sagamore Pkwy N, Lafayette, Indiana 47904 , Phone: (765) 447-3111
- Comfort Inn, 4701 Meijer Ct, Lafayette, Indiana 47905 , Phone: (765) 447-3434, Fax: (765) 448-6105
- Baymont Inn & Suites, 312 Meijer Dr, Lafayette, Indiana 47905 , Phone: (765) 446-2400, Fax: (765) 446-2401
- Courtyard By Marriott, 150 Fairington Ave, Lafayette, Indiana 47905 , Phone: (765) 449-4800, Fax: (765) 449-4822
- 11 other hotels and motels
| Most common first names in Lafayette, IN among deceased individuals | ||
| Name | Count | Lived (average) |
|---|---|---|
| Mary | 641 | 79.8 years |
| William | 522 | 73.4 years |
| John | 495 | 73.5 years |
| Robert | 471 | 71.4 years |
| Charles | 400 | 74.8 years |
| James | 396 | 71.2 years |
| George | 274 | 75.7 years |
| Helen | 260 | 78.6 years |
| Dorothy | 238 | 77.9 years |
| Ruth | 199 | 81.1 years |
| Most common last names in Lafayette, IN among deceased individuals | ||
| Last name | Count | Lived (average) |
|---|---|---|
| Smith | 263 | 75.6 years |
| Miller | 158 | 75.6 years |
| Johnson | 121 | 74.6 years |
| Martin | 114 | 77.1 years |
| Brown | 111 | 78.7 years |
| Anderson | 99 | 76.7 years |
| Davis | 93 | 75.4 years |
| Jones | 85 | 74.7 years |
| Wilson | 77 | 75.7 years |
| Taylor | 77 | 75.6 years |
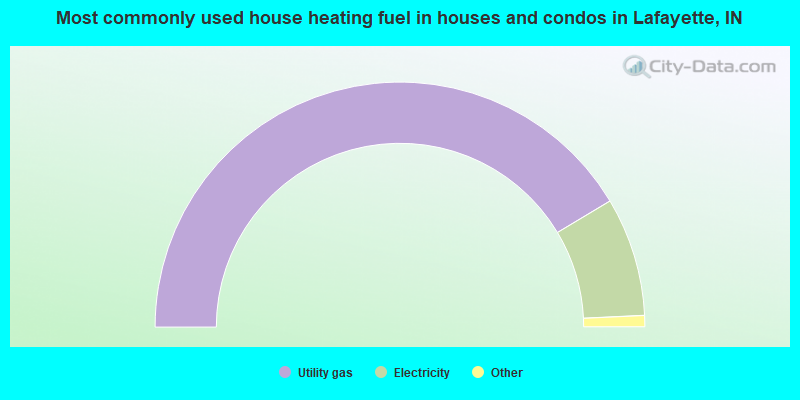
- 82.8%Utility gas
- 15.7%Electricity
- 1.1%Bottled, tank, or LP gas
- 0.2%Other fuel
- 0.1%Wood
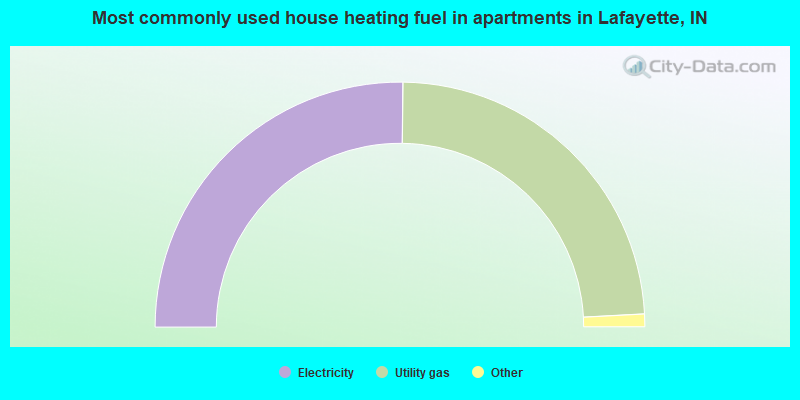
- 50.4%Electricity
- 47.9%Utility gas
- 0.9%Bottled, tank, or LP gas
- 0.5%No fuel used
- 0.3%Other fuel
Lafayette compared to Indiana state average:
- Unemployed percentage significantly below state average.
- Hispanic race population percentage above state average.
- Median age significantly below state average.
- Foreign-born population percentage above state average.
- Renting percentage above state average.
- Length of stay since moving in below state average.
Lafayette on our top lists:
- #10 on the list of "Top 101 cities with largest percentage of males in occupations: production occupations (population 50,000+)"
- #11 on the list of "Top 101 cities with largest percentage of males in industries: manufacturing (population 50,000+)"
- #16 on the list of "Top 100 cities with shortest commuting times (pop. 50,000+)"
- #32 on the list of "Top 101 cities with the largest wind speed differences during a year (population 50,000+)"
- #33 on the list of "Top 101 cities with largest percentage of males in industries: other services, except public administration (population 50,000+)"
- #36 on the list of "Top 101 larger cities with the largest decrease or smallest increase in house/condo value from 2000 (population 50,000+)"
- #52 on the list of "Top 101 cities with largest percentage of females in occupations: life, physical, and social science occupations (population 50,000+)"
- #60 on the list of "Top 101 cities with largest percentage of males in industries: educational services (population 50,000+)"
- #60 on the list of "Top 101 cities with the most residents born in Other Southern Africa (population 500+)"
- #63 on the list of "Top 101 cities with largest percentage of males in occupations: community and social service occupations (population 50,000+)"
- #69 on the list of "Top 101 cities with the largest percentage of unmarried partner households (population 50,000+)"
- #71 on the list of "Top 101 cities with largest percentage of females in occupations: food preparation and serving related occupations (population 50,000+)"
- #86 on the list of "Top 101 cities with largest percentage of females in industries: real estate and rental and leasing (population 50,000+)"
- #91 on the list of "Top 101 cities with the lowest cost per building permit (population 50,000+)"
- #94 on the list of "Top 100 cities with lowest ratio of median house value to median household income (pop. 50,000+)"
- #95 on the list of "Top 101 cities with the largest temperature differences during a year (population 50,000+)"
- #32 on the list of "Top 101 counties with the highest Particulate Matter (PM2.5) Annual air pollution readings in 2012 (µg/m3)"
- #59 on the list of "Top 101 counties with the lowest surface withdrawal of fresh water for public supply (pop. 50,000+)"
- #73 on the list of "Top 101 counties with the largest increase in the number of births per 1000 residents 2000-2006 to 2007-2013 (pop 50,000+)"

|
|
Total of 1092 patent applications in 2008-2024.