Estimated zip code population in 2022: 3,935 Zip code population in 2010: 4,007 Zip code population in 2000: 3,791
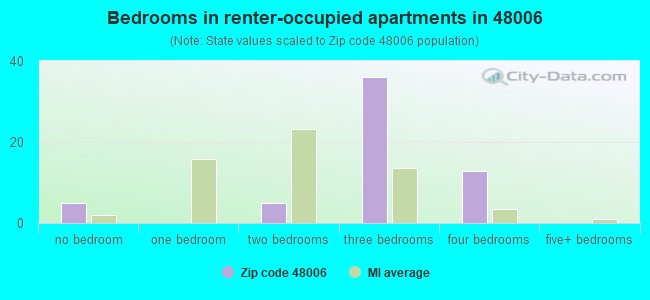
Houses and condos: 1,557 Renter-occupied apartments: 60
% of renters here:
4%
State:
27%
March 2022 cost of living index in zip code 48006: 91.7 (less than average, U.S. average is 100)
Land area: 71.4 sq. mi. Water area: 0.4 sq. mi.
Population density: 55 people per square mile
(very low).
OSM Map
General Map
Google Map
MSN Map
OSM Map
General Map
Google Map
MSN Map
OSM Map
General Map
Google Map
MSN Map
OSM Map
General Map
Google Map
MSN Map
Please wait while loading the map...
Real estate property taxes paid for housing units in 2022:
This zip code:
0.9% ($2,232)
Michigan:
1.2% ($2,746)
Median real estate property taxes paid for housing units with mortgages in 2022: $2,417 (0.9%) Median real estate property taxes paid for housing units with no mortgage in 2022: $1,945 (0.9%)
Business Search- 14 Million verified businesses
Males: 2,100
(53.4%)
Females: 1,834
(46.6%)
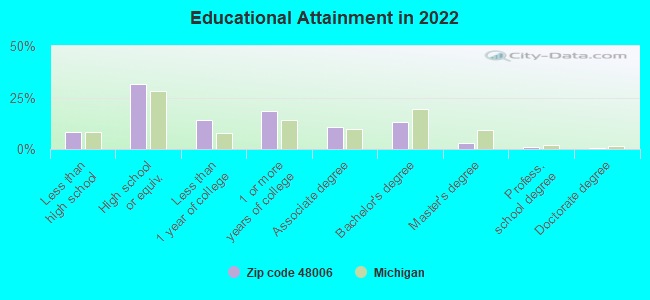
For population 25 years and over in 48006:
High school or higher: 90.6%
Bachelor's degree or higher: 17.3%
Graduate or professional degree: 4.3%
Unemployed: 10.0%
Mean travel time to work (commute): 37.3 minutes
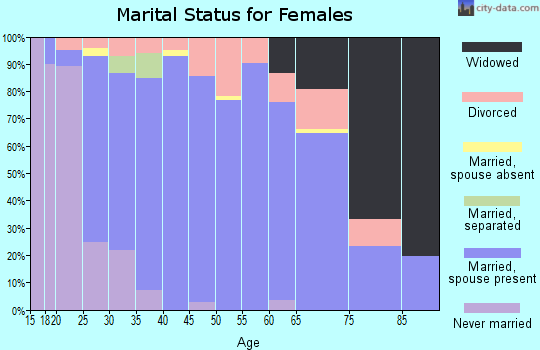
For population 15 years and over in 48006:
Never married: 21.5%
Now married: 63.0%
Separated: 0.5%
Widowed: 4.6%
Divorced: 10.4%
Zip code 48006 compared to state average:
Unemployed percentage above state average.
Black race population percentage significantly below state average.
Median age above state average.
Foreign-born population percentage significantly below state average.
Renting percentage significantly below state average.
Length of stay since moving in significantly above state average.
Percentage of population with a bachelor's degree or higher below state average.
Averages for the 2020 tax year for zip code 48006, filed in 2021:
Average Adjusted Gross Income (AGI) in 2020: $61,777 (Individual Income Tax Returns)
Here:
$61,777
State:
$68,945
Salary/wage: $57,241 (reported on 78.9% of returns)
Here:
$57,241
State:
$57,142
(% of AGI for various income ranges: 913.2% for AGIs below $25k, 3009.1% for AGIs $25k-50k, 5807.5% for AGIs $50k-75k, 8782.8% for AGIs $75k-100k, 15572.9% for AGIs $100k-200k, 55765.0% for AGIs over 200k)
Taxable interest for individuals: $752 (reported on 27.8% of returns)
This zip code:
$752
Michigan:
$1,630
(% of AGI for various income ranges: 19.5% for AGIs below $25k, 22.9% for AGIs $25k-50k, 19.6% for AGIs $50k-75k, 19.4% for AGIs $75k-100k, 61.9% for AGIs $100k-200k, 180.0% for AGIs over 200k)
Ordinary dividends: $1,854 (reported on 14.4% of returns)
Here:
$1,854
State:
$6,972
(% of AGI for various income ranges: 15.1% for AGIs below $25k, 35.6% for AGIs $25k-50k, 54.6% for AGIs $50k-75k, 37.2% for AGIs $75k-100k, 65.7% for AGIs $100k-200k)
Net capital gain/loss in AGI: +$3,154 (reported on 14.4% of returns)
Here:
+$3,154
State:
+$20,064
(% of AGI for various income ranges: 45.9% for AGIs $25k-50k, 20.4% for AGIs $50k-75k, 47.8% for AGIs $75k-100k, 203.3% for AGIs $100k-200k, 825.0% for AGIs over 200k)
Profit/loss from business: +$6,600 (reported on 13.9% of returns)
Here:
+$6,600
State:
+$11,172
(% of AGI for various income ranges: 92.0% for AGIs below $25k, 79.4% for AGIs $25k-50k, 77.1% for AGIs $50k-75k, 224.4% for AGIs $75k-100k, 260.0% for AGIs $100k-200k)
Taxable individual retirement arrangement distribution: $12,039 (reported on 9.3% of returns)
48006:
$12,039
Michigan:
$19,803
(% of AGI for various income ranges: 50.0% for AGIs below $25k, 96.2% for AGIs $25k-50k, 192.1% for AGIs $50k-75k, 283.9% for AGIs $75k-100k, 315.7% for AGIs $100k-200k)
Total itemized deductions: $25,417 (reported on 3.1% of returns)
Here:
$25,417
State:
$34,117
(% of AGI for various income ranges: 267.1% for AGIs $50k-75k, 421.0% for AGIs $100k-200k)
Charity contributions: $8,125 (reported on 2.1% of returns)
Here:
$8,125
State:
$13,548
(% of AGI for various income ranges: 154.8% for AGIs $100k-200k)
Taxes paid: $7,083 (reported on 3.1% of returns)
48006:
$7,083
State:
$7,972
(% of AGI for various income ranges: 71.2% for AGIs $50k-75k, 121.0% for AGIs $100k-200k)
Earned income credit: $2,226 (reported on 9.8% of returns)
Here:
$2,226
State:
$2,251
(% of AGI for various income ranges: 61.5% for AGIs below $25k, 50.3% for AGIs $25k-50k)
Percentage of individuals using paid preparers for their 2020 taxes: 93.8%
Here:
94%
State:
93%
(% for various income ranges: 91.8% for AGIs below $25k, 92.9% for AGIs $25k-50k, 93.5% for AGIs $50k-75k, 96.0% for AGIs $75k-100k, 100.0% for AGIs $100k-200k, 83.3% for AGIs over 200k)
Averages for the 2012 tax year for zip code 48006, filed in 2013:
Average Adjusted Gross Income (AGI) in 2012: $49,873 (Individual Income Tax Returns)
Here:
$49,873
State:
$55,609
Salary/wage: $45,721 (reported on 85.2% of returns)
Here:
$45,721
State:
$46,782
(% of AGI for various income ranges: 68.4% for AGIs below $25k, 71.4% for AGIs $25k-50k, 79.8% for AGIs $50k-75k, 83.8% for AGIs $75k-100k, 78.9% for AGIs $100k-200k)
Taxable interest for individuals: $586 (reported on 32.4% of returns)
This zip code:
$586
Michigan:
$1,491
(% of AGI for various income ranges: 1.6% for AGIs below $25k, 0.5% for AGIs $25k-50k, 0.3% for AGIs $50k-75k, 0.2% for AGIs $75k-100k, 0.2% for AGIs $100k-200k)
Ordinary dividends: $1,723 (reported on 16.5% of returns)
Here:
$1,723
State:
$6,225
(% of AGI for various income ranges: 1.6% for AGIs below $25k, 0.7% for AGIs $25k-50k, 0.6% for AGIs $50k-75k, 0.3% for AGIs $75k-100k, 0.4% for AGIs $100k-200k)
Net capital gain/loss in AGI: +$720 (reported on 8.2% of returns)
Here:
+$720
State:
+$9,326
(% of AGI for various income ranges: 0.3% for AGIs $100k-200k)
Profit/loss from business: +$7,608 (reported on 14.3% of returns)
Here:
+$7,608
State:
+$11,523
(% of AGI for various income ranges: 6.2% for AGIs below $25k, 2.5% for AGIs $25k-50k, 1.7% for AGIs $50k-75k, 1.5% for AGIs $75k-100k, 1.6% for AGIs $100k-200k)
Taxable individual retirement arrangement distribution: $11,488 (reported on 9.3% of returns)
48006:
$11,488
Michigan:
$15,298
(% of AGI for various income ranges: 2.4% for AGIs below $25k, 2.1% for AGIs $25k-50k, 3.7% for AGIs $50k-75k, 2.5% for AGIs $100k-200k)
Total itemized deductions: $18,745 (22% of AGI, reported on 31.9% of returns)
Here:
$18,745
State:
$21,628
Here:
21.6% of AGI
State:
18.4% of AGI
(% of AGI for various income ranges: 9.3% for AGIs below $25k, 9.2% for AGIs $25k-50k, 11.1% for AGIs $50k-75k, 14.0% for AGIs $75k-100k, 13.2% for AGIs $100k-200k)
Charity contributions: $1,980 (reported on 25.3% of returns)
Here:
$1,980
State:
$4,225
(% of AGI for various income ranges: 0.8% for AGIs below $25k, 0.7% for AGIs $25k-50k, 0.7% for AGIs $50k-75k, 1.0% for AGIs $75k-100k, 1.4% for AGIs $100k-200k)
Taxes paid: $6,009 (reported on 31.9% of returns)
48006:
$6,009
State:
$8,327
(% of AGI for various income ranges: 2.0% for AGIs below $25k, 2.3% for AGIs $25k-50k, 3.2% for AGIs $50k-75k, 4.1% for AGIs $75k-100k, 5.2% for AGIs $100k-200k)
Earned income credit: $2,016 (reported on 13.7% of returns)
Here:
$2,016
State:
$2,306
(% of AGI for various income ranges: 4.5% for AGIs below $25k, 1.1% for AGIs $25k-50k)
Percentage of individuals using paid preparers for their 2012 taxes: 63.7%
Here:
64%
State:
57%
(% for various income ranges: 58.6% for AGIs below $25k, 63.2% for AGIs $25k-50k, 66.7% for AGIs $50k-75k, 68.2% for AGIs $75k-100k, 72.7% for AGIs $100k-200k)
Averages for the 2004 tax year for zip code 48006, filed in 2005:
Average Adjusted Gross Income (AGI) in 2004: $44,808 (Individual Income Tax Returns)
Here:
$44,808
State:
$48,204
Salary/wage: $43,236 (reported on 86.9% of returns)
Here:
$43,236
State:
$42,791
(% of AGI for various income ranges: 153.6% for AGIs below $10k, 65.6% for AGIs $10k-25k, 77.6% for AGIs $25k-50k, 89.5% for AGIs $50k-75k, 91.2% for AGIs $75k-100k, 78.4% for AGIs over 100k)
Taxable interest for individuals: $858 (reported on 50.5% of returns)
This zip code:
$858
Michigan:
$1,725
(% of AGI for various income ranges: 12.4% for AGIs below $10k, 3.3% for AGIs $10k-25k, 1.3% for AGIs $25k-50k, 0.5% for AGIs $50k-75k, 0.5% for AGIs $75k-100k, 0.6% for AGIs over 100k)
Taxable dividends: $1,271 (reported on 20.3% of returns)
Here:
$1,271
State:
$3,420
(% of AGI for various income ranges: 2.1% for AGIs below $10k, 1.2% for AGIs $10k-25k, 0.9% for AGIs $25k-50k, 0.4% for AGIs $50k-75k, 0.2% for AGIs $75k-100k, 0.6% for AGIs over 100k)
Net capital gain/loss: +$4,000 (reported on 13.7% of returns)
Here:
+$4,000
State:
+$8,532
(% of AGI for various income ranges: 0.0% for AGIs below $10k, -0.4% for AGIs $10k-25k, 1.0% for AGIs $25k-50k, 0.9% for AGIs $50k-75k, 0.6% for AGIs $75k-100k, 3.0% for AGIs over 100k)
Profit/loss from business: +$3,738 (reported on 13.0% of returns)
Here:
+$3,738
State:
+$9,547
(% of AGI for various income ranges: -13.9% for AGIs below $10k, 7.0% for AGIs $10k-25k, 2.4% for AGIs $25k-50k, 0.9% for AGIs $50k-75k, -0.4% for AGIs $75k-100k, 0.3% for AGIs over 100k)
IRA payment deduction: $2,811 (reported on 3.0% of returns)
48006:
$2,811
Michigan:
$2,875
Total itemized deductions: $16,421 (23% of AGI, reported on 41.9% of returns)
Here:
$16,421
State:
$18,509
Here:
23.2% of AGI
State:
20.7% of AGI
(% of AGI for various income ranges: 11.0% for AGIs $10k-25k, 16.1% for AGIs $25k-50k, 16.3% for AGIs $50k-75k, 15.8% for AGIs $75k-100k, 15.2% for AGIs over 100k)
Charity contributions deductions: $1,752 (2% of AGI, reported on 37.0% of returns)
Here:
$1,752
State:
$3,365
Here:
2.4% of AGI
State:
3.6% of AGI
(% of AGI for various income ranges: 0.8% for AGIs $10k-25k, 1.2% for AGIs $25k-50k, 1.4% for AGIs $50k-75k, 1.5% for AGIs $75k-100k, 1.9% for AGIs over 100k)
Total tax: $5,176 (reported on 77.7% of returns)
48006:
$5,176
State:
$7,691
(% of AGI for various income ranges: 4.3% for AGIs below $10k, 4.4% for AGIs $10k-25k, 5.7% for AGIs $25k-50k, 7.8% for AGIs $50k-75k, 9.3% for AGIs $75k-100k, 14.4% for AGIs over 100k)
Earned income credit: $1,514 (reported on 9.8% of returns)
Here:
$1,514
State:
$1,737
Percentage of individuals using paid preparers for their 2004 taxes: 63.9%
Here:
64%
State:
60%
(% for various income ranges: 50.5% for AGIs below $10k, 62.3% for AGIs $10k-25k, 68.7% for AGIs $25k-50k, 68.9% for AGIs $50k-75k, 67.9% for AGIs $75k-100k, 67.2% for AGIs over 100k)
Household received Food Stamps/SNAP in the past 12 months: 124 Household did not receive Food Stamps/SNAP in the past 12 months: 1,335
Women who had a birth in the past 12 months: 44 (26 now married, 18 unmarried) Women who did not have a birth in the past 12 months: 700 (474 now married, 221 unmarried)
Housing units in zip code 48006 with a mortgage: 849 (65 second mortgage, 9 home equity loan, 57 both second mortgage and home equity loan) Houses without a mortgage: 37
Median monthly owner costs for units with a mortgage: $1,578 Median monthly owner costs for units without a mortgage: $539
Residents with income below the poverty level in 2022:
This zip code:
21.4%
Whole state:
13.4%
Residents with income below 50% of the poverty level in 2022:
This zip code:
5.2%
Whole state:
6.9%
Median number of rooms in houses and condos:
Here:
6.4
State:
6.5
Median number of rooms in apartments:
Here:
5.1
State:
4.3
Notable locations in this zip code not listed on our city pages
Notable locations in zip code 48006: Kenockee Township Fire Department Station 2 (A), Kenockee Township Fire Department Station 1 (B). Display/hide their locations on the map
Cemeteries: Spring Hill Cemetery (1), Lett Cemetery (2), Greenwood Cemetery (3), Our Lady of Mount Carmel Cemetery (4). Display/hide their locations on the map
Streams, rivers, and creeks: Jackson Drain (A), Hyde Drain (B), Hayes Drain (C), Gleason Drain (D), White Drain (E), Quakenbush Drain (F), Emmett Drain (G), Eves Drain (H). Display/hide their locations on the map
In group quarters: 10 (-1 institutionalized population)
Size of family households: 439 2-persons, 267 3-persons, 150 4-persons, 165 5-persons, 35 6-persons, 28 7-or-more-persons
Size of nonfamily households: 319 1-person, 49 2-persons
678 married couples with children.
187 single-parent households (141 men, 46 women).
97.1% of residents of 48006 zip code speak English at home.
1.3% of residents speak Spanish at home (84% very well, 16% not well).
0.6% of residents speak other Indo-European language at home (82% very well, 18% well).
0.1% of residents speak Asian or Pacific Island language at home (100% well).
0.2% of residents speak other language at home (100% very well).
Foreign born population: 48 (1.2%) (82.0% of them are naturalized citizens)
This zip code:
1.2%
Whole state:
6.9%
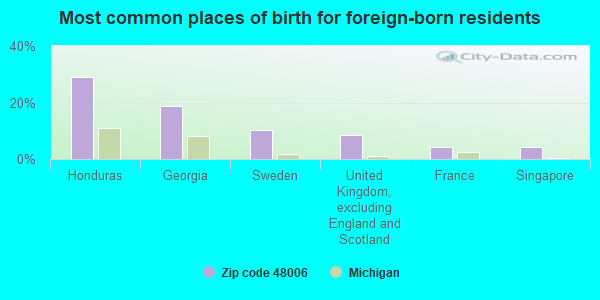
29%Honduras
19%Georgia
10%Sweden
8%United Kingdom, excluding England and Scotland
4%France
4%Singapore
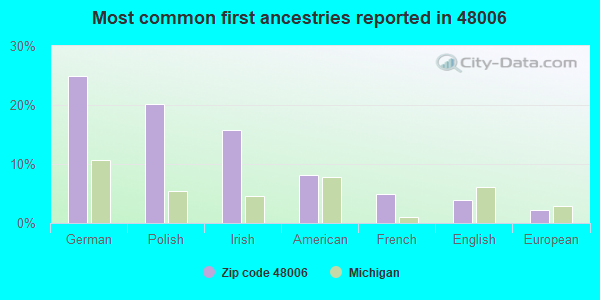
25%German
20%Polish
16%Irish
8%American
5%French
4%English
2%European
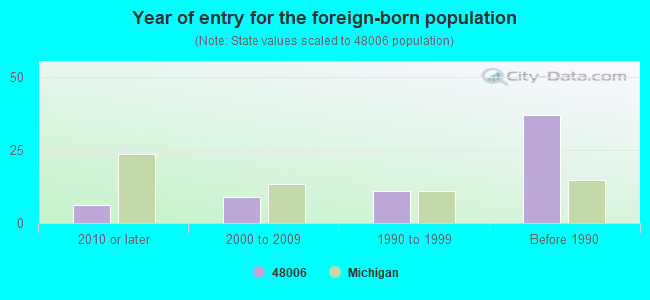
Year of entry for the foreign-born population
62010 or later
92000 to 2009
111990 to 1999
37Before 1990
Public elementary/middle school in in zip code 48006 not listed on the city page:
AVOCA ELEMENTARY SCHOOL (Location: 8751 WILLOW ST, Grades: PK-5)
Facilities with environmental interests located in this zip code:
DETROIT EDISON CO GREENWOOD ENERGY CENTER (7000 KILGORE RD. in AVOCA, MI)
AIR MAJOR (AIRS/AFS) AIR PROGRAM (Clean Air Markets Division Business System) CRITERIA AND HAZARDOUS AIR POLLUTANT INVENTORY (Inventory of air pollution sources) National Pollutant Discharge Elimination System NON-MAJOR (Tracking pollutant discharge elimination systems) - permit Conditionally Exempt Small Quantity Generators, less than 100 kg/month of hazardous waste (Resource Conservation and Recovery Act (tracking hazardous waste)) USED OIL PROGRAM (Resource Conservation and Recovery Act (tracking hazardous waste)) TRI REPORTER (Tracking of toxic chemicals releasing facilities) Business SIC classification: ELECTRIC SERVICES Business NAICS classification: FOSSIL FUEL ELECTRIC POWER GENERATION. Organizations: DETROIT EDISON COMPANY (CONTACT/OPERATOR)
Alternative names: BELLE RIVER, DECO-GREENWOOD ENERGY CENTER, DECO-GREENWOOD PLT, DETROIT EDISON CO. ENV. MGT. & RESOURCES, DETROIT EDISON GREENWOOD
AVOCA ELEMENTARY SCHOOL (8751 WILLOW STREET in AVOCA, MI)
(National Center for Education Statistics) - STATE ID-00157 National Pollutant Discharge Elimination System NON-MAJOR (Tracking pollutant discharge elimination systems) - permit Business SIC classification: ELEMENTARY AND SECONDARY SCHOOLS Organizations: CITY OF YALE/YALE PUBLIC SCH (CONTACT/OWNER)
, YALE PUBLIC SCHOOLS (SCHOOL DISTRICT)
Alternative names: YALE-AVOCA ELEM SCH, YALE AVOCA ELEM SCH WWSL
ANSONS AUTOMOTIVE SERVICE (8989 AVOCA ROAD in AVOCA, MI)
Conditionally Exempt Small Quantity Generators, less than 100 kg/month of hazardous waste (Resource Conservation and Recovery Act (tracking hazardous waste)) Business NAICS classification: ALL OTHER AUTOMOTIVE REPAIR AND MAINTENANCE. Organizations: ANSON STOCKWELL (CONTACT/OPERATOR)
Housing units lacking complete plumbing facilities: 0.2% Housing units lacking complete kitchen facilities: 1.5%
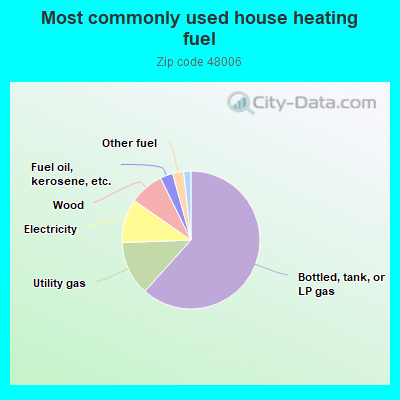
61.9%Bottled, tank, or LP gas
12.8%Utility gas
10.3%Electricity
8.1%Wood
3.0%Fuel oil, kerosene, etc.
2.6%Other fuel
1.7%No fuel used
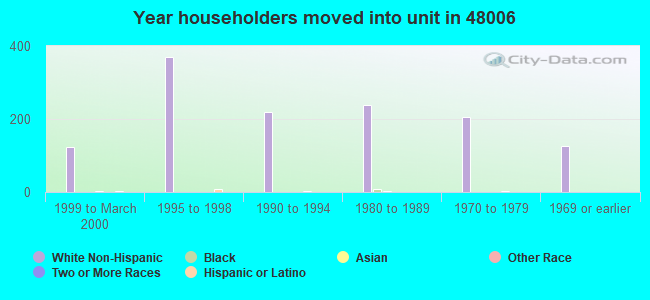
Population in 1990: 2,325. Population change in the 1990s: +1,466 (+63.1%).
Place of birth for U.S.-born residents:
This state: 3,646
Northeast: 26
Midwest: 33
South: 135
West: 10
66% of the 48006 zip code residents lived in the same house 5 years ago. Out of people who lived in different houses, 74% lived in this county. Out of people who lived in different counties, 50% lived in Michigan.
93% of the 48006 zip code residents lived in the same house 1 year ago. Out of people who lived in different houses, 42% moved from this county. Out of people who lived in different houses, 55% moved from different county within same state. Out of people who lived in different houses, 2% moved from abroad.
Private vs. public school enrollment:
Students in private schools in grades 1 to 8 (elementary and middle school): 96
Here:
17.8%
Michigan:
12.4%
Students in private schools in grades 9 to 12 (high school): 19
Here:
10.5%
Michigan:
9.8%
Students in private undergraduate colleges: 8
Here:
7.3%
Michigan:
14.9%
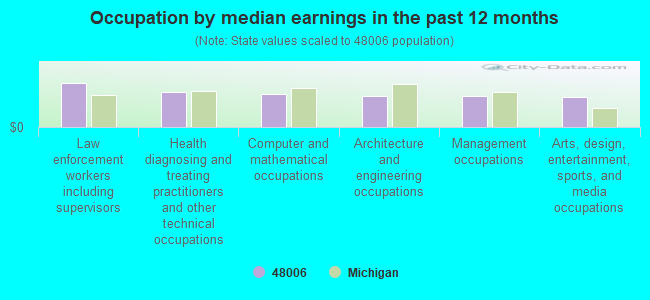
Occupation by median earnings in the past 12 months ($)
104,002Law enforcement workers including supervisors
82,653Health diagnosing and treating practitioners and other technical occupations
78,175Computer and mathematical occupations
74,021Architecture and engineering occupations
73,232Management occupations
70,831Arts, design, entertainment, sports, and media occupations
Companies with federal contracts located in this zip code:
JANICE E WOOD (3632 COGLEY ROAD in AVOCA, MI; small business) : $4,352 in 2 contractsfrom 2000 to 2001
$5,100 with U.S. Army Corps of Engineers - civil program financing only for Recreation Site Maintenance Services (non-construction). Taking place in GA. Signed on 2000-12-04. Completion date: 2001-02-25.
-$748, same as above.Signed on 2001-02-13. Completion date: 2001-02-25.
Top industries in this zip code by the number of employees in 2005:
Utilities: Electric Power Distribution (50-99 employees: 1 establishment)
Arts, Entertainment, and Recreation: Fitness and Recreational Sports Centers (20-49: 1)
Construction: Site Preparation Contractors (5-9: 1, 1-4: 1)
Other Services (except Public Administration): Labor Unions and Similar Labor Organizations (5-9: 1, 1-4: 1)
Mining: Construction Sand and Gravel Mining (5-9: 1)
Construction: New Single-Family Housing Construction (except Operative Builders) (5-9: 1)
Construction: Electrical Contractors (5-9: 1)
People in group quarters in 2010:
6 people in workers' group living quarters and job corps centers
People in group quarters in 2000:
10 people in other group homes
Fatal accident statistics in 2013:
Fatal accident count: 1
Vehicles involved in fatal accidents: 1
Fatal accidents caused by drunken drivers: 1
Fatalities: 1
Persons involved in fatal accidents: 2
Pedestrians involved in fatal accidents: 0
Fatal accident statistics in 2011:
Fatal accident count: 1
Vehicles involved in fatal accidents: 1
Fatal accidents caused by drunken drivers: 0
Fatalities: 1
Persons involved in fatal accidents: 1
Pedestrians involved in fatal accidents: 0
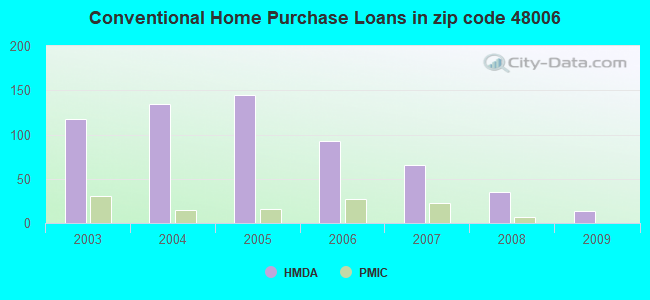
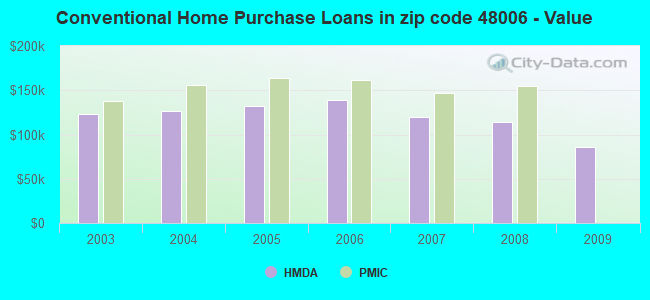
Home Mortgage Disclosure Act Aggregated Statistics For Year 2009 (Based on 2 full and 2 partial tracts)
A) FHA, FSA/RHS & VA Home Purchase Loans
B) Conventional Home Purchase Loans
C) Refinancings
D) Home Improvement Loans
F) Non-occupant Loans on < 5 Family Dwellings (A B C & D)
G) Loans On Manufactured Home Dwelling (A B C & D)
Number
Average Value
Number
Average Value
Number
Average Value
Number
Average Value
Number
Average Value
Number
Average Value
LOANS ORIGINATED
29
$91,697
14
$85,984
167
$133,123
21
$47,473
1
$152,710
13
$78,662
APPLICATIONS APPROVED, NOT ACCEPTED
0
$0
2
$99,960
18
$142,714
3
$18,180
3
$81,910
2
$105,260
APPLICATIONS DENIED
9
$96,410
4
$152,502
66
$136,229
8
$26,314
0
$0
7
$107,903
APPLICATIONS WITHDRAWN
4
$83,345
1
$38,180
25
$171,492
2
$2,000
0
$0
3
$111,053
FILES CLOSED FOR INCOMPLETENESS
0
$0
0
$0
18
$159,550
0
$0
0
$0
2
$149,940
Aggregated Statistics For Year 2008 (Based on 2 full and 2 partial tracts)
A) FHA, FSA/RHS & VA Home Purchase Loans
B) Conventional Home Purchase Loans
C) Refinancings
D) Home Improvement Loans
F) Non-occupant Loans on < 5 Family Dwellings (A B C & D)
G) Loans On Manufactured Home Dwelling (A B C & D)
Number
Average Value
Number
Average Value
Number
Average Value
Number
Average Value
Number
Average Value
Number
Average Value
LOANS ORIGINATED
17
$137,661
35
$114,041
124
$133,470
15
$46,377
12
$106,442
10
$99,747
APPLICATIONS APPROVED, NOT ACCEPTED
1
$63,270
5
$192,992
24
$131,106
2
$19,990
2
$86,965
6
$107,957
APPLICATIONS DENIED
0
$0
5
$182,548
88
$142,496
9
$60,651
2
$124,895
5
$124,556
APPLICATIONS WITHDRAWN
3
$108,517
2
$69,970
26
$153,733
2
$25,090
0
$0
5
$80,994
FILES CLOSED FOR INCOMPLETENESS
0
$0
0
$0
13
$132,941
3
$139,467
2
$175,930
0
$0
Aggregated Statistics For Year 2007 (Based on 2 full and 2 partial tracts)
A) FHA, FSA/RHS & VA Home Purchase Loans
B) Conventional Home Purchase Loans
C) Refinancings
D) Home Improvement Loans
F) Non-occupant Loans on < 5 Family Dwellings (A B C & D)
G) Loans On Manufactured Home Dwelling (A B C & D)
Number
Average Value
Number
Average Value
Number
Average Value
Number
Average Value
Number
Average Value
Number
Average Value
LOANS ORIGINATED
11
$115,658
66
$120,261
199
$137,188
43
$46,458
6
$153,182
31
$107,359
APPLICATIONS APPROVED, NOT ACCEPTED
2
$111,955
8
$94,962
40
$142,292
8
$82,506
0
$0
8
$117,119
APPLICATIONS DENIED
3
$149,347
25
$116,008
192
$147,865
22
$66,694
1
$2,180
26
$112,295
APPLICATIONS WITHDRAWN
2
$103,960
9
$123,404
37
$152,725
1
$357,780
0
$0
2
$130,895
FILES CLOSED FOR INCOMPLETENESS
5
$114,810
3
$109,187
22
$176,693
1
$38,180
0
$0
6
$156,495
Aggregated Statistics For Year 2006 (Based on 2 full and 2 partial tracts)
A) FHA, FSA/RHS & VA Home Purchase Loans
B) Conventional Home Purchase Loans
C) Refinancings
D) Home Improvement Loans
E) Loans on Dwellings For 5+ Families
F) Non-occupant Loans on < 5 Family Dwellings (A B C & D)
G) Loans On Manufactured Home Dwelling (A B C & D)
Number
Average Value
Number
Average Value
Number
Average Value
Number
Average Value
Number
Average Value
Number
Average Value
Number
Average Value
LOANS ORIGINATED
20
$137,554
93
$138,839
226
$123,395
58
$44,220
0
$0
6
$101,847
36
$124,549
APPLICATIONS APPROVED, NOT ACCEPTED
0
$0
8
$144,868
52
$134,313
6
$134,387
0
$0
3
$89,977
7
$131,391
APPLICATIONS DENIED
3
$161,073
26
$90,545
192
$133,705
27
$49,076
6
$121,952
8
$82,948
17
$66,414
APPLICATIONS WITHDRAWN
2
$124,950
16
$165,888
93
$149,840
9
$94,838
0
$0
5
$123,806
2
$161,985
FILES CLOSED FOR INCOMPLETENESS
0
$0
7
$179,909
41
$171,671
0
$0
0
$0
1
$122,170
0
$0
Aggregated Statistics For Year 2005 (Based on 2 full and 2 partial tracts)
A) FHA, FSA/RHS & VA Home Purchase Loans
B) Conventional Home Purchase Loans
C) Refinancings
D) Home Improvement Loans
F) Non-occupant Loans on < 5 Family Dwellings (A B C & D)
G) Loans On Manufactured Home Dwelling (A B C & D)
Number
Average Value
Number
Average Value
Number
Average Value
Number
Average Value
Number
Average Value
Number
Average Value
LOANS ORIGINATED
23
$137,967
145
$131,731
320
$142,752
69
$37,624
10
$112,563
19
$97,994
APPLICATIONS APPROVED, NOT ACCEPTED
2
$208,890
31
$93,222
55
$129,093
6
$85,632
0
$0
11
$82,539
APPLICATIONS DENIED
3
$129,840
47
$106,931
211
$146,276
31
$79,269
3
$157,347
22
$92,216
APPLICATIONS WITHDRAWN
3
$141,907
17
$120,375
154
$133,775
18
$143,550
1
$124,350
13
$110,919
FILES CLOSED FOR INCOMPLETENESS
1
$104,720
4
$123,368
85
$160,808
2
$7,635
0
$0
7
$128,006
Aggregated Statistics For Year 2004 (Based on 2 full and 2 partial tracts)
A) FHA, FSA/RHS & VA Home Purchase Loans
B) Conventional Home Purchase Loans
C) Refinancings
D) Home Improvement Loans
F) Non-occupant Loans on < 5 Family Dwellings (A B C & D)
G) Loans On Manufactured Home Dwelling (A B C & D)
Number
Average Value
Number
Average Value
Number
Average Value
Number
Average Value
Number
Average Value
Number
Average Value
LOANS ORIGINATED
15
$137,026
135
$126,973
363
$126,860
48
$47,664
19
$121,124
42
$104,308
APPLICATIONS APPROVED, NOT ACCEPTED
2
$183,925
17
$123,803
72
$141,799
9
$96,338
0
$0
13
$118,817
APPLICATIONS DENIED
2
$107,990
34
$123,115
200
$149,811
23
$30,790
7
$64,197
20
$129,598
APPLICATIONS WITHDRAWN
0
$0
16
$148,473
124
$144,025
2
$114,955
1
$272,700
10
$92,335
FILES CLOSED FOR INCOMPLETENESS
0
$0
9
$111,884
48
$143,320
0
$0
0
$0
2
$105,810
Aggregated Statistics For Year 2003 (Based on 2 full and 2 partial tracts)
A) FHA, FSA/RHS & VA Home Purchase Loans
B) Conventional Home Purchase Loans
C) Refinancings
D) Home Improvement Loans
E) Loans on Dwellings For 5+ Families
F) Non-occupant Loans on < 5 Family Dwellings (A B C & D)
Detailed PMIC statistics for the following Tracts:6521.00
, 6556.00
2002 - 2018 National Fire Incident Reporting System (NFIRS) incidents
Based on the data from the years 2002 - 2018 the average number of fire incidents per year is 17. The highest number of reported fire incidents - 32 took place in 2017, and the least - 2 in 2009. The data has a dropping trend.
When looking into fire subcategories, the most reports belonged to: Structure Fires (51.4%), and Outside Fires (24.0%).
Fire incident types reported to NFIRS in Zip Code 48006

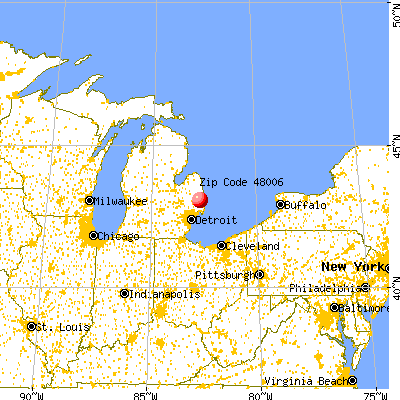


 Nearest zip codes: 48032, 48022, 48049, 48027, 48097, 48454.


 (Location: 8751 WILLOW ST, Grades: PK-5)
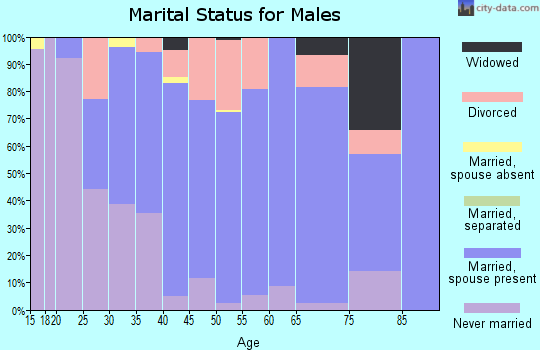
 Based on the data from the years 2002 - 2018 the average number of fire incidents per year is 17. The highest number of reported fire incidents - 32 took place in 2017, and the least - 2 in 2009. The data has a dropping trend.
 When looking into fire subcategories, the most reports belonged to: Structure Fires (51.4%), and Outside Fires (24.0%).