Estimated zip code population in 2022: 2,521 Zip code population in 2010: 2,654 Zip code population in 2000: 2,468
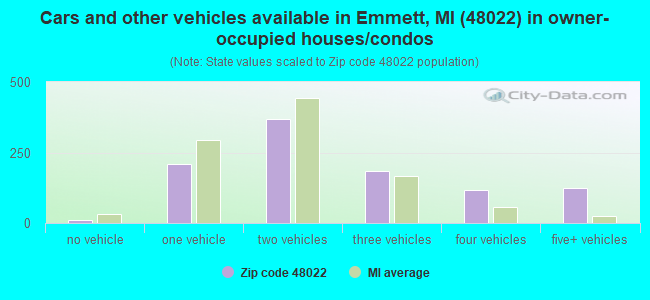
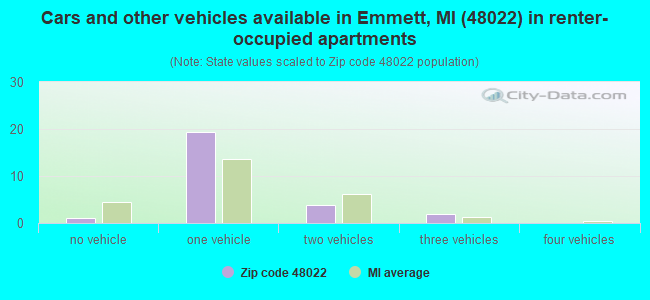
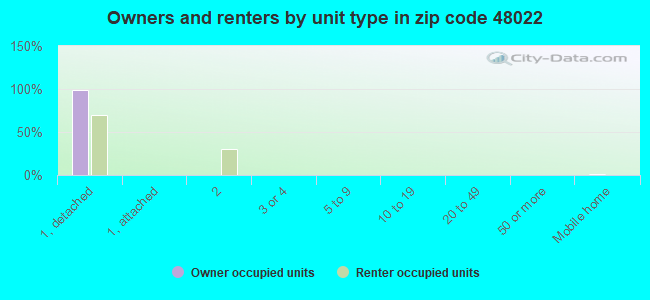
Houses and condos: 1,123 Renter-occupied apartments: 25
% of renters here:
2%
State:
27%
March 2022 cost of living index in zip code 48022: 90.4 (less than average, U.S. average is 100)
Land area: 35.3 sq. mi. Water area: 0.0 sq. mi.
Population density: 71 people per square mile
(very low).
OSM Map
General Map
Google Map
MSN Map
OSM Map
General Map
Google Map
MSN Map
OSM Map
General Map
Google Map
MSN Map
OSM Map
General Map
Google Map
MSN Map
Please wait while loading the map...
Real estate property taxes paid for housing units in 2022:
This zip code:
0.9% ($2,158)
Michigan:
1.2% ($2,746)
Median real estate property taxes paid for housing units with mortgages in 2022: $2,264 (0.8%) Median real estate property taxes paid for housing units with no mortgage in 2022: $1,966 (1.0%)
Business Search- 14 Million verified businesses
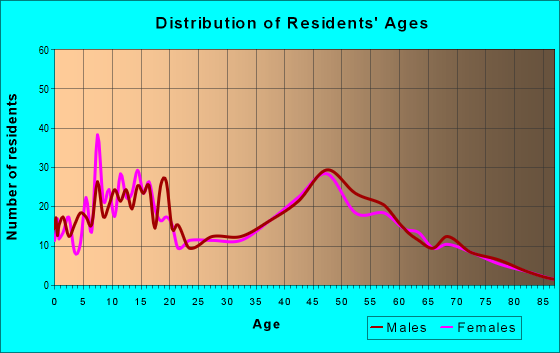
Males: 1,360
(53.9%)
Females: 1,160
(46.1%)
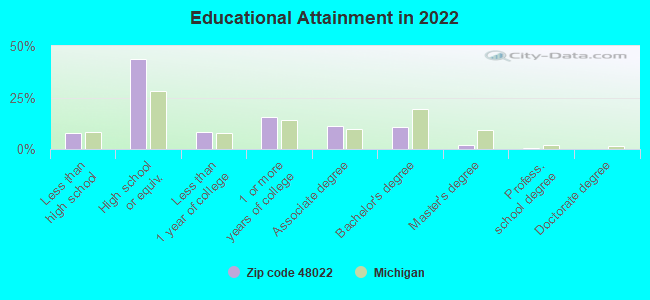
For population 25 years and over in 48022:
High school or higher: 91.8%
Bachelor's degree or higher: 13.3%
Graduate or professional degree: 2.5%
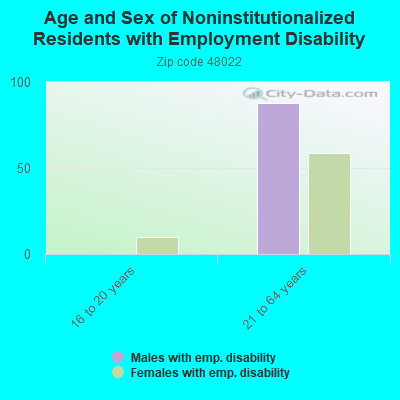
Unemployed: 5.0%
Mean travel time to work (commute): 41.0 minutes
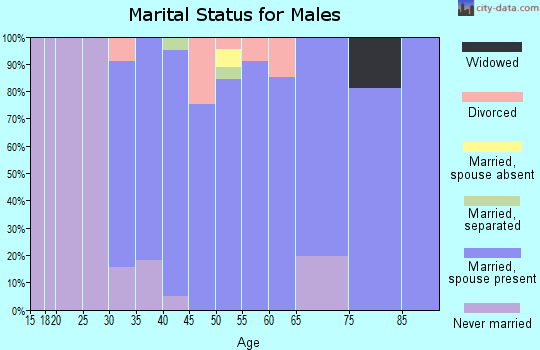
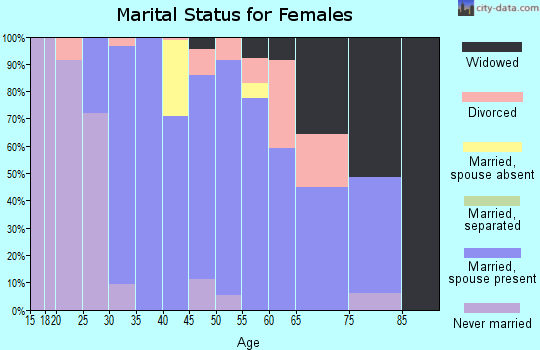
For population 15 years and over in 48022:
Never married: 30.3%
Now married: 53.9%
Separated: 0.0%
Widowed: 8.7%
Divorced: 7.1%
Zip code 48022 compared to state average:
Black race population percentage significantly below state average.
Median age significantly above state average.
Foreign-born population percentage significantly below state average.
Renting percentage significantly below state average.
Length of stay since moving in significantly above state average.
Percentage of population with a bachelor's degree or higher below state average.
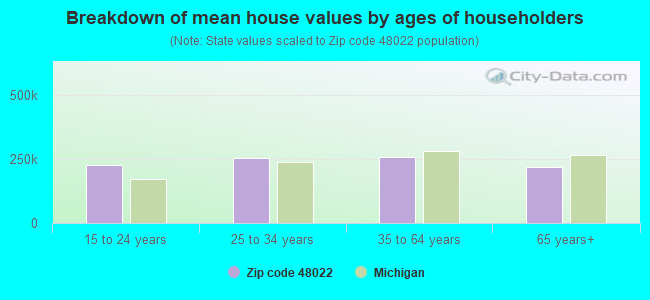
Estimated median house/condo value in 2022: $249,618
48022:
$249,618
Michigan:
$224,400
According to our research of Michigan and other state lists, there were 9 registered sex offenders living in 48022 zip code as of April 28, 2024. The ratio of all residents to sex offenders in zip code 48022 is 294 to 1. The ratio of registered sex offenders to all residents in this zip code is near the state average.
Median resident age:
This zip code:
48.8 years
Michigan median age:
40.3 years
Average household size:
This zip code:
2.4 people
Michigan:
2.4 people
Averages for the 2020 tax year for zip code 48022, filed in 2021:
Average Adjusted Gross Income (AGI) in 2020: $62,849 (Individual Income Tax Returns)
Here:
$62,849
State:
$68,945
Salary/wage: $58,032 (reported on 79.2% of returns)
Here:
$58,032
State:
$57,142
(% of AGI for various income ranges: 975.0% for AGIs below $25k, 2905.2% for AGIs $25k-50k, 6522.9% for AGIs $50k-75k, 8719.3% for AGIs $75k-100k, 14362.4% for AGIs $100k-200k)
Taxable interest for individuals: $459 (reported on 28.5% of returns)
This zip code:
$459
Michigan:
$1,630
(% of AGI for various income ranges: 7.3% for AGIs below $25k, 23.5% for AGIs $25k-50k, 25.0% for AGIs $50k-75k, 15.7% for AGIs $75k-100k, 23.5% for AGIs $100k-200k)
Ordinary dividends: $3,240 (reported on 15.4% of returns)
Here:
$3,240
State:
$6,972
(% of AGI for various income ranges: 18.5% for AGIs below $25k, 27.0% for AGIs $25k-50k, 84.3% for AGIs $50k-75k, 28.6% for AGIs $75k-100k, 223.5% for AGIs $100k-200k)
Net capital gain/loss in AGI: +$5,370 (reported on 15.4% of returns)
Here:
+$5,370
State:
+$20,064
(% of AGI for various income ranges: 1.2% for AGIs below $25k, 13.5% for AGIs $25k-50k, 11.4% for AGIs $50k-75k, 19.3% for AGIs $75k-100k, 586.5% for AGIs $100k-200k)
Profit/loss from business: +$7,829 (reported on 13.1% of returns)
Here:
+$7,829
State:
+$11,172
(% of AGI for various income ranges: 97.3% for AGIs below $25k, 117.8% for AGIs $25k-50k, 67.9% for AGIs $50k-75k, 102.1% for AGIs $75k-100k, 334.7% for AGIs $100k-200k)
Taxable individual retirement arrangement distribution: $17,562 (reported on 10.0% of returns)
48022:
$17,562
Michigan:
$19,803
(% of AGI for various income ranges: 67.7% for AGIs below $25k, 149.1% for AGIs $25k-50k, 516.4% for AGIs $50k-75k, 612.4% for AGIs $100k-200k)
Total itemized deductions: $26,350 (reported on 3.1% of returns)
Here:
$26,350
State:
$34,117
(% of AGI for various income ranges: 752.9% for AGIs $75k-100k)
Charity contributions: $6,400 (reported on 2.3% of returns)
Here:
$6,400
State:
$13,548
(% of AGI for various income ranges: 137.1% for AGIs $75k-100k)
Taxes paid: $7,200 (reported on 3.1% of returns)
48022:
$7,200
State:
$7,972
(% of AGI for various income ranges: 169.4% for AGIs $100k-200k)
Earned income credit: $1,818 (reported on 8.5% of returns)
Here:
$1,818
State:
$2,251
(% of AGI for various income ranges: 29.2% for AGIs below $25k, 53.9% for AGIs $25k-50k)
Percentage of individuals using paid preparers for their 2020 taxes: 94.6%
Here:
95%
State:
93%
(% for various income ranges: 92.1% for AGIs below $25k, 96.6% for AGIs $25k-50k, 95.0% for AGIs $50k-75k, 94.4% for AGIs $75k-100k, 95.5% for AGIs $100k-200k, 100.0% for AGIs over 200k)
Averages for the 2012 tax year for zip code 48022, filed in 2013:
Average Adjusted Gross Income (AGI) in 2012: $50,171 (Individual Income Tax Returns)
Here:
$50,171
State:
$55,609
Salary/wage: $46,375 (reported on 83.6% of returns)
Here:
$46,375
State:
$46,782
(% of AGI for various income ranges: 60.7% for AGIs below $25k, 69.4% for AGIs $25k-50k, 74.0% for AGIs $50k-75k, 81.4% for AGIs $75k-100k, 83.9% for AGIs $100k-200k)
Taxable interest for individuals: $610 (reported on 33.6% of returns)
This zip code:
$610
Michigan:
$1,491
(% of AGI for various income ranges: 1.7% for AGIs below $25k, 0.4% for AGIs $25k-50k, 0.4% for AGIs $50k-75k, 0.3% for AGIs $75k-100k, 0.2% for AGIs $100k-200k)
Ordinary dividends: $1,435 (reported on 16.4% of returns)
Here:
$1,435
State:
$6,225
(% of AGI for various income ranges: 2.0% for AGIs below $25k, 0.6% for AGIs $25k-50k, 0.6% for AGIs $50k-75k, 0.2% for AGIs $75k-100k, 0.2% for AGIs $100k-200k)
Profit/loss from business: +$4,700 (reported on 9.8% of returns)
Here:
+$4,700
State:
+$11,523
(% of AGI for various income ranges: 4.4% for AGIs below $25k, 4.2% for AGIs $25k-50k)
Taxable individual retirement arrangement distribution: $10,969 (reported on 10.7% of returns)
48022:
$10,969
Michigan:
$15,298
(% of AGI for various income ranges: 3.6% for AGIs below $25k, 1.5% for AGIs $25k-50k, 2.9% for AGIs $50k-75k, 5.3% for AGIs $75k-100k)
Total itemized deductions: $17,826 (22% of AGI, reported on 34.4% of returns)
Here:
$17,826
State:
$21,628
Here:
22.2% of AGI
State:
18.4% of AGI
(% of AGI for various income ranges: 9.8% for AGIs below $25k, 9.4% for AGIs $25k-50k, 11.8% for AGIs $50k-75k, 13.1% for AGIs $75k-100k, 13.7% for AGIs $100k-200k)
Charity contributions: $2,010 (reported on 25.4% of returns)
Here:
$2,010
State:
$4,225
(% of AGI for various income ranges: 0.8% for AGIs $25k-50k, 1.0% for AGIs $50k-75k, 1.3% for AGIs $75k-100k, 1.1% for AGIs $100k-200k)
Taxes paid: $5,826 (reported on 34.4% of returns)
48022:
$5,826
State:
$8,327
(% of AGI for various income ranges: 1.8% for AGIs below $25k, 2.2% for AGIs $25k-50k, 3.4% for AGIs $50k-75k, 4.3% for AGIs $75k-100k, 5.4% for AGIs $100k-200k)
Earned income credit: $1,864 (reported on 11.5% of returns)
Here:
$1,864
State:
$2,306
(% of AGI for various income ranges: 3.2% for AGIs below $25k, 1.1% for AGIs $25k-50k)
Percentage of individuals using paid preparers for their 2012 taxes: 62.3%
Here:
62%
State:
57%
(% for various income ranges: 55.6% for AGIs below $25k, 70.8% for AGIs $25k-50k, 66.7% for AGIs $50k-75k, 62.5% for AGIs $75k-100k, 62.5% for AGIs $100k-200k)
Averages for the 2004 tax year for zip code 48022, filed in 2005:
Average Adjusted Gross Income (AGI) in 2004: $47,920 (Individual Income Tax Returns)
Here:
$47,920
State:
$48,204
Salary/wage: $46,145 (reported on 86.0% of returns)
Here:
$46,145
State:
$42,791
(% of AGI for various income ranges: 94.5% for AGIs below $10k, 60.2% for AGIs $10k-25k, 78.8% for AGIs $25k-50k, 87.5% for AGIs $50k-75k, 92.4% for AGIs $75k-100k, 74.7% for AGIs over 100k)
Taxable interest for individuals: $878 (reported on 52.7% of returns)
This zip code:
$878
Michigan:
$1,725
(% of AGI for various income ranges: 9.0% for AGIs below $10k, 2.5% for AGIs $10k-25k, 1.2% for AGIs $25k-50k, 0.7% for AGIs $50k-75k, 0.4% for AGIs $75k-100k, 0.8% for AGIs over 100k)
Taxable dividends: $960 (reported on 19.3% of returns)
Here:
$960
State:
$3,420
(% of AGI for various income ranges: 4.2% for AGIs below $10k, 1.3% for AGIs $10k-25k, 0.3% for AGIs $25k-50k, 0.2% for AGIs $50k-75k, 0.1% for AGIs $75k-100k, 0.5% for AGIs over 100k)
Net capital gain/loss: +$1,083 (reported on 13.4% of returns)
Here:
+$1,083
State:
+$8,532
(% of AGI for various income ranges: -2.9% for AGIs below $10k, 0.7% for AGIs $10k-25k, -0.3% for AGIs $25k-50k, 0.2% for AGIs $50k-75k, 0.0% for AGIs $75k-100k, 1.2% for AGIs over 100k)
Profit/loss from business: +$3,688 (reported on 14.5% of returns)
Here:
+$3,688
State:
+$9,547
(% of AGI for various income ranges: 2.6% for AGIs below $10k, 4.0% for AGIs $10k-25k, 3.7% for AGIs $25k-50k, 0.7% for AGIs $50k-75k, 0.1% for AGIs $75k-100k)
IRA payment deduction: $2,043 (reported on 2.0% of returns)
48022:
$2,043
Michigan:
$2,875
Total itemized deductions: $16,096 (23% of AGI, reported on 45.6% of returns)
Here:
$16,096
State:
$18,509
Here:
23.1% of AGI
State:
20.7% of AGI
(% of AGI for various income ranges: 10.2% for AGIs $10k-25k, 14.6% for AGIs $25k-50k, 18.7% for AGIs $50k-75k, 17.0% for AGIs $75k-100k, 12.0% for AGIs over 100k)
Charity contributions deductions: $1,704 (2% of AGI, reported on 40.2% of returns)
Here:
$1,704
State:
$3,365
Here:
2.4% of AGI
State:
3.6% of AGI
(% of AGI for various income ranges: 0.3% for AGIs $10k-25k, 1.2% for AGIs $25k-50k, 1.4% for AGIs $50k-75k, 1.8% for AGIs $75k-100k, 1.5% for AGIs over 100k)
Total tax: $5,689 (reported on 80.2% of returns)
48022:
$5,689
State:
$7,691
(% of AGI for various income ranges: 3.7% for AGIs below $10k, 4.8% for AGIs $10k-25k, 6.8% for AGIs $25k-50k, 7.4% for AGIs $50k-75k, 9.3% for AGIs $75k-100k, 16.2% for AGIs over 100k)
Earned income credit: $1,573 (reported on 7.0% of returns)
Here:
$1,573
State:
$1,737
Percentage of individuals using paid preparers for their 2004 taxes: 63.9%
Here:
64%
State:
60%
(% for various income ranges: 55.3% for AGIs below $10k, 60.1% for AGIs $10k-25k, 67.9% for AGIs $25k-50k, 66.8% for AGIs $50k-75k, 66.7% for AGIs $75k-100k, 68.1% for AGIs over 100k)
Household received Food Stamps/SNAP in the past 12 months: 55 Household did not receive Food Stamps/SNAP in the past 12 months: 979
Women who had a birth in the past 12 months: 13 (13 now married, 0 unmarried) Women who did not have a birth in the past 12 months: 495 (235 now married, 258 unmarried)
Housing units in zip code 48022 with a mortgage: 672 (80 second mortgage, 70 both second mortgage and home equity loan) Houses without a mortgage: 15
Median monthly owner costs for units with a mortgage: $1,468 Median monthly owner costs for units without a mortgage: $557
Residents with income below the poverty level in 2022:
This zip code:
7.9%
Whole state:
13.4%
Residents with income below 50% of the poverty level in 2022:
This zip code:
5.4%
Whole state:
6.9%
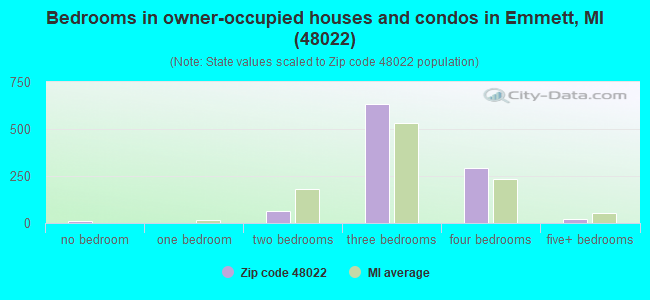
Median number of rooms in houses and condos:
Here:
6.3
State:
6.5
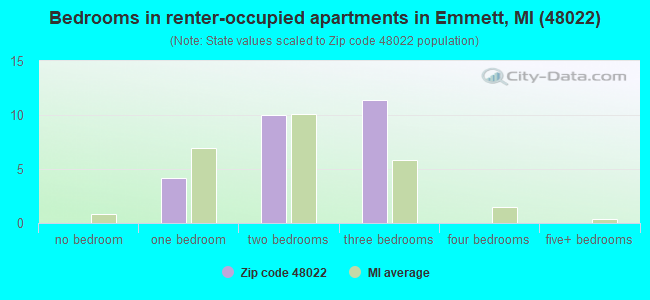
Median number of rooms in apartments:
Here:
5.8
State:
4.3
Notable locations in this zip code not listed on our city pages
Parks in zip code 48022 include: Our Lady of Mount Carmel Parish Historical Marker (1), John F Farrell Historical Marker (2). Display/hide their locations on the map
Size of family households: 276 2-persons, 163 3-persons, 127 4-persons, 71 5-persons, 5 6-persons, 13 7-or-more-persons
Size of nonfamily households: 289 1-person, 81 2-persons, 11 4-persons
224 married couples with children.
27 single-parent households (13 men, 14 women).
98.1% of residents of 48022 zip code speak English at home.
1.3% of residents speak Spanish at home (65% very well, 35% not well).
0.5% of residents speak other Indo-European language at home (100% very well).
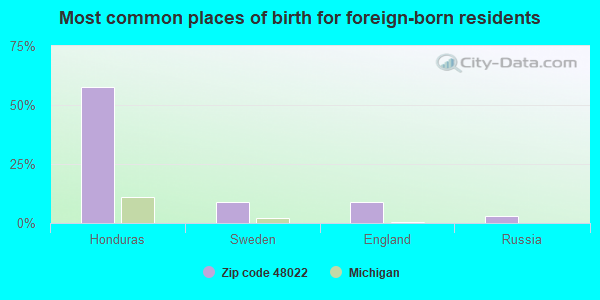
Foreign born population: 32 (1.3%) (12.7% of them are naturalized citizens)
This zip code:
1.3%
Whole state:
6.9%
58%Honduras
9%Sweden
9%England
3%Russia
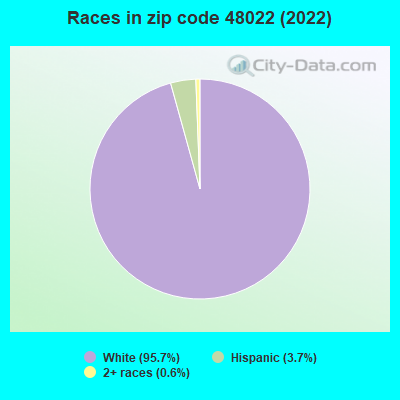
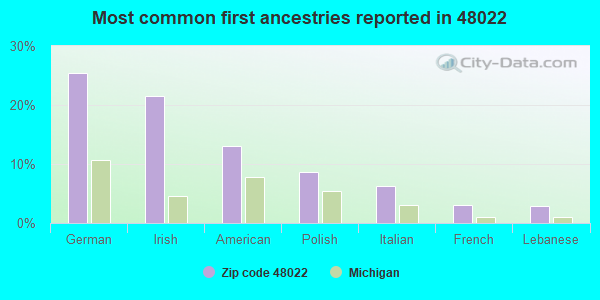
25%German
22%Irish
13%American
9%Polish
6%Italian
3%French
3%Lebanese
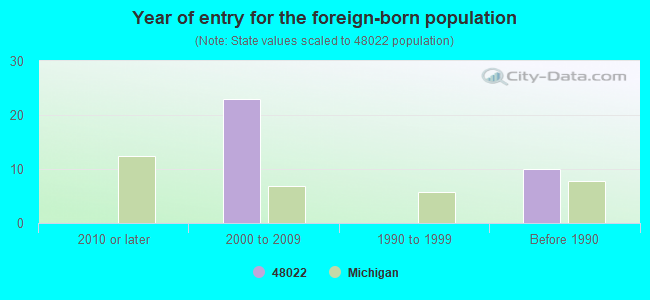
Year of entry for the foreign-born population
02010 or later
232000 to 2009
01990 to 1999
10Before 1990
Major facilities with environmental interests located in this zip code:
BISCOS TRUCK STOP (2989 KINNEY ROAD in EMMETT, MI)
National Pollutant Discharge Elimination System NON-MAJOR (Tracking pollutant discharge elimination systems) - permit Business SIC classification: LOCAL TRUCKING WITHOUT STORAGE Organizations: BISCO'S TRUCK STOP (CONTACT/OWNER)
MI DEPT/TRANSPORTATION BRIDGE (I-69 AND REEVES RD in EMMETT, MI)
(Resource Conservation and Recovery Act (tracking hazardous waste)) Organizations: MICH DEPT OF TRANSPORTATION (CONTACT/OPERATOR)
Alternative names: MIDOT BRIDGE I-69 AND REEVES RD
MI DEPT/TRANSPORTATION BRIDGE (I 69 AND BRAIDWOOD RD BRIDGE in EMMETT, MI)
(Resource Conservation and Recovery Act (tracking hazardous waste)) Organizations: MICH DEPT OF TRANSPORTATION (CONTACT/OPERATOR)
Alternative names: MIDOT BRIDGE I-69 OVER BRAIDWOOD RD
MI DEPT/TRANSPORTATION BRIDGE (M-19 OVER PINE RIVER in EMMETT, MI)
(Resource Conservation and Recovery Act (tracking hazardous waste)) Organizations: MICH DEPT OF TRANSPORTATION (CONTACT/OPERATOR)
Alternative names: MIDOT BRIDGE M-19 OVER PINE RIVER
MI DEPT/TRANSPORTATION BRIDGE (I-69 UNDER M-19 in EMMETT, MI)
(Resource Conservation and Recovery Act (tracking hazardous waste)) Organizations: MICH DEPT OF TRANSPORTATION (CONTACT/OPERATOR)
Alternative names: MIDOT BRIDGE I-69 UNDER M-19
MI DEPT/TRANSPORTATION BRIDGE (I-69 AND STAPLETON in EMMETT, MI)
(Resource Conservation and Recovery Act (tracking hazardous waste)) Organizations: MICH DEPT OF TRANSPORTATION (CONTACT/OPERATOR)
Alternative names: MIDOT BRIDGE I-69 & STAPLETON
MI DEPT/TRANSPORTATION BRIDGE (I-69 UNDER FOX RD in EMMETT, MI)
(Resource Conservation and Recovery Act (tracking hazardous waste)) Organizations: MICH DEPT OF TRANSPORTATION (CONTACT/OPERATOR)
Alternative names: MIDOT BRIDGE I-69 UNDER FOX RD
Housing units lacking complete plumbing facilities: 0.8% Housing units lacking complete kitchen facilities: 1.8%
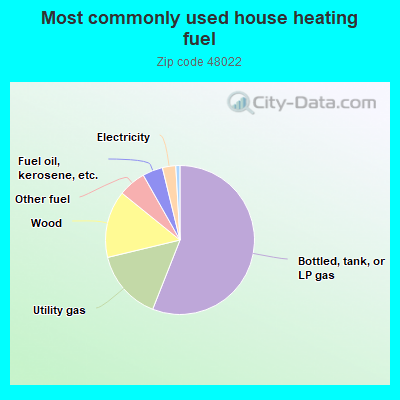
56.1%Bottled, tank, or LP gas
15.3%Utility gas
14.6%Wood
6.0%Other fuel
4.4%Fuel oil, kerosene, etc.
2.9%Electricity
Population in 1990: 2,335. Population change in the 1990s: +133 (+5.7%).
Place of birth for U.S.-born residents:
This state: 2,338
Northeast: 21
Midwest: 38
South: 35
West: 46
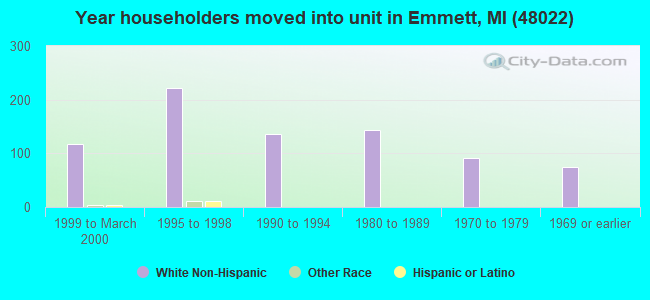
60% of the 48022 zip code residents lived in the same house 5 years ago. Out of people who lived in different houses, 33% lived in this county. Out of people who lived in different counties, 50% lived in Michigan.
95% of the 48022 zip code residents lived in the same house 1 year ago. Out of people who lived in different houses, 16% moved from this county. Out of people who lived in different houses, 76% moved from different county within same state. Out of people who lived in different houses, 10% moved from different state.
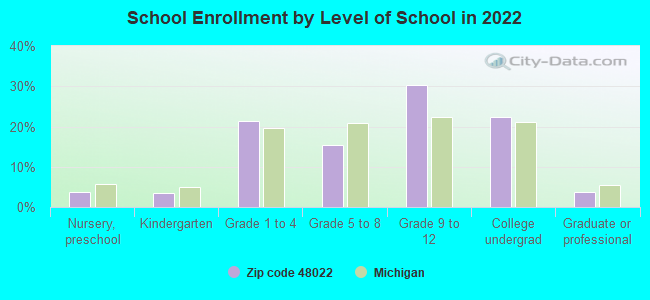
Private vs. public school enrollment:
Students in private schools in grades 1 to 8 (elementary and middle school):
Here:
0.0%
Michigan:
12.4%
Students in private schools in grades 9 to 12 (high school): 6
Here:
5.9%
Michigan:
9.8%
Students in private undergraduate colleges: 7
Here:
8.5%
Michigan:
14.9%
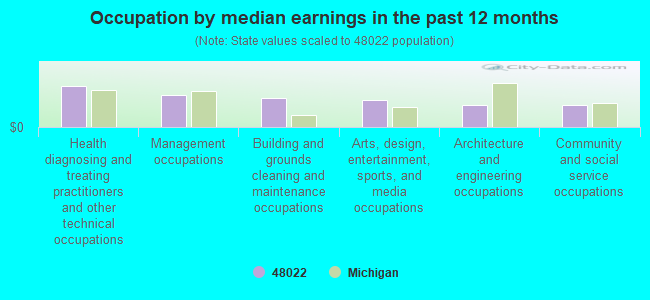
Occupation by median earnings in the past 12 months ($)
106,269Health diagnosing and treating practitioners and other technical occupations
84,141Management occupations
76,446Building and grounds cleaning and maintenance occupations
70,583Arts, design, entertainment, sports, and media occupations
58,645Architecture and engineering occupations
56,781Community and social service occupations
Top industries in this zip code by the number of employees in 2005:
Construction: New Single-Family Housing Construction (except Operative Builders) (5-9 employees: 1 establishment, 1-4 employees: 2 establishments)
Finance and Insurance: Commercial Banking (5-9: 1)
Other Services (except Public Administration): Religious Organizations (5-9: 1)
Administrative and Support and Waste Management and Remediation Services: Landscaping Services (1-4: 3)
Construction: Siding Contractors (1-4: 2)
Construction: Plumbing, Heating, and Air-Conditioning Contractors (1-4: 2)
Construction: Electrical Contractors (1-4: 2)
Fatal accident statistics in 2013:
Fatal accident count: 1
Vehicles involved in fatal accidents: 1
Fatal accidents caused by drunken drivers: 1
Fatalities: 1
Persons involved in fatal accidents: 1
Pedestrians involved in fatal accidents: 0
Fatal accident statistics in 2012:
Fatal accident count: 1
Vehicles involved in fatal accidents: 1
Fatal accidents caused by drunken drivers: 1
Fatalities: 1
Persons involved in fatal accidents: 2
Pedestrians involved in fatal accidents: 0
Home Mortgage Disclosure Act Aggregated Statistics For Year 2009 (Based on 2 full tracts)
A) FHA, FSA/RHS & VA Home Purchase Loans
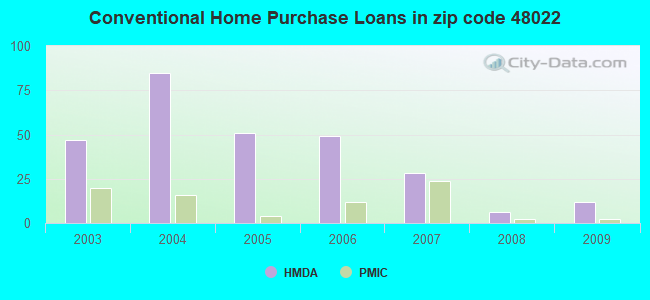
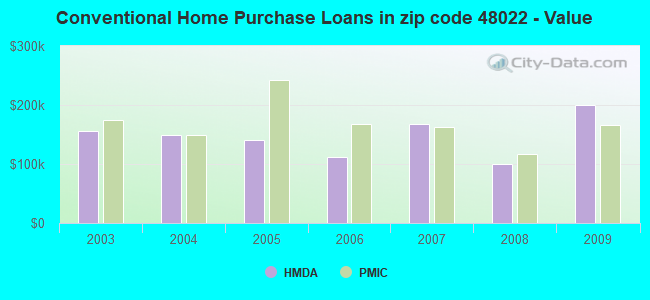
B) Conventional Home Purchase Loans
C) Refinancings
D) Home Improvement Loans
F) Non-occupant Loans on < 5 Family Dwellings (A B C & D)
G) Loans On Manufactured Home Dwelling (A B C & D)
Number
Average Value
Number
Average Value
Number
Average Value
Number
Average Value
Number
Average Value
Number
Average Value
LOANS ORIGINATED
14
$121,755
12
$199,688
75
$121,415
6
$55,177
8
$250,512
8
$85,968
APPLICATIONS APPROVED, NOT ACCEPTED
4
$77,838
0
$0
12
$170,292
0
$0
0
$0
0
$0
APPLICATIONS DENIED
8
$121,439
2
$69,955
51
$141,458
4
$121,685
2
$87,690
4
$119,715
APPLICATIONS WITHDRAWN
0
$0
0
$0
18
$150,861
4
$22,170
0
$0
2
$109,370
FILES CLOSED FOR INCOMPLETENESS
0
$0
0
$0
2
$96,560
0
$0
0
$0
0
$0
Aggregated Statistics For Year 2008 (Based on 2 full tracts)
A) FHA, FSA/RHS & VA Home Purchase Loans
B) Conventional Home Purchase Loans
C) Refinancings
D) Home Improvement Loans
F) Non-occupant Loans on < 5 Family Dwellings (A B C & D)
G) Loans On Manufactured Home Dwelling (A B C & D)
Number
Average Value
Number
Average Value
Number
Average Value
Number
Average Value
Number
Average Value
Number
Average Value
LOANS ORIGINATED
16
$162,821
6
$99,187
75
$127,879
6
$14,452
6
$67,985
0
$0
APPLICATIONS APPROVED, NOT ACCEPTED
0
$0
0
$0
4
$88,678
0
$0
0
$0
0
$0
APPLICATIONS DENIED
2
$131,045
8
$85,229
28
$158,000
12
$47,458
2
$13,795
4
$72,420
APPLICATIONS WITHDRAWN
0
$0
0
$0
16
$175,753
0
$0
0
$0
0
$0
FILES CLOSED FOR INCOMPLETENESS
0
$0
0
$0
2
$117,250
2
$54,190
0
$0
0
$0
Aggregated Statistics For Year 2007 (Based on 2 full tracts)
A) FHA, FSA/RHS & VA Home Purchase Loans
B) Conventional Home Purchase Loans
C) Refinancings
D) Home Improvement Loans
F) Non-occupant Loans on < 5 Family Dwellings (A B C & D)
G) Loans On Manufactured Home Dwelling (A B C & D)
Number
Average Value
Number
Average Value
Number
Average Value
Number
Average Value
Number
Average Value
Number
Average Value
LOANS ORIGINATED
6
$136,628
28
$167,290
97
$123,741
14
$55,459
6
$141,227
6
$152,065
APPLICATIONS APPROVED, NOT ACCEPTED
0
$0
6
$204,285
26
$162,423
0
$0
2
$201,985
0
$0
APPLICATIONS DENIED
0
$0
16
$126,981
122
$158,262
37
$102,578
0
$0
4
$96,068
APPLICATIONS WITHDRAWN
2
$161,590
4
$109,860
35
$137,379
0
$0
0
$0
4
$130,553
FILES CLOSED FOR INCOMPLETENESS
0
$0
0
$0
6
$160,603
0
$0
0
$0
0
$0
Aggregated Statistics For Year 2006 (Based on 2 full tracts)
A) FHA, FSA/RHS & VA Home Purchase Loans
B) Conventional Home Purchase Loans
C) Refinancings
D) Home Improvement Loans
F) Non-occupant Loans on < 5 Family Dwellings (A B C & D)
G) Loans On Manufactured Home Dwelling (A B C & D)
Number
Average Value
Number
Average Value
Number
Average Value
Number
Average Value
Number
Average Value
Number
Average Value
LOANS ORIGINATED
6
$166,515
49
$111,399
124
$123,941
20
$68,380
0
$0
10
$113,901
APPLICATIONS APPROVED, NOT ACCEPTED
0
$0
4
$175,382
32
$129,628
2
$29,560
0
$0
2
$148,780
APPLICATIONS DENIED
0
$0
6
$208,883
142
$130,295
18
$95,136
6
$160,932
22
$100,590
APPLICATIONS WITHDRAWN
0
$0
2
$144,840
87
$185,735
10
$97,742
0
$0
2
$128,090
FILES CLOSED FOR INCOMPLETENESS
0
$0
0
$0
34
$159,155
2
$14,780
0
$0
0
$0
Aggregated Statistics For Year 2005 (Based on 2 full tracts)
A) FHA, FSA/RHS & VA Home Purchase Loans
B) Conventional Home Purchase Loans
C) Refinancings
D) Home Improvement Loans
F) Non-occupant Loans on < 5 Family Dwellings (A B C & D)
G) Loans On Manufactured Home Dwelling (A B C & D)
Number
Average Value
Number
Average Value
Number
Average Value
Number
Average Value
Number
Average Value
Number
Average Value
LOANS ORIGINATED
2
$218,735
51
$141,458
209
$148,238
14
$44,620
0
$0
6
$138,927
APPLICATIONS APPROVED, NOT ACCEPTED
4
$117,742
18
$134,548
43
$160,673
6
$72,583
2
$598,075
4
$141,882
APPLICATIONS DENIED
0
$0
30
$97,479
146
$149,536
18
$36,347
2
$129,075
10
$51,630
APPLICATIONS WITHDRAWN
0
$0
10
$77,050
81
$163,876
2
$133,015
2
$35,470
6
$137,613
FILES CLOSED FOR INCOMPLETENESS
0
$0
0
$0
37
$152,322
2
$49,265
0
$0
2
$127,105
Aggregated Statistics For Year 2004 (Based on 2 full tracts)
A) FHA, FSA/RHS & VA Home Purchase Loans
B) Conventional Home Purchase Loans
C) Refinancings
D) Home Improvement Loans
F) Non-occupant Loans on < 5 Family Dwellings (A B C & D)
G) Loans On Manufactured Home Dwelling (A B C & D)
Number
Average Value
Number
Average Value
Number
Average Value
Number
Average Value
Number
Average Value
Number
Average Value
LOANS ORIGINATED
4
$155,678
85
$149,163
187
$146,636
12
$55,998
4
$156,170
20
$112,718
APPLICATIONS APPROVED, NOT ACCEPTED
0
$0
12
$175,383
61
$169,116
4
$32,022
0
$0
6
$150,752
APPLICATIONS DENIED
0
$0
20
$122,374
126
$170,082
14
$88,255
0
$0
18
$114,842
APPLICATIONS WITHDRAWN
0
$0
10
$125,527
77
$189,741
4
$110,352
2
$162,575
4
$139,912
FILES CLOSED FOR INCOMPLETENESS
0
$0
4
$142,868
30
$147,532
2
$24,635
0
$0
2
$24,635
Aggregated Statistics For Year 2003 (Based on 2 full tracts)
A) FHA, FSA/RHS & VA Home Purchase Loans
B) Conventional Home Purchase Loans
C) Refinancings
D) Home Improvement Loans
F) Non-occupant Loans on < 5 Family Dwellings (A B C & D)
Detailed PMIC statistics for the following Tracts:6581.00
2002 - 2018 National Fire Incident Reporting System (NFIRS) incidents
Based on the data from the years 2002 - 2018 the average number of fire incidents per year is 10. The highest number of reported fire incidents - 21 took place in 2003, and the least - 0 in 2004. The data has a growing trend.
When looking into fire subcategories, the most reports belonged to: Structure Fires (56.2%), and Outside Fires (25.0%).
Fire incident types reported to NFIRS in Zip Code 48022


 Nearest zip codes: 48041, 48097, 48006, 48014, 48027, 48002.
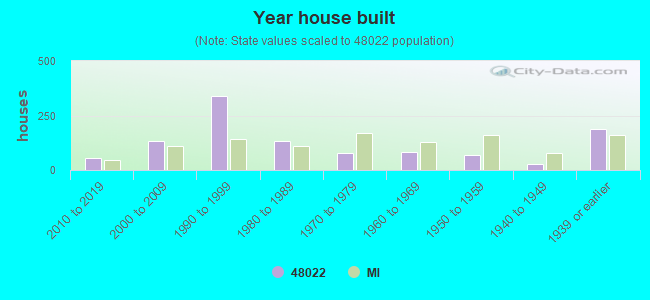


 Based on the data from the years 2002 - 2018 the average number of fire incidents per year is 10. The highest number of reported fire incidents - 21 took place in 2003, and the least - 0 in 2004. The data has a growing trend.
 When looking into fire subcategories, the most reports belonged to: Structure Fires (56.2%), and Outside Fires (25.0%).