Estimated zip code population in 2022: 21,686 Zip code population in 2010: 20,107 Zip code population in 2000: 19,239
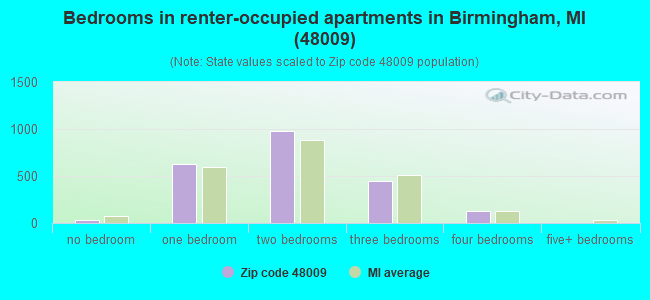
Houses and condos: 10,491 Renter-occupied apartments: 2,211
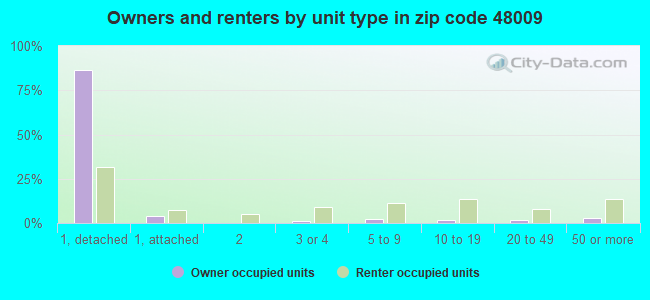
% of renters here:
23%
State:
27%
March 2022 cost of living index in zip code 48009: 101.1 (near average, U.S. average is 100)
Land area: 5.1 sq. mi. Water area: 0.0 sq. mi.
Population density: 4,293 people per square mile
(average).
OSM Map
General Map
Google Map
MSN Map
OSM Map
General Map
Google Map
MSN Map
OSM Map
General Map
Google Map
MSN Map
OSM Map
General Map
Google Map
MSN Map
Please wait while loading the map...
Real estate property taxes paid for housing units in 2022:
This zip code:
1.3% ($10,141)
Michigan:
1.2% ($2,746)
Median real estate property taxes paid for housing units with mortgages in 2022: $10,256 (1.3%) Median real estate property taxes paid for housing units with no mortgage in 2022: $8,377 (1.4%)
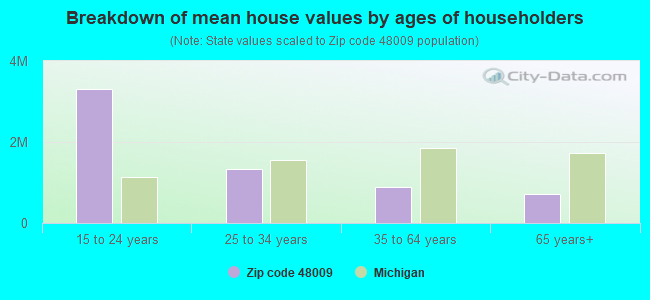
Estimated median house/condo value in 2022: $758,452
48009:
$758,452
Michigan:
$224,400
According to our research of Michigan and other state lists, there were 5 registered sex offenders living in 48009 zip code as of April 27, 2024. The ratio of all residents to sex offenders in zip code 48009 is 4,190 to 1. The ratio of registered sex offenders to all residents in this zip code is much lower than the state average.
Median resident age:
This zip code:
42.4 years
Michigan median age:
40.3 years
Average household size:
This zip code:
2.3 people
Michigan:
2.4 people
Averages for the 2020 tax year for zip code 48009, filed in 2021:
Average Adjusted Gross Income (AGI) in 2020: $353,854 (Individual Income Tax Returns)
Here:
$353,854
State:
$68,945
Salary/wage: $205,348 (reported on 75.6% of returns)
Here:
$205,348
State:
$57,142
(% of AGI for various income ranges: 1040.7% for AGIs below $25k, 3467.1% for AGIs $25k-50k, 6660.2% for AGIs $50k-75k, 10347.9% for AGIs $75k-100k, 19527.6% for AGIs $100k-200k, 159445.4% for AGIs over 200k)
Taxable interest for individuals: $10,815 (reported on 57.0% of returns)
This zip code:
$10,815
Michigan:
$1,630
(% of AGI for various income ranges: 59.5% for AGIs below $25k, 156.4% for AGIs $25k-50k, 115.2% for AGIs $50k-75k, 209.6% for AGIs $75k-100k, 359.1% for AGIs $100k-200k, 6980.4% for AGIs over 200k)
Ordinary dividends: $30,630 (reported on 55.4% of returns)
Here:
$30,630
State:
$6,972
(% of AGI for various income ranges: 170.9% for AGIs below $25k, 360.1% for AGIs $25k-50k, 515.8% for AGIs $50k-75k, 878.3% for AGIs $75k-100k, 1455.9% for AGIs $100k-200k, 18433.4% for AGIs over 200k)
Net capital gain/loss in AGI: +$139,377 (reported on 53.6% of returns)
Here:
+$139,377
State:
+$20,064
(% of AGI for various income ranges: 96.0% for AGIs below $25k, 286.9% for AGIs $25k-50k, 391.6% for AGIs $50k-75k, 690.9% for AGIs $75k-100k, 1561.9% for AGIs $100k-200k, 91670.0% for AGIs over 200k)
Profit/loss from business: +$52,236 (reported on 22.3% of returns)
Here:
+$52,236
State:
+$11,172
(% of AGI for various income ranges: 154.7% for AGIs below $25k, 391.9% for AGIs $25k-50k, 479.4% for AGIs $50k-75k, 634.7% for AGIs $75k-100k, 1526.9% for AGIs $100k-200k, 11755.1% for AGIs over 200k)
Taxable individual retirement arrangement distribution: $37,897 (reported on 13.3% of returns)
48009:
$37,897
Michigan:
$19,803
(% of AGI for various income ranges: 102.3% for AGIs below $25k, 277.1% for AGIs $25k-50k, 437.7% for AGIs $50k-75k, 569.4% for AGIs $75k-100k, 1566.0% for AGIs $100k-200k, 3625.9% for AGIs over 200k)
Self-employed (Keogh) retirement plans: $37,233 (reported on 4.2% of returns)
48009:
$37,233
Michigan:
$25,132
(% of AGI for various income ranges: 75.3% for AGIs $50k-75k, 134.1% for AGIs $100k-200k, 1764.6% for AGIs over 200k)
Total itemized deductions: $64,354 (reported on 30.5% of returns)
Here:
$64,354
State:
$34,117
(% of AGI for various income ranges: 201.3% for AGIs below $25k, 523.3% for AGIs $25k-50k, 688.0% for AGIs $50k-75k, 1197.7% for AGIs $75k-100k, 2121.1% for AGIs $100k-200k, 20602.2% for AGIs over 200k)
Charity contributions: $37,950 (reported on 26.7% of returns)
Here:
$37,950
State:
$13,548
(% of AGI for various income ranges: 12.3% for AGIs below $25k, 51.1% for AGIs $25k-50k, 83.0% for AGIs $50k-75k, 167.7% for AGIs $75k-100k, 381.3% for AGIs $100k-200k, 12174.6% for AGIs over 200k)
Taxes paid: $9,716 (reported on 30.5% of returns)
48009:
$9,716
State:
$7,972
(% of AGI for various income ranges: 46.3% for AGIs below $25k, 130.7% for AGIs $25k-50k, 176.9% for AGIs $50k-75k, 395.5% for AGIs $75k-100k, 654.4% for AGIs $100k-200k, 2500.8% for AGIs over 200k)
Earned income credit: $1,234 (reported on 3.3% of returns)
Here:
$1,234
State:
$2,251
(% of AGI for various income ranges: 24.2% for AGIs below $25k, 26.4% for AGIs $25k-50k)
Percentage of individuals using paid preparers for their 2020 taxes: 92.7%
Here:
93%
State:
93%
(% for various income ranges: 89.4% for AGIs below $25k, 94.1% for AGIs $25k-50k, 91.6% for AGIs $50k-75k, 93.2% for AGIs $75k-100k, 92.2% for AGIs $100k-200k, 95.0% for AGIs over 200k)
Averages for the 2012 tax year for zip code 48009, filed in 2013:
Average Adjusted Gross Income (AGI) in 2012: $227,052 (Individual Income Tax Returns)
Here:
$227,052
State:
$55,609
Salary/wage: $152,658 (reported on 76.9% of returns)
Here:
$152,658
State:
$46,782
(% of AGI for various income ranges: 57.3% for AGIs below $25k, 65.5% for AGIs $25k-50k, 67.3% for AGIs $50k-75k, 64.3% for AGIs $75k-100k, 70.1% for AGIs $100k-200k, 47.2% for AGIs over 200k)
Taxable interest for individuals: $5,622 (reported on 57.2% of returns)
This zip code:
$5,622
Michigan:
$1,491
(% of AGI for various income ranges: 3.1% for AGIs below $25k, 2.0% for AGIs $25k-50k, 1.5% for AGIs $50k-75k, 1.4% for AGIs $75k-100k, 1.1% for AGIs $100k-200k, 1.4% for AGIs over 200k)
Ordinary dividends: $29,746 (reported on 50.9% of returns)
Here:
$29,746
State:
$6,225
(% of AGI for various income ranges: 8.4% for AGIs below $25k, 4.4% for AGIs $25k-50k, 3.8% for AGIs $50k-75k, 4.3% for AGIs $75k-100k, 3.4% for AGIs $100k-200k, 7.4% for AGIs over 200k)
Net capital gain/loss in AGI: +$48,033 (reported on 46.7% of returns)
Here:
+$48,033
State:
+$9,326
(% of AGI for various income ranges: 1.0% for AGIs $50k-75k, 1.6% for AGIs $75k-100k, 2.0% for AGIs $100k-200k, 12.2% for AGIs over 200k)
Profit/loss from business: +$37,613 (reported on 21.3% of returns)
Here:
+$37,613
State:
+$11,523
(% of AGI for various income ranges: 14.8% for AGIs below $25k, 6.3% for AGIs $25k-50k, 5.4% for AGIs $50k-75k, 5.2% for AGIs $75k-100k, 6.0% for AGIs $100k-200k, 2.8% for AGIs over 200k)
Taxable individual retirement arrangement distribution: $41,102 (reported on 16.9% of returns)
48009:
$41,102
Michigan:
$15,298
(% of AGI for various income ranges: 6.1% for AGIs below $25k, 4.5% for AGIs $25k-50k, 4.5% for AGIs $50k-75k, 5.5% for AGIs $75k-100k, 5.0% for AGIs $100k-200k, 2.5% for AGIs over 200k)
Self-employment retirement plans: $27,186 (reported on 4.0% of returns)
48009:
$27,186
Michigan:
$20,834
(% of AGI for various income ranges: 1.0% for AGIs $25k-50k, 0.3% for AGIs $75k-100k, 0.5% for AGIs $100k-200k, 0.5% for AGIs over 200k)
Total itemized deductions: $46,788 (13% of AGI, reported on 60.6% of returns)
Here:
$46,788
State:
$21,628
Here:
13.4% of AGI
State:
18.4% of AGI
(% of AGI for various income ranges: 28.4% for AGIs below $25k, 16.7% for AGIs $25k-50k, 17.2% for AGIs $50k-75k, 18.0% for AGIs $75k-100k, 17.5% for AGIs $100k-200k, 10.9% for AGIs over 200k)
Charity contributions: $9,639 (reported on 54.9% of returns)
Here:
$9,639
State:
$4,225
(% of AGI for various income ranges: 1.6% for AGIs below $25k, 1.5% for AGIs $25k-50k, 1.9% for AGIs $50k-75k, 2.0% for AGIs $75k-100k, 2.1% for AGIs $100k-200k, 2.4% for AGIs over 200k)
Taxes paid: $23,475 (reported on 60.3% of returns)
48009:
$23,475
State:
$8,327
(% of AGI for various income ranges: 9.1% for AGIs below $25k, 6.0% for AGIs $25k-50k, 6.6% for AGIs $50k-75k, 7.7% for AGIs $75k-100k, 8.2% for AGIs $100k-200k, 5.8% for AGIs over 200k)
Earned income credit: $1,585 (reported on 4.6% of returns)
Here:
$1,585
State:
$2,306
(% of AGI for various income ranges: 2.3% for AGIs below $25k, 0.4% for AGIs $25k-50k)
Percentage of individuals using paid preparers for their 2012 taxes: 65.2%
Here:
65%
State:
57%
(% for various income ranges: 58.1% for AGIs below $25k, 58.0% for AGIs $25k-50k, 60.0% for AGIs $50k-75k, 64.3% for AGIs $75k-100k, 64.5% for AGIs $100k-200k, 80.8% for AGIs over 200k)
Averages for the 2004 tax year for zip code 48009, filed in 2005:
Average Adjusted Gross Income (AGI) in 2004: $161,787 (Individual Income Tax Returns)
Here:
$161,787
State:
$48,204
Salary/wage: $117,138 (reported on 76.6% of returns)
Here:
$117,138
State:
$42,791
(% of AGI for various income ranges: 54.7% for AGIs $10k-25k, 68.5% for AGIs $25k-50k, 69.8% for AGIs $50k-75k, 73.6% for AGIs $75k-100k, 50.7% for AGIs over 100k)
Taxable interest for individuals: $6,536 (reported on 71.8% of returns)
This zip code:
$6,536
Michigan:
$1,725
(% of AGI for various income ranges: 7.8% for AGIs $10k-25k, 3.1% for AGIs $25k-50k, 2.5% for AGIs $50k-75k, 1.9% for AGIs $75k-100k, 2.7% for AGIs over 100k)
Taxable dividends: $12,952 (reported on 58.6% of returns)
Here:
$12,952
State:
$3,420
(% of AGI for various income ranges: 7.7% for AGIs $10k-25k, 4.1% for AGIs $25k-50k, 3.8% for AGIs $50k-75k, 3.6% for AGIs $75k-100k, 4.5% for AGIs over 100k)
Net capital gain/loss: +$61,641 (reported on 52.9% of returns)
Here:
+$61,641
State:
+$8,532
(% of AGI for various income ranges: 0.6% for AGIs $10k-25k, 1.3% for AGIs $25k-50k, 1.3% for AGIs $50k-75k, 2.1% for AGIs $75k-100k, 22.0% for AGIs over 100k)
Profit/loss from business: +$27,799 (reported on 19.3% of returns)
Here:
+$27,799
State:
+$9,547
(% of AGI for various income ranges: 9.9% for AGIs $10k-25k, 6.7% for AGIs $25k-50k, 5.1% for AGIs $50k-75k, 4.3% for AGIs $75k-100k, 2.8% for AGIs over 100k)
IRA payment deduction: $3,546 (reported on 3.2% of returns)
48009:
$3,546
Michigan:
$2,875
(% of AGI for various income ranges: 0.4% for AGIs $10k-25k, 0.3% for AGIs $25k-50k, 0.1% for AGIs $50k-75k, 0.2% for AGIs $75k-100k, 0.0% for AGIs over 100k)
Self-employed pension: $18,571 (reported on 3.8% of returns)
Here:
$18,571
Michigan:
$13,826
(% of AGI for various income ranges: 0.2% for AGIs $10k-25k, 0.2% for AGIs $25k-50k, 0.4% for AGIs $50k-75k, 0.4% for AGIs $75k-100k, 0.4% for AGIs over 100k)
Total itemized deductions: $36,856 (15% of AGI, reported on 63.3% of returns)
Here:
$36,856
State:
$18,509
Here:
14.8% of AGI
State:
20.7% of AGI
(% of AGI for various income ranges: 31.5% for AGIs $10k-25k, 22.1% for AGIs $25k-50k, 23.3% for AGIs $50k-75k, 21.9% for AGIs $75k-100k, 12.3% for AGIs over 100k)
Charity contributions deductions: $7,547 (3% of AGI, reported on 59.0% of returns)
Here:
$7,547
State:
$3,365
Here:
2.9% of AGI
State:
3.6% of AGI
(% of AGI for various income ranges: 2.5% for AGIs $10k-25k, 2.3% for AGIs $25k-50k, 2.5% for AGIs $50k-75k, 2.6% for AGIs $75k-100k, 2.7% for AGIs over 100k)
Total tax: $39,514 (reported on 84.1% of returns)
48009:
$39,514
State:
$7,691
(% of AGI for various income ranges: 5.3% for AGIs $10k-25k, 8.7% for AGIs $25k-50k, 11.0% for AGIs $50k-75k, 11.8% for AGIs $75k-100k, 21.5% for AGIs over 100k)
Earned income credit: $991 (reported on 3.2% of returns)
Here:
$991
State:
$1,737
Percentage of individuals using paid preparers for their 2004 taxes: 66.2%
Here:
66%
State:
60%
(% for various income ranges: 62.7% for AGIs below $10k, 61.9% for AGIs $10k-25k, 61.7% for AGIs $25k-50k, 62.1% for AGIs $50k-75k, 63.3% for AGIs $75k-100k, 73.5% for AGIs over 100k)
Likely homosexual households (counted as self-reported same-sex unmarried-partner households)
Lesbian couples: 0.2% of all households
Gay men: 0.3% of all households
Household received Food Stamps/SNAP in the past 12 months: 181 Household did not receive Food Stamps/SNAP in the past 12 months: 9,303
Women who had a birth in the past 12 months: 134 (126 now married, 10 unmarried) Women who did not have a birth in the past 12 months: 4,390 (2,181 now married, 2,198 unmarried)
Housing units in zip code 48009 with a mortgage: 5,016 (553 second mortgage, 498 both second mortgage and home equity loan) Houses without a mortgage: 289
Median monthly owner costs for units with a mortgage: $3,203 Median monthly owner costs for units without a mortgage: $1,161
Residents with income below the poverty level in 2022:
This zip code:
5.6%
Whole state:
13.4%
Residents with income below 50% of the poverty level in 2022:
This zip code:
2.9%
Whole state:
6.9%
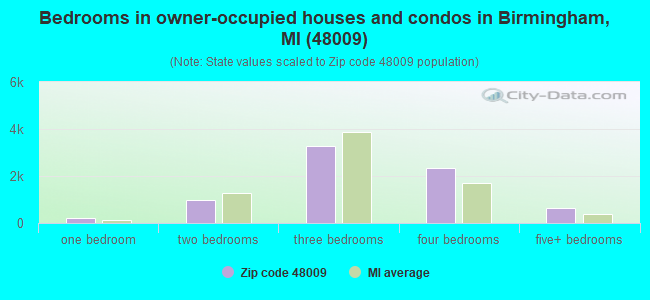
Median number of rooms in houses and condos:
Here:
7.7
State:
6.5
Median number of rooms in apartments:
Here:
4.4
State:
4.3
Notable locations in this zip code not listed on our city pages
Notable locations in zip code 48009: Birmingham Golf Club (A), Lincoln Hills Golf Course (B), Beaumont Rehabilitation and Health Center (C), Birmingham Chamber of Commerce (D), Birmingham Fire Department Adams Station (E), Birmingham Fire Department Chesterfield Station (F). Display/hide their locations on the map
Shopping Centers: Kroger Retail Center Shopping Center (1), Adams Square Shopping Center (2), The Plaza Picadilly Shopping Center (3). Display/hide their locations on the map
Cemeteries: Greenwood Cemetery (1), Clover Hill Park Cemetery (2), First United Methodist Church of Birmingham Columbarium (3), Saint James' Episcopal Church Columbarium (4). Display/hide their locations on the map
Parks in zip code 48009 include: Springdale Park (1), Booth Park (2), Greenwood Cemetery Historical Marker (3), Crestview Park (4), Eton Park (5), Howarth Park (6), Linden Park (7), Manor Park (8), Pembroke Park (9). Display/hide their locations on the map
Size of family households: 2,496 2-persons, 972 3-persons, 1,436 4-persons, 442 5-persons, 217 6-persons
Size of nonfamily households: 3,577 1-person, 416 2-persons
4,586 married couples with children.
941 single-parent households (289 men, 652 women).
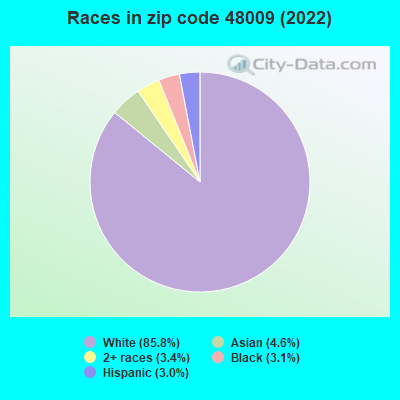
89.3% of residents of 48009 zip code speak English at home.
1.4% of residents speak Spanish at home (84% very well, 16% well).
6.1% of residents speak other Indo-European language at home (86% very well, 13% well, 1% not well).
1.6% of residents speak Asian or Pacific Island language at home (82% very well, 7% well, 11% not well).
1.4% of residents speak other language at home (93% very well, 7% well).
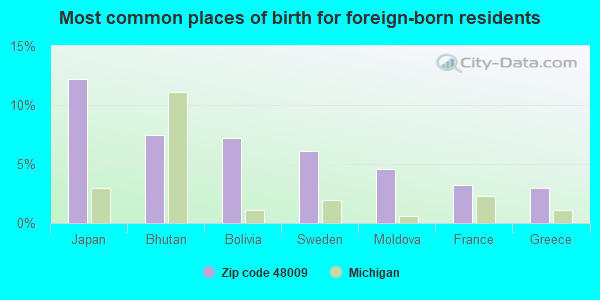
Foreign born population: 2,351 (10.8%) (65.3% of them are naturalized citizens)
Major facilities with environmental interests located in this zip code:
CHEMICO SYSTEMS INCORPORATED (2010 COLE STREET in BIRMINGHAM, MI)
AIR MINOR (AIRS/AFS) (Resource Conservation and Recovery Act (tracking hazardous waste)) TRI REPORTER (Tracking of toxic chemicals releasing facilities) Business SIC classification: INDUSTRIAL ORGANIC CHEMICALS Business NAICS classification: ALL OTHER MISCELLANEOUS CHEMICAL PRODUCT AND PREPARATION MANUFACTURING. Organizations: TECHSYS INC (PROPERTY OWNER) (CONTACT/OWNER)
, DRUSILLA PEASE (PROPERTY OWNER) (CONTACT/OWNER)
Alternative names: PRODUCT SOL INCORPORATED
ETON ACADEMY (1755 EAST MELTON ROAD in BIRMINGHAM, MI)
(Integrated Compliance Information System) - ICIS-05-1989-0186, FORMAL ENFORCEMENT ACTION COMPLIANCE ACTIVITY (Tracking inspections of insecticide, fungicide, and rodenticide, and toxic substances) Business SIC classification: CHILD DAY CARE SERVICES
ERNEST W. SEAHOLM HIGH SCHOOL (2436 W. LINCOLN ROAD in BIRMINGHAM, MI)
(National Center for Education Statistics) - STATE ID-01154 Organizations: BIRMINGHAM CITY SCHOOL DISTRICT (SCHOOL DISTRICT)
AMOCO OIL CO 0768 (451 S EATON in BIRMINGHAM, MI)
(Resource Conservation and Recovery Act (tracking hazardous waste)) Organizations: AMOCO OIL COMPANY (CONTACT/OWNER)
AMOCO OIL CO 5349 BIRMINGHAM (1088 MAPLE in BIRMINGHAM, MI)
(Resource Conservation and Recovery Act (tracking hazardous waste)) Organizations: AMOCO OIL COMPANY (CONTACT/OWNER)
AMOCO OIL CO ALS VILLAGE (31015 SOUTHFIELD in BIRMINGHAM, MI)
(Resource Conservation and Recovery Act (tracking hazardous waste)) Organizations: AMOCO OIL COMPANY (CONTACT/OWNER)
AT&T (2100 PALMER RD in BIRMINGHAM, MI)
(Resource Conservation and Recovery Act (tracking hazardous waste)) Organizations: AT & T (CONTACT/OWNER)
BIRMINGHAM CAMERA SHOP (168 S OLD WOODWARD in BIRMINGHAM, MI)
(Resource Conservation and Recovery Act (tracking hazardous waste)) Organizations: DAY WILLIAM (CONTACT/OWNER)
BIRMINGHAM CLEANERS INC (2531 W MAPLE in BIRMINGHAM, MI)
(Resource Conservation and Recovery Act (tracking hazardous waste)) Organizations: KALBFEISCH H M (CONTACT/OWNER)
BIRMINGHAM CSO RTB (700 LINDEN ST in BIRMINGHAM, MI)
National Pollutant Discharge Elimination System NON-MAJOR (Tracking pollutant discharge elimination systems) - permit Business SIC classification: SEWERAGE SYSTEMS Organizations: BIRMINGHAM CSO DRAIN DIST/CITY (CONTACT/OWNER)
Alternative names: BIRMINGHAM CSO RETENTION TREAT
FIRST UNITED METHODIST CHURCH (1589 WEST MAPLE RD in BIRMINGHAM, MI)
(Resource Conservation and Recovery Act (tracking hazardous waste)) Organizations: WILLIAM PETTIBONE (CONTACT/OPERATOR)
BLOOMFIELD VILLAGE CSO RETENTI (1200 SOUTH CRANBROOK RD in BIRMINGHAM, MI)
National Pollutant Discharge Elimination System NON-MAJOR (Tracking pollutant discharge elimination systems) - permit Business SIC classification: SEWERAGE SYSTEMS Organizations: BLOOMF VILL CSO DRAIN DIST/BLO (CONTACT/OWNER)
GROVES HIGH SCHOOL (20500 W 13 MILE RD in BIRMINGHAM, MI)
(Resource Conservation and Recovery Act (tracking hazardous waste)) Organizations: BIRMINGHAM PUBLIC SCHOOLS (CONTACT/OPERATOR)
Housing units lacking complete plumbing facilities: 0.3% Housing units lacking complete kitchen facilities: 0.4%
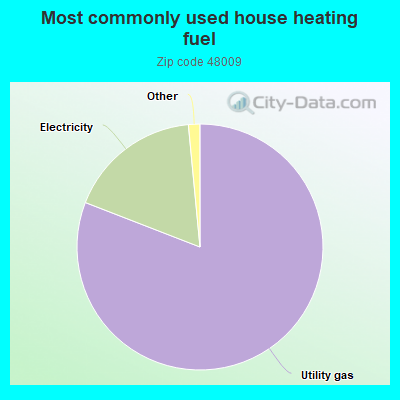
80.9%Utility gas
17.6%Electricity
0.8%Bottled, tank, or LP gas
0.5%Other fuel
Population in 1990: 19,611.
Place of birth for U.S.-born residents:
This state: 14,241
Northeast: 1,092
Midwest: 2,016
South: 997
West: 743
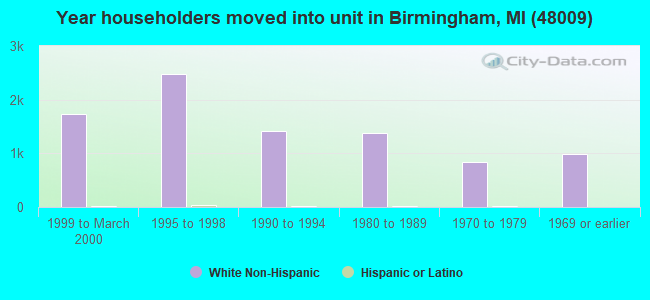
58% of the 48009 zip code residents lived in the same house 5 years ago. Out of people who lived in different houses, 63% lived in this county. Out of people who lived in different counties, 50% lived in Michigan.
90% of the 48009 zip code residents lived in the same house 1 year ago. Out of people who lived in different houses, 53% moved from this county. Out of people who lived in different houses, 15% moved from different county within same state. Out of people who lived in different houses, 27% moved from different state. Out of people who lived in different houses, 8% moved from abroad.
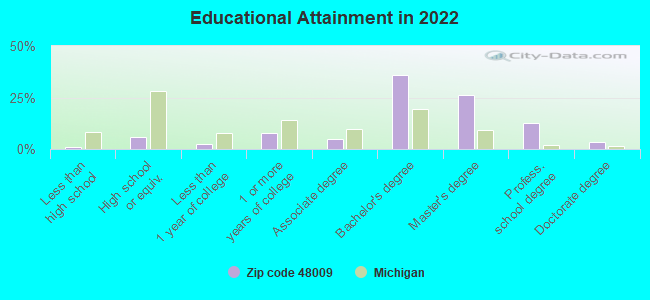
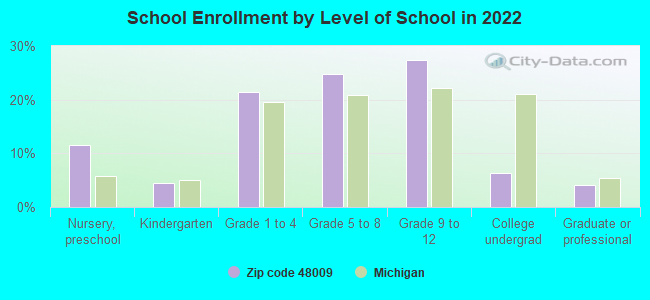
Private vs. public school enrollment:
Students in private schools in grades 1 to 8 (elementary and middle school): 508
Here:
20.3%
Michigan:
12.4%
Students in private schools in grades 9 to 12 (high school): 373
Here:
25.3%
Michigan:
9.8%
Students in private undergraduate colleges: 73
Here:
21.5%
Michigan:
14.9%
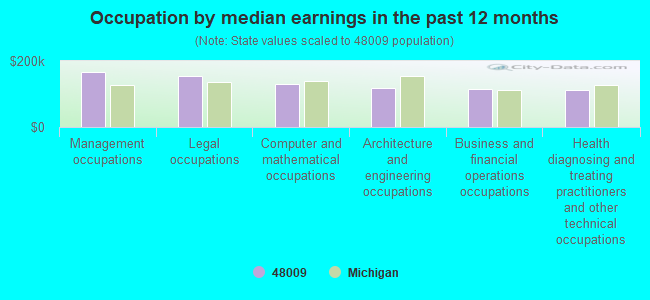
Occupation by median earnings in the past 12 months ($)
166,824Management occupations
155,217Legal occupations
128,872Computer and mathematical occupations
118,096Architecture and engineering occupations
114,758Business and financial operations occupations
113,192Health diagnosing and treating practitioners and other technical occupations
Companies with federal contracts located in this zip code (BIRMINGHAM, MI):
THE SHWAYDER COMPANY (2335 E. LINCOLN STREET; small business) : $5,632,592 in 78 contractsfrom 1999 to 2006
Contracts for Aircraft Landing Gear Components by Defense Logistics Agency, Air Force Signed by year:2000: $850,295; 2001: $797,802; 2002: $468,510; 2003: $57,748; 2004: $1,827,537; 2005: $1,323,150; 2006: $253,550.
Biggest contracts:
$662,143 with Defense Logistics Agency for Aircraft Landing Gear Components. Signed on 2004-05-31. Completion date: 2004-10-28.
$290,880, same as above.Signed on 2000-05-26. Completion date: 2000-09-23.
$195,435, same as above.Signed on 2001-05-30. Completion date: 2001-10-27.
$178,080, same as above.Signed on 2005-08-31. Completion date: 2005-11-10.
STATE PAINTING COMPANY, INC (1653 EAST MAPLE RD; small business) : $1,122,006 in 51 contractsfrom 2002 to 2004
Contracts for Maintenance, Repair or Alteration of Real Property -- Miscellaneous Buildings, Construction of Structures and Facilities -- Office Buildings, Construction of Structures and Facilities -- Family Housing Facilities, Construction of Structures and Facilities -- Other Residential Buildings, and moreby Army Signed by year:2000: $0; 2001: $0; 2002: $140,606; 2003: $386,432; 2004: $594,968; 2005: $0; 2006: $0.
Biggest contracts:
$70,396 with Army for Maintenance, Repair or Alteration of Real Property -- Miscellaneous Buildings. Signed on 2003-09-23. Completion date: 2003-12-30.
$66,329, same as above.Signed on 2004-04-15. Completion date: 2004-07-30.
$57,225, same as above.Signed on 2003-09-26. Completion date: 2004-06-15.
$52,009 with Army for Construction of Structures and Facilities -- Office Buildings. Signed on 2003-06-05. Completion date: 2003-06-27.
GIFFORD, KRASS, GROH, SPRINKLE (280 N OLD WOODWARD AVE STE; small business) : $422,541 in 20 contractsfrom 2002 to 2006
Contracts for Legal Services by Army Signed by year:2000: $0; 2001: $0; 2002: $0; 2003: $97,541; 2004: $105,000; 2005: $155,000; 2006: $65,000.
Biggest contracts:
$75,000 with Army for Legal Services. Signed on 2005-09-20. Completion date: 2005-09-30.
$65,000, same as above.Signed on 2006-03-30. Completion date: 2005-09-30.
$60,000, same as above.Signed on 2005-03-28. Completion date: 2005-09-30.
$52,541, same as above.Signed on 2003-09-17. Completion date: 2005-09-30.
3D REALITY NET (346 PARK STREET SUITE C; small business) : $229,288 in 3 contractsfrom 2000 to 2002
$115,000 with Army for Lease or Rental of Equipment -- Service and Trade Equipment. Signed on 2002-09-17. Completion date: 2003-09-15.
$84,000 with Army for Data Analyses (other than scientific). Signed on 2001-01-11. Completion date: 2001-02-05.
$30,288 with Army for Maintenance, Repair or Alteration of Real Property -- Exhibit Design (Non-Building). Signed on 2000-02-14. Completion date: 2000-03-09.
THE UNIVERSITY GROUP INC (380 N OLD WOODWARD STE 23; small business) : $168,470 in 3 contractsfrom 2002 to 2003
$68,550 with Army for Program Management/Support Services. Signed on 2003-05-09. Completion date: 2003-08-07.
$50,000, same as above.Signed on 2003-04-25. Completion date: 2003-05-10.
$49,920, same as above.Signed on 2002-05-10. Completion date: 2003-05-10.
Top industries in this zip code by the number of employees in 2005:
Administrative and Support and Waste Management and Remediation Services: Professional Employer Organizations (250-499: 1, 100-249: 3, 50-99: 2, 10-19: 1)
Professional, Scientific, and Technical Services: Human Resources and Executive Search Consulting Services (100-249: 4, 50-99: 1, 10-19: 3, 1-4: 5)
Administrative and Support and Waste Management and Remediation Services: Office Administrative Services (250-499: 1, 100-249: 1, 50-99: 2, 20-49: 1, 10-19: 1, 1-4: 2)
Professional, Scientific, and Technical Services: Offices of Lawyers (20-49: 12, 10-19: 8, 5-9: 10, 1-4: 64)
Administrative and Support and Waste Management and Remediation Services: Exterminating and Pest Control Services (100-249: 3)
2002 - 2018 National Fire Incident Reporting System (NFIRS) incidents
Based on the data from the years 2002 - 2018 the average number of fire incidents per year is 24. The highest number of reported fire incidents - 59 took place in 2016, and the least - 0 in 2011. The data has a dropping trend.
When looking into fire subcategories, the most reports belonged to: Structure Fires (50.6%), and Outside Fires (27.7%).
Fire incident types reported to NFIRS in Zip Code 48009

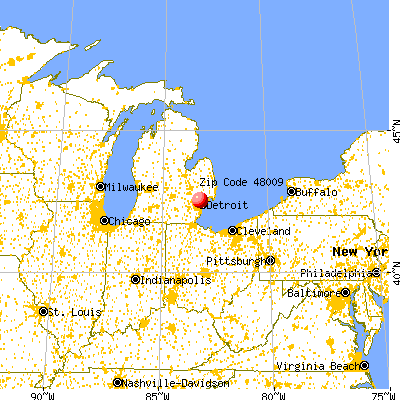


 Nearest zip codes: 48084, 48304, 48076, 48025, 48072, 48073.
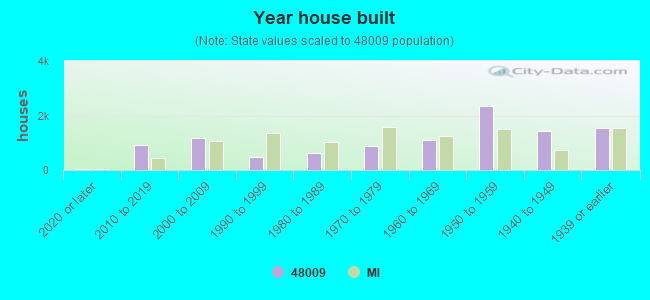


 Based on the data from the years 2002 - 2018 the average number of fire incidents per year is 24. The highest number of reported fire incidents - 59 took place in 2016, and the least - 0 in 2011. The data has a dropping trend.
 When looking into fire subcategories, the most reports belonged to: Structure Fires (50.6%), and Outside Fires (27.7%).