Estimated zip code population in 2022: 33,741 Zip code population in 2010: 32,798 Zip code population in 2000: 34,713
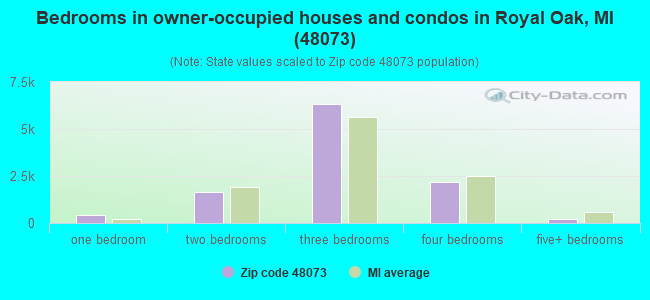
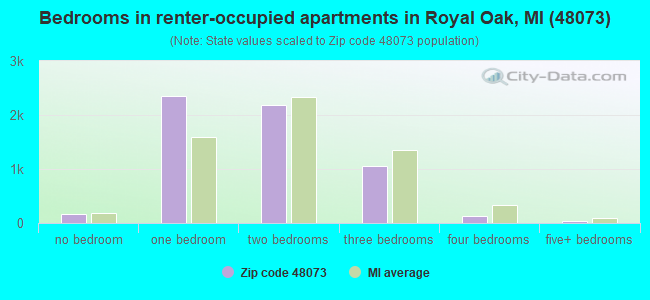
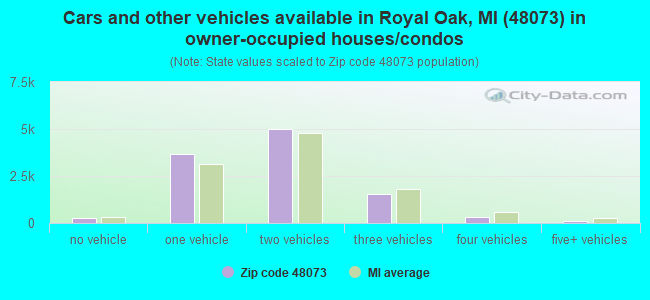
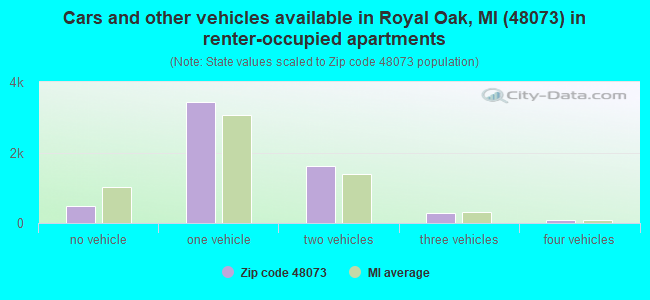
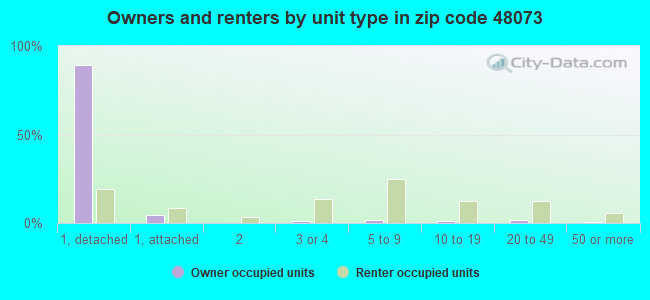
Houses and condos: 17,764 Renter-occupied apartments: 5,884
% of renters here:
35%
State:
27%
March 2022 cost of living index in zip code 48073: 97.0 (near average, U.S. average is 100)
Land area: 7.4 sq. mi. Water area: 0.0 sq. mi.
Population density: 4,575 people per square mile
(average).
OSM Map
General Map
Google Map
MSN Map
OSM Map
General Map
Google Map
MSN Map
OSM Map
General Map
Google Map
MSN Map
OSM Map
General Map
Google Map
MSN Map
Please wait while loading the map...
Real estate property taxes paid for housing units in 2022:
This zip code:
1.3% ($4,041)
Michigan:
1.2% ($2,746)
Median real estate property taxes paid for housing units with mortgages in 2022: $4,418 (1.3%) Median real estate property taxes paid for housing units with no mortgage in 2022: $3,485 (1.3%)
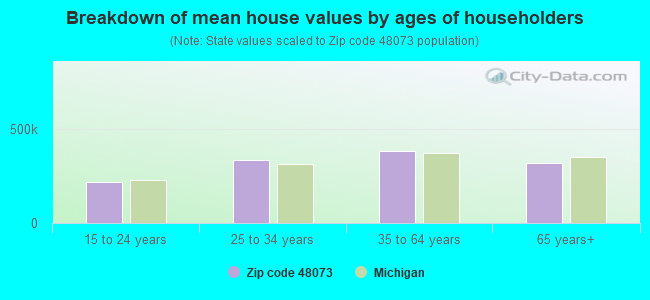
Estimated median house/condo value in 2022: $319,695
48073:
$319,695
Michigan:
$224,400
According to our research of Michigan and other state lists, there were 19 registered sex offenders living in 48073 zip code as of April 27, 2024. The ratio of all residents to sex offenders in zip code 48073 is 1,806 to 1. The ratio of registered sex offenders to all residents in this zip code is much lower than the state average.
Median resident age:
This zip code:
37.1 years
Michigan median age:
40.3 years
Average household size:
This zip code:
2.0 people
Michigan:
2.4 people
Averages for the 2020 tax year for zip code 48073, filed in 2021:
Average Adjusted Gross Income (AGI) in 2020: $81,435 (Individual Income Tax Returns)
Here:
$81,435
State:
$68,945
Salary/wage: $76,523 (reported on 80.5% of returns)
Here:
$76,523
State:
$57,142
(% of AGI for various income ranges: 986.5% for AGIs below $25k, 3535.1% for AGIs $25k-50k, 6601.3% for AGIs $50k-75k, 9536.5% for AGIs $75k-100k, 18957.6% for AGIs $100k-200k, 66261.1% for AGIs over 200k)
Taxable interest for individuals: $957 (reported on 40.8% of returns)
This zip code:
$957
Michigan:
$1,630
(% of AGI for various income ranges: 23.8% for AGIs below $25k, 28.4% for AGIs $25k-50k, 35.2% for AGIs $50k-75k, 53.3% for AGIs $75k-100k, 97.7% for AGIs $100k-200k, 452.7% for AGIs over 200k)
Ordinary dividends: $4,022 (reported on 30.5% of returns)
Here:
$4,022
State:
$6,972
(% of AGI for various income ranges: 52.6% for AGIs below $25k, 71.3% for AGIs $25k-50k, 110.2% for AGIs $50k-75k, 204.1% for AGIs $75k-100k, 254.9% for AGIs $100k-200k, 1797.3% for AGIs over 200k)
Net capital gain/loss in AGI: +$9,452 (reported on 27.6% of returns)
Here:
+$9,452
State:
+$20,064
(% of AGI for various income ranges: 17.1% for AGIs below $25k, 52.7% for AGIs $25k-50k, 105.0% for AGIs $50k-75k, 197.9% for AGIs $75k-100k, 401.7% for AGIs $100k-200k, 7293.3% for AGIs over 200k)
Profit/loss from business: +$15,098 (reported on 15.0% of returns)
Here:
+$15,098
State:
+$11,172
(% of AGI for various income ranges: 130.3% for AGIs below $25k, 158.2% for AGIs $25k-50k, 208.7% for AGIs $50k-75k, 244.9% for AGIs $75k-100k, 441.2% for AGIs $100k-200k, 3602.0% for AGIs over 200k)
Taxable individual retirement arrangement distribution: $17,314 (reported on 10.7% of returns)
48073:
$17,314
Michigan:
$19,803
(% of AGI for various income ranges: 101.4% for AGIs below $25k, 150.7% for AGIs $25k-50k, 212.1% for AGIs $50k-75k, 330.7% for AGIs $75k-100k, 530.2% for AGIs $100k-200k, 1243.8% for AGIs over 200k)
Self-employed (Keogh) retirement plans: $19,965 (reported on 0.9% of returns)
48073:
$19,965
Michigan:
$25,132
(% of AGI for various income ranges: 19.9% for AGIs $50k-75k, 22.3% for AGIs $100k-200k, 538.0% for AGIs over 200k)
Total itemized deductions: $23,698 (reported on 11.7% of returns)
Here:
$23,698
State:
$34,117
(% of AGI for various income ranges: 68.3% for AGIs below $25k, 142.9% for AGIs $25k-50k, 259.2% for AGIs $50k-75k, 565.4% for AGIs $75k-100k, 714.0% for AGIs $100k-200k, 3368.7% for AGIs over 200k)
Charity contributions: $5,317 (reported on 8.5% of returns)
Here:
$5,317
State:
$13,548
(% of AGI for various income ranges: 3.9% for AGIs below $25k, 16.2% for AGIs $25k-50k, 33.5% for AGIs $50k-75k, 63.2% for AGIs $75k-100k, 106.8% for AGIs $100k-200k, 843.6% for AGIs over 200k)
Taxes paid: $8,197 (reported on 11.7% of returns)
48073:
$8,197
State:
$7,972
(% of AGI for various income ranges: 12.2% for AGIs below $25k, 36.2% for AGIs $25k-50k, 91.6% for AGIs $50k-75k, 210.1% for AGIs $75k-100k, 298.4% for AGIs $100k-200k, 989.6% for AGIs over 200k)
Earned income credit: $1,422 (reported on 5.9% of returns)
Here:
$1,422
State:
$2,251
(% of AGI for various income ranges: 36.4% for AGIs below $25k, 22.3% for AGIs $25k-50k)
Percentage of individuals using paid preparers for their 2020 taxes: 91.9%
Here:
92%
State:
93%
(% for various income ranges: 86.7% for AGIs below $25k, 92.5% for AGIs $25k-50k, 92.5% for AGIs $50k-75k, 93.5% for AGIs $75k-100k, 94.6% for AGIs $100k-200k, 96.0% for AGIs over 200k)
Averages for the 2012 tax year for zip code 48073, filed in 2013:
Average Adjusted Gross Income (AGI) in 2012: $59,987 (Individual Income Tax Returns)
Here:
$59,987
State:
$55,609
Salary/wage: $56,691 (reported on 81.2% of returns)
Here:
$56,691
State:
$46,782
(% of AGI for various income ranges: 66.4% for AGIs below $25k, 77.2% for AGIs $25k-50k, 77.7% for AGIs $50k-75k, 78.9% for AGIs $75k-100k, 82.7% for AGIs $100k-200k, 66.3% for AGIs over 200k)
Taxable interest for individuals: $997 (reported on 40.1% of returns)
This zip code:
$997
Michigan:
$1,491
(% of AGI for various income ranges: 1.5% for AGIs below $25k, 0.7% for AGIs $25k-50k, 0.6% for AGIs $50k-75k, 0.6% for AGIs $75k-100k, 0.4% for AGIs $100k-200k, 0.9% for AGIs over 200k)
Ordinary dividends: $3,834 (reported on 26.4% of returns)
Here:
$3,834
State:
$6,225
(% of AGI for various income ranges: 2.9% for AGIs below $25k, 1.6% for AGIs $25k-50k, 1.2% for AGIs $50k-75k, 1.3% for AGIs $75k-100k, 1.2% for AGIs $100k-200k, 3.0% for AGIs over 200k)
Net capital gain/loss in AGI: +$2,061 (reported on 20.9% of returns)
Here:
+$2,061
State:
+$9,326
(% of AGI for various income ranges: 0.1% for AGIs $25k-50k, 0.2% for AGIs $50k-75k, 0.5% for AGIs $75k-100k, 0.6% for AGIs $100k-200k, 2.7% for AGIs over 200k)
Profit/loss from business: +$12,703 (reported on 14.0% of returns)
Here:
+$12,703
State:
+$11,523
(% of AGI for various income ranges: 7.4% for AGIs below $25k, 3.5% for AGIs $25k-50k, 2.5% for AGIs $50k-75k, 2.5% for AGIs $75k-100k, 2.5% for AGIs $100k-200k, 2.6% for AGIs over 200k)
Taxable individual retirement arrangement distribution: $12,524 (reported on 12.8% of returns)
48073:
$12,524
Michigan:
$15,298
(% of AGI for various income ranges: 5.1% for AGIs below $25k, 2.7% for AGIs $25k-50k, 3.3% for AGIs $50k-75k, 2.8% for AGIs $75k-100k, 2.4% for AGIs $100k-200k, 1.4% for AGIs over 200k)
Self-employment retirement plans: $11,708 (reported on 0.6% of returns)
48073:
$11,708
Michigan:
$20,834
(% of AGI for various income ranges: 0.2% for AGIs $50k-75k, 0.1% for AGIs $100k-200k, 0.4% for AGIs over 200k)
Total itemized deductions: $17,936 (18% of AGI, reported on 38.6% of returns)
Here:
$17,936
State:
$21,628
Here:
17.8% of AGI
State:
18.4% of AGI
(% of AGI for various income ranges: 11.6% for AGIs below $25k, 9.2% for AGIs $25k-50k, 11.6% for AGIs $50k-75k, 12.3% for AGIs $75k-100k, 13.2% for AGIs $100k-200k, 9.8% for AGIs over 200k)
Charity contributions: $2,521 (reported on 32.2% of returns)
Here:
$2,521
State:
$4,225
(% of AGI for various income ranges: 0.9% for AGIs below $25k, 1.1% for AGIs $25k-50k, 1.2% for AGIs $50k-75k, 1.4% for AGIs $75k-100k, 1.6% for AGIs $100k-200k, 1.3% for AGIs over 200k)
Taxes paid: $7,413 (reported on 38.5% of returns)
48073:
$7,413
State:
$8,327
(% of AGI for various income ranges: 2.6% for AGIs below $25k, 2.8% for AGIs $25k-50k, 4.2% for AGIs $50k-75k, 5.0% for AGIs $75k-100k, 6.0% for AGIs $100k-200k, 5.5% for AGIs over 200k)
Earned income credit: $1,513 (reported on 9.1% of returns)
Here:
$1,513
State:
$2,306
(% of AGI for various income ranges: 2.8% for AGIs below $25k, 0.4% for AGIs $25k-50k)
Percentage of individuals using paid preparers for their 2012 taxes: 51.4%
Here:
51%
State:
57%
(% for various income ranges: 49.1% for AGIs below $25k, 48.7% for AGIs $25k-50k, 52.4% for AGIs $50k-75k, 54.3% for AGIs $75k-100k, 55.0% for AGIs $100k-200k, 68.8% for AGIs over 200k)
Averages for the 2004 tax year for zip code 48073, filed in 2005:
Average Adjusted Gross Income (AGI) in 2004: $51,043 (Individual Income Tax Returns)
Here:
$51,043
State:
$48,204
Salary/wage: $49,465 (reported on 82.7% of returns)
Here:
$49,465
State:
$42,791
(% of AGI for various income ranges: 94.1% for AGIs below $10k, 64.8% for AGIs $10k-25k, 78.7% for AGIs $25k-50k, 81.7% for AGIs $50k-75k, 84.4% for AGIs $75k-100k, 80.0% for AGIs over 100k)
Taxable interest for individuals: $1,589 (reported on 57.2% of returns)
This zip code:
$1,589
Michigan:
$1,725
(% of AGI for various income ranges: 8.8% for AGIs below $10k, 4.1% for AGIs $10k-25k, 2.0% for AGIs $25k-50k, 1.4% for AGIs $50k-75k, 0.9% for AGIs $75k-100k, 1.7% for AGIs over 100k)
Taxable dividends: $2,496 (reported on 34.8% of returns)
Here:
$2,496
State:
$3,420
(% of AGI for various income ranges: 7.6% for AGIs below $10k, 3.3% for AGIs $10k-25k, 1.7% for AGIs $25k-50k, 1.5% for AGIs $50k-75k, 1.2% for AGIs $75k-100k, 1.7% for AGIs over 100k)
Net capital gain/loss: +$3,750 (reported on 26.4% of returns)
Here:
+$3,750
State:
+$8,532
(% of AGI for various income ranges: -1.7% for AGIs below $10k, -0.4% for AGIs $10k-25k, 0.4% for AGIs $25k-50k, 0.7% for AGIs $50k-75k, 0.9% for AGIs $75k-100k, 4.6% for AGIs over 100k)
Profit/loss from business: +$11,521 (reported on 12.6% of returns)
Here:
+$11,521
State:
+$9,547
(% of AGI for various income ranges: 4.8% for AGIs below $10k, 5.3% for AGIs $10k-25k, 3.1% for AGIs $25k-50k, 2.2% for AGIs $50k-75k, 2.6% for AGIs $75k-100k, 2.7% for AGIs over 100k)
IRA payment deduction: $2,753 (reported on 2.5% of returns)
48073:
$2,753
Michigan:
$2,875
(% of AGI for various income ranges: 0.3% for AGIs below $10k, 0.2% for AGIs $10k-25k, 0.2% for AGIs $25k-50k, 0.1% for AGIs $50k-75k, 0.1% for AGIs $75k-100k, 0.1% for AGIs over 100k)
Self-employed pension: $10,333 (reported on 0.8% of returns)
Here:
$10,333
Michigan:
$13,826
(% of AGI for various income ranges: 0.1% for AGIs $25k-50k, 0.1% for AGIs $50k-75k, 0.2% for AGIs $75k-100k, 0.2% for AGIs over 100k)
Total itemized deductions: $16,372 (21% of AGI, reported on 46.2% of returns)
Here:
$16,372
State:
$18,509
Here:
20.8% of AGI
State:
20.7% of AGI
(% of AGI for various income ranges: 21.4% for AGIs below $10k, 12.8% for AGIs $10k-25k, 13.5% for AGIs $25k-50k, 16.1% for AGIs $50k-75k, 16.3% for AGIs $75k-100k, 14.0% for AGIs over 100k)
Charity contributions deductions: $2,361 (3% of AGI, reported on 41.8% of returns)
Here:
$2,361
State:
$3,365
Here:
2.9% of AGI
State:
3.6% of AGI
(% of AGI for various income ranges: 1.4% for AGIs below $10k, 1.4% for AGIs $10k-25k, 1.6% for AGIs $25k-50k, 1.9% for AGIs $50k-75k, 2.0% for AGIs $75k-100k, 2.2% for AGIs over 100k)
Total tax: $7,423 (reported on 83.8% of returns)
48073:
$7,423
State:
$7,691
(% of AGI for various income ranges: 3.5% for AGIs below $10k, 4.9% for AGIs $10k-25k, 8.7% for AGIs $25k-50k, 11.0% for AGIs $50k-75k, 11.6% for AGIs $75k-100k, 16.6% for AGIs over 100k)
Earned income credit: $1,204 (reported on 5.7% of returns)
Here:
$1,204
State:
$1,737
Percentage of individuals using paid preparers for their 2004 taxes: 53.2%
Here:
53%
State:
60%
(% for various income ranges: 50.0% for AGIs below $10k, 55.0% for AGIs $10k-25k, 51.9% for AGIs $25k-50k, 53.1% for AGIs $50k-75k, 53.7% for AGIs $75k-100k, 57.9% for AGIs over 100k)
Likely homosexual households (counted as self-reported same-sex unmarried-partner households)
Lesbian couples: 0.1% of all households
Gay men: 0.0% of all households
Household received Food Stamps/SNAP in the past 12 months: 821 Household did not receive Food Stamps/SNAP in the past 12 months: 15,842
Women who had a birth in the past 12 months: 368 (325 now married, 49 unmarried) Women who did not have a birth in the past 12 months: 8,236 (3,144 now married, 5,094 unmarried)
Housing units in zip code 48073 with a mortgage: 6,980 (623 second mortgage, 10 home equity loan, 544 both second mortgage and home equity loan) Houses without a mortgage: 154
Median monthly owner costs for units with a mortgage: $1,760 Median monthly owner costs for units without a mortgage: $606
Residents with income below the poverty level in 2022:
This zip code:
6.8%
Whole state:
13.4%
Residents with income below 50% of the poverty level in 2022:
This zip code:
3.1%
Whole state:
6.9%
Median number of rooms in houses and condos:
Here:
6.3
State:
6.5
Median number of rooms in apartments:
Here:
3.9
State:
4.3
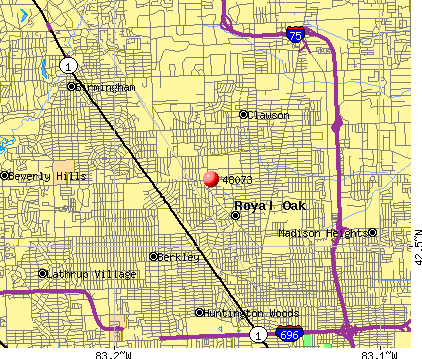
Notable locations in this zip code not listed on our city pages
Notable locations in zip code 48073: Royal Oak Golf Course (A), Red Run Golf Club (B), Normandy Oaks Golf Club (C), Royal Oak Fire Department Station 3 (D), Royal Oak Fire Department Station 2 (E). Display/hide their locations on the map
Parks in zip code 48073 include: Starr Park (1), Sullivan Park (2), Sunnybrook Park (3), Upton Park (4), Wagner Park (5), Amherst Park (6), Clawson Park (7), Orson Starr Home Historical Marker (8), Roseland Park Mausoleum Historical Marker (9). Display/hide their locations on the map
3,516 married couples with children.
1,274 single-parent households (217 men, 1,057 women).
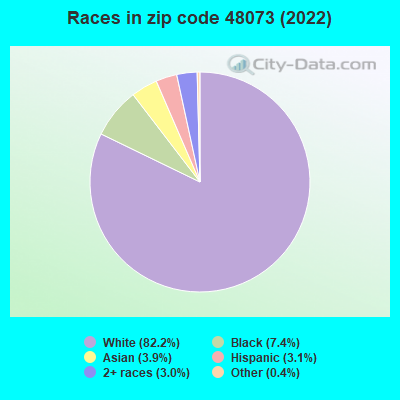
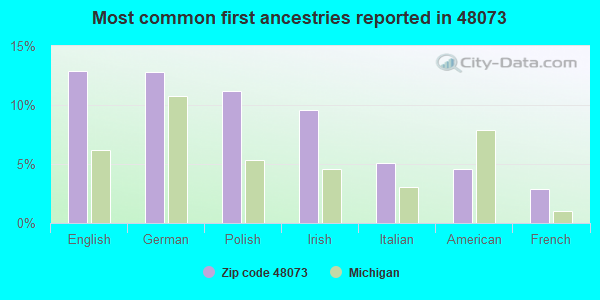
93.3% of residents of 48073 zip code speak English at home.
1.5% of residents speak Spanish at home (89% very well, 6% well, 6% not well).
2.6% of residents speak other Indo-European language at home (79% very well, 14% well, 6% not well, 1% not at all).
1.4% of residents speak Asian or Pacific Island language at home (59% very well, 26% well, 13% not well, 3% not at all).
0.9% of residents speak other language at home (62% very well, 30% well, 7% not at all).
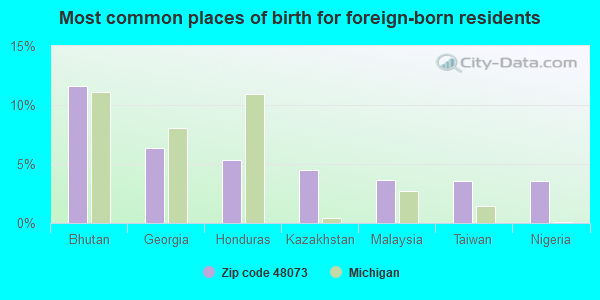
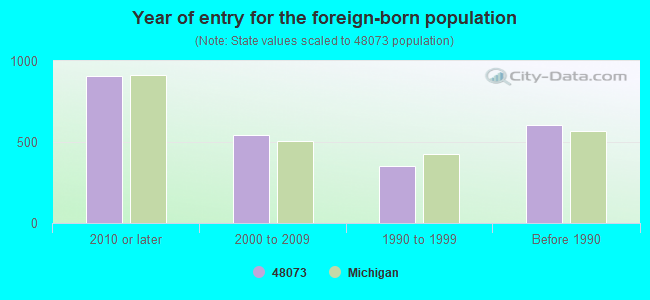
Foreign born population: 2,007 (5.9%) (56.5% of them are naturalized citizens)
Major facilities with environmental interests located in this zip code:
ALFRED E. UPTON ELEMENTARY SCHOOL (4400 MANDALAY AVENUE in ROYAL OAK, MI)
(National Center for Education Statistics) - STATE ID-04264 Organizations: SCHOOL DISTRICT OF THE CITY OF ROYAL OAK (SCHOOL DISTRICT)
AMOCO OIL CO 3895 (30875 WOODWARD SITE B in ROYAL OAK, MI)
(Resource Conservation and Recovery Act (tracking hazardous waste)) Organizations: AMOCO OIL COMPANY (CONTACT/OWNER)
AXLE ENGINEERING (4610 DELEMERE in ROYAL OAK, MI)
(Resource Conservation and Recovery Act (tracking hazardous waste)) Organizations: MOON ERIC W (CONTACT/OWNER)
BODY PERFECT AUTO BODY SPECIALIST (4818 LEAFDALE in ROYAL OAK, MI)
(Resource Conservation and Recovery Act (tracking hazardous waste)) Organizations: FRANKLIN GLENN AND GRZESIK PETER (CONTACT/OWNER)
MCPEEKS INC (1702 13 MILE in ROYAL OAK, MI)
(Resource Conservation and Recovery Act (tracking hazardous waste)) Organizations: CHARLES R MCPEEK (CONTACT/OPERATOR)
Alternative names: MOBIL OIL CORP SS K2N
MELCO ENGRAVING INC (4223 EDGELAND in ROYAL OAK, MI)
FLETCHER PAINTING (2611 W 14 MILE in ROYAL OAK, MI)
(Resource Conservation and Recovery Act (tracking hazardous waste)) Organizations: FLETCHER WILLIAM (CONTACT/OPERATOR)
FLEX N GATE (4336 COOLIDGE in ROYAL OAK, MI)
(Resource Conservation and Recovery Act (tracking hazardous waste)) Organizations: FLEX N GATE MICHIGAN LLC (CONTACT/OPERATOR)
Alternative names: HAWTHORNE METAL PRODUCTS
GLASSWORKS INC THE (4819 FERNLEE in ROYAL OAK, MI)
(Resource Conservation and Recovery Act (tracking hazardous waste)) Organizations: SPINDLER BOB AND VICI PHIL (CONTACT/OWNER)
GTE VALENITE CORP (4321 DELEMERE CT in ROYAL OAK, MI)
(Resource Conservation and Recovery Act (tracking hazardous waste))
(Resource Conservation and Recovery Act (tracking hazardous waste))
Housing units lacking complete plumbing facilities: 1.0% Housing units lacking complete kitchen facilities: 0.8%
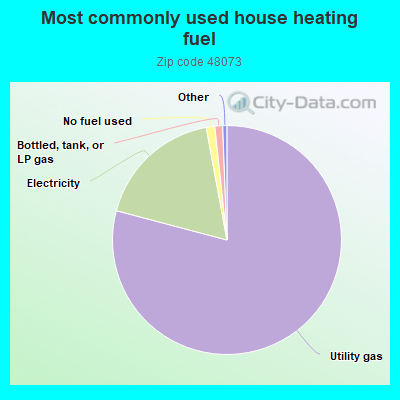
79.2%Utility gas
18.0%Electricity
1.2%No fuel used
1.1%Bottled, tank, or LP gas
Population in 1990: 32,093. Population change in the 1990s: +2,620 (+8.2%).
Place of birth for U.S.-born residents:
This state: 26,254
Northeast: 1,133
Midwest: 2,040
South: 1,125
West: 796
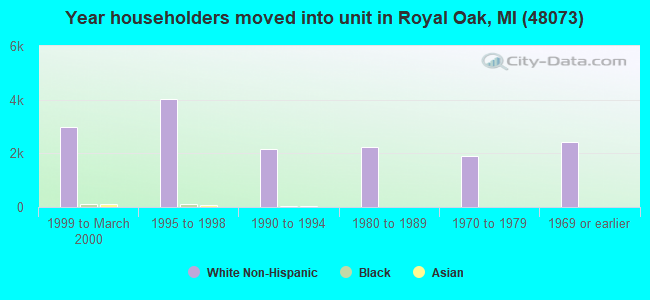
60% of the 48073 zip code residents lived in the same house 5 years ago. Out of people who lived in different houses, 60% lived in this county. Out of people who lived in different counties, 50% lived in Michigan.
85% of the 48073 zip code residents lived in the same house 1 year ago. Out of people who lived in different houses, 61% moved from this county. Out of people who lived in different houses, 23% moved from different county within same state. Out of people who lived in different houses, 12% moved from different state. Out of people who lived in different houses, 2% moved from abroad.
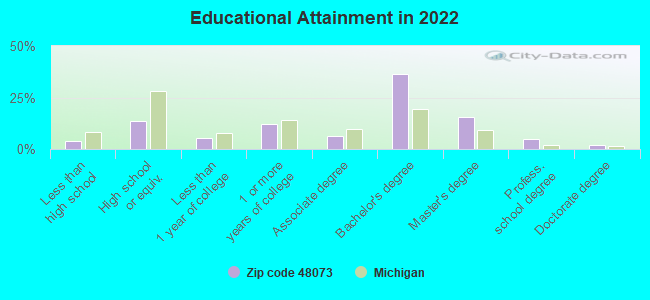
Private vs. public school enrollment:
Students in private schools in grades 1 to 8 (elementary and middle school): 439
Here:
27.2%
Michigan:
12.4%
Students in private schools in grades 9 to 12 (high school): 194
Here:
17.4%
Michigan:
9.8%
Students in private undergraduate colleges: 81
Here:
6.5%
Michigan:
14.9%
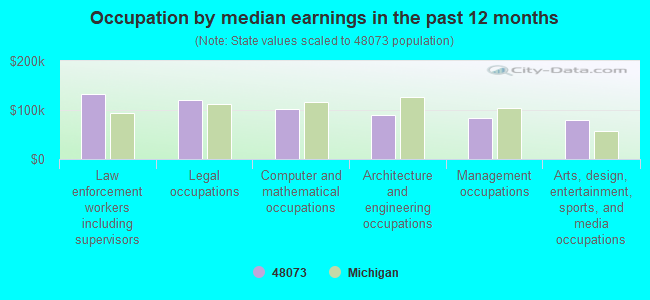
Occupation by median earnings in the past 12 months ($)
132,679Law enforcement workers including supervisors
120,843Legal occupations
102,475Computer and mathematical occupations
90,156Architecture and engineering occupations
82,966Management occupations
80,552Arts, design, entertainment, sports, and media occupations
Companies with federal contracts located in this zip code (ROYAL OAK, MI):
CONSUMERS ENERGY (INC) (4600 COOLIDGE HWY STE CE) : $1,528,835 in 22 contractsfrom 1999 to 2001
Contracts for Gas Services by Army Signed by year:2000: $785,141; 2001: $670,805; 2002: $0; 2003: $0; 2004: $0; 2005: $0; 2006: $0.
Biggest contracts:
$183,849 with Army for Gas Services. Signed on 2000-02-11. Completion date: 2000-02-07.
$129,184, same as above.Signed on 2001-01-18. Completion date: 2001-01-05.
$113,616, same as above.Signed on 2001-02-21. Completion date: 2001-02-05.
$103,750, same as above.Signed on 2000-12-19. Completion date: 2000-12-05.
AMPION CORP (4921 LEAFDALE BLVD; small business) : $429,198 in 13 contractsfrom 2002 to 2005
Contracts for ADP Support Equipment, Maintenance, Repair and Rebuilding of Equipment -- Automatic Data Processing Equipment (Including Firmware), Software, Supplies and Support Equipment, ADPE System Configuration, Machining Centers and Way-Type Machines, and moreby Army Signed by year:2000: $0; 2001: $0; 2002: $345,429; 2003: $21,970; 2004: $56,540; 2005: $5,259; 2006: $0.
Biggest contracts:
$76,512 with Army for ADP Support Equipment. Taking place in IL. Signed on 2002-09-20. Completion date: 2003-02-18.
$74,838, same as above.Signed on 2002-09-20. Completion date: 2003-02-18.
$71,362, same as above.Signed on 2002-03-12. Completion date: 2002-06-14.
$56,540 with Army for Maintenance, Repair and Rebuilding of Equipment -- Automatic Data Processing Equipment (Including Firmware), Software, Supplies and Support Equipment. Signed on 2004-01-21. Completion date: 2004-04-04.
OLIVER JAKOB (3214 N ALEXANDER; small business) : $25,416 in 4 contractsin 2003
$13,116 with Army for Custodial Janitorial Services. Signed on 2003-02-06. Completion date: 2002-02-28.
$12,300, same as above.Signed on 2003-02-16. Completion date: 2004-02-28.
$0, same as above.Signed on 2003-02-06. Completion date: 2002-02-28.
$0, same as above.Signed on 2003-02-16. Completion date: 2004-02-28.
RECREATIONAL DIVING SYSTEMS (32552 WOODWARD AVE; small business)
$3,840 with U.S. Army Corps of Engineers - civil program financing only for Marine Lifesaving and Diving Equipment. Signed on 2000-04-07. Completion date: 2000-05-31.
Top industries in this zip code by the number of employees in 2005:
Health Care and Social Assistance: General Medical and Surgical Hospitals (over 1000 employees: 1 establishment)
2002 - 2018 National Fire Incident Reporting System (NFIRS) incidents
According to the data from the years 2002 - 2018 the average number of fire incidents per year is 50. The highest number of reported fires - 95 took place in 2003, and the least - 0 in 2007. The data has a declining trend.
When looking into fire subcategories, the most incidents belonged to: Structure Fires (49.7%), and Outside Fires (25.5%).
Fire incident types reported to NFIRS in Zip Code 48073

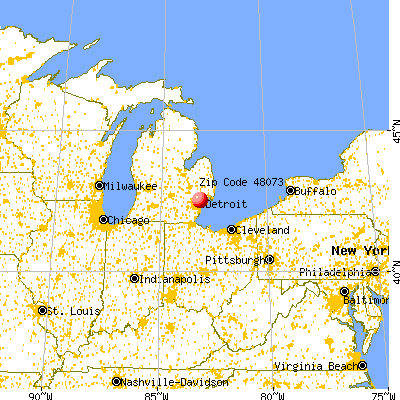


 Nearest zip codes: 48017, 48072, 48070, 48067, 48084, 48069.


 According to the data from the years 2002 - 2018 the average number of fire incidents per year is 50. The highest number of reported fires - 95 took place in 2003, and the least - 0 in 2007. The data has a declining trend.
 When looking into fire subcategories, the most incidents belonged to: Structure Fires (49.7%), and Outside Fires (25.5%).